
ArmanFx Trader
Technical Analyst at Search me on Telegram Gold master club
Pakistan
Sharing market insights and technical analysis.
Focused on XAUUSD price action and smart money concepts.
Grafikler ve Fikirler
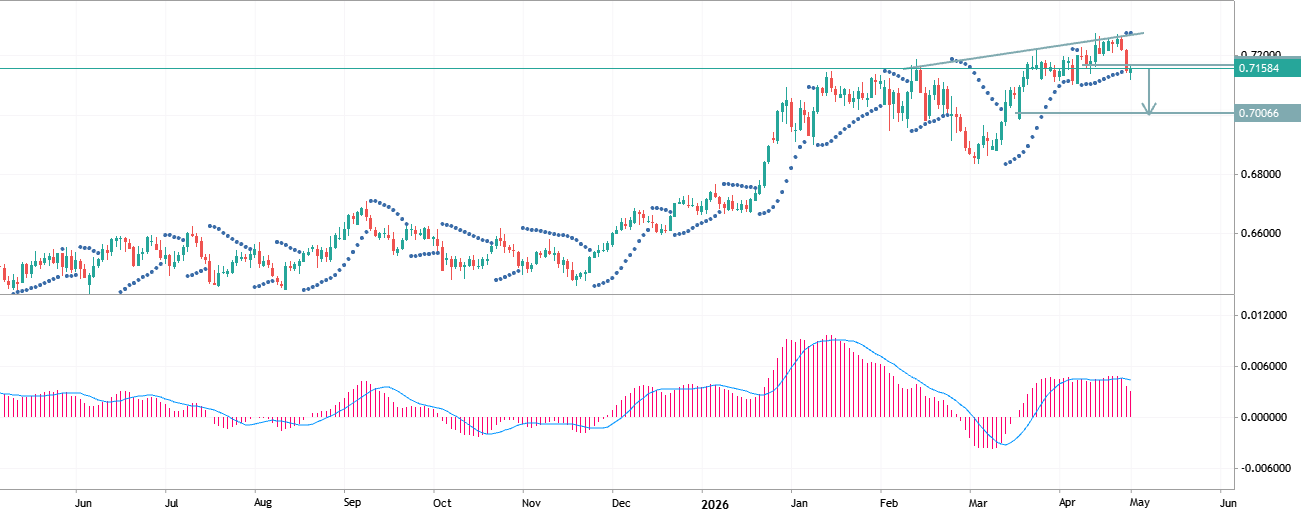
🇦🇺 AUDUSD has bounced off the trend line
🇦🇺 AUDUSD has bounced off the trend line and is beginning to correct, as confirmed by the Parabolic SAR. The MACD also suggests a potential decline.
We are considering selling AUDUSD if it falls below 0.7150; 🎯 Target: 0.7000.
2026.05.18 09:33 1 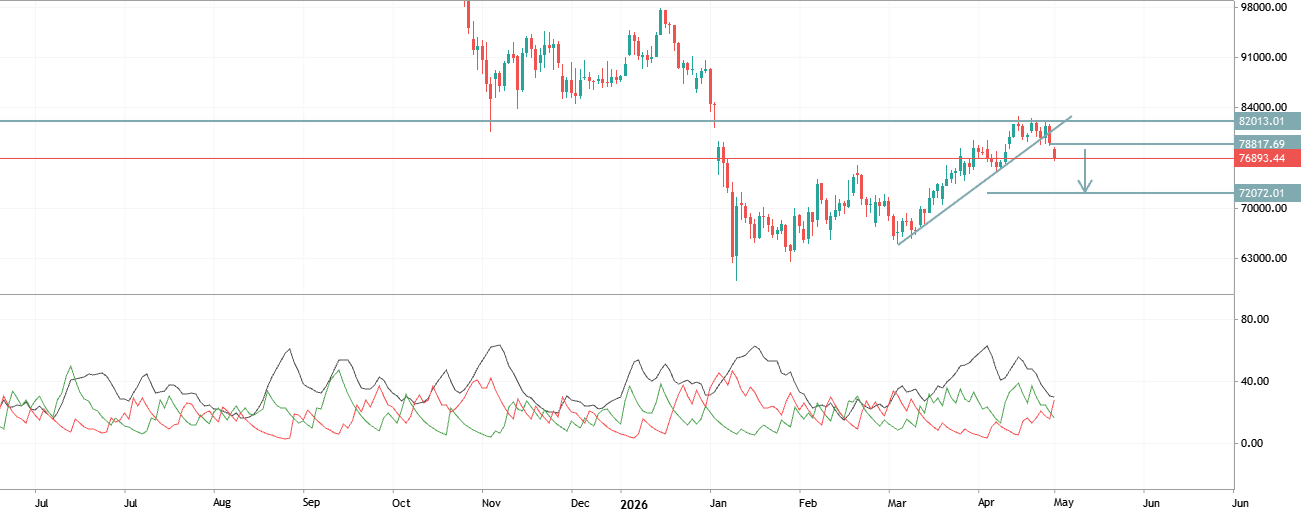
Bitcoin has broken through the upward trend line
Bitcoin has broken through the upward trend line, and the -DI has crossed below the +DI on the ADX.
If BTCUSD consolidates below 78,000, the downtrend will continue; Target: 72,000.
2026.05.18 09:26 0 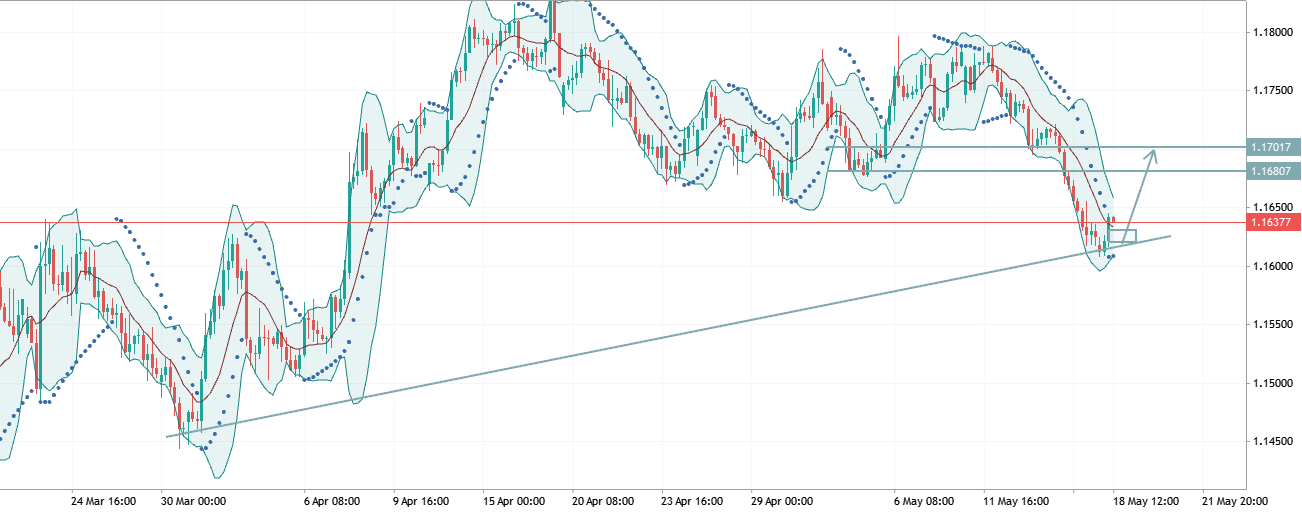
EURUSD bounced off the global trend line
EURUSD bounced off the global trend line after breaking below the lower Bollinger Band. The Parabolic SAR also confirms the possibility of a correction.
We are considering buying EURUSD if it rises above 1.1640; Target 1: 1.1680; Target 2: 1.1700 (optional)
2026.05.18 09:18 1 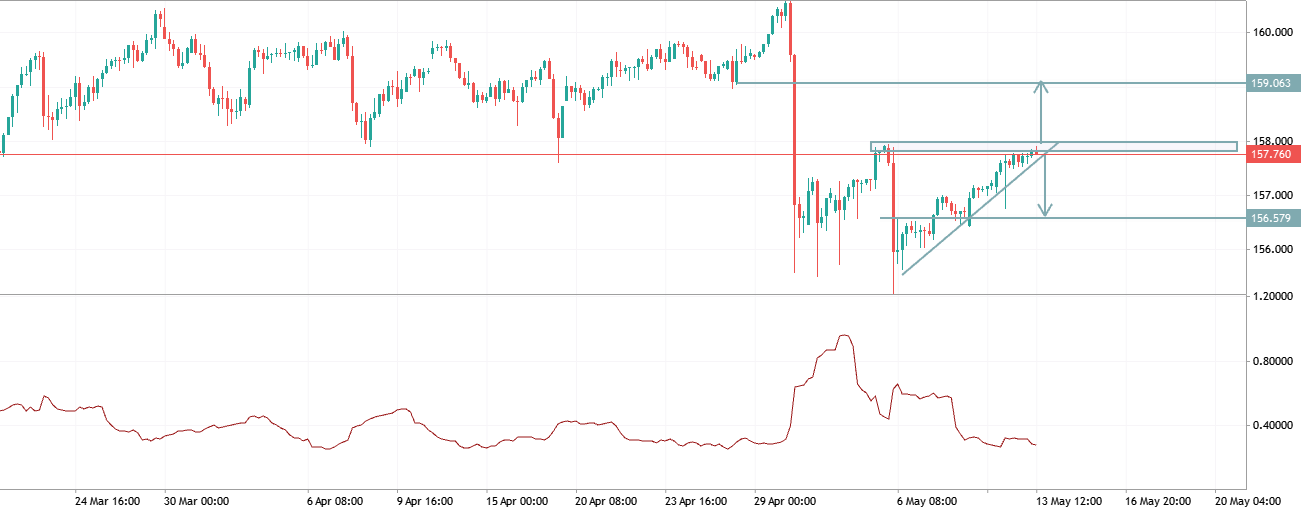
USDJPY has reached a critical resistance level
USDJPY has reached a critical resistance level, drawing out liquidity, and the price is testing the uptrend line. %R has moved out of the overbought zone, suggesting a potential decline.
🔼 Consolidation above 157.900 will open the way to 159.000; 🔽 A break below the lower trend line at 157.700 will send USDJPY down to 157.000 and 156.600.
2026.05.13 12:10 1 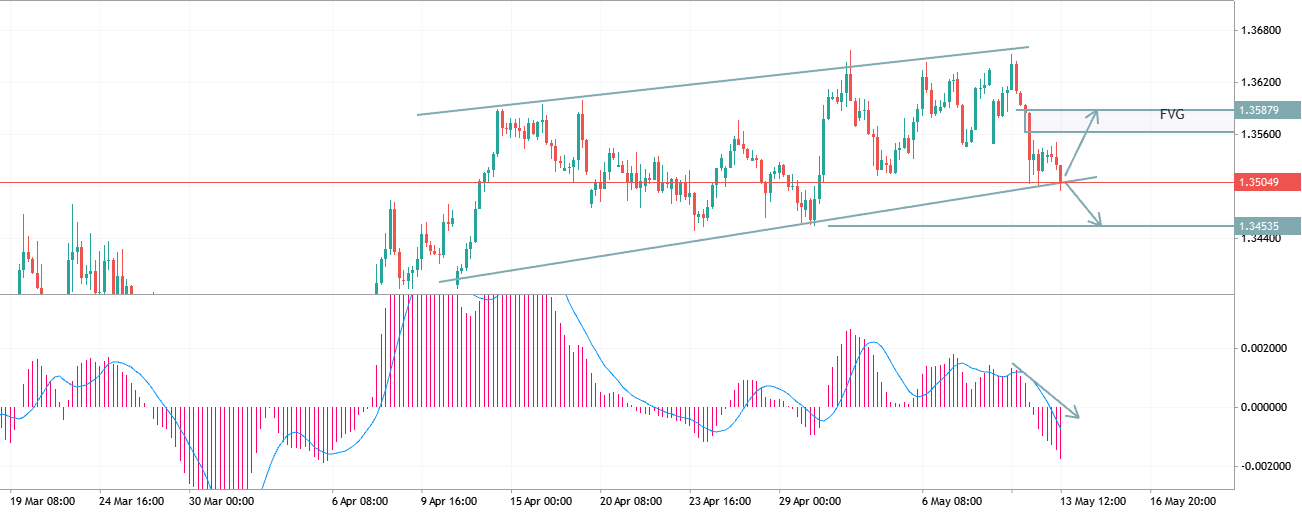
GBPUSD is testing the lower trendline
GBPUSD is testing the lower trendline of the ascending channel, and the MACD histogram confirms bearish dominance in the short term. However, there is an FVG above, acting as a magnet for the price.
⤵️ A break below the trendline at 1.3500 will send GBPUSD down to 1.3460; ⤴️ A rebound will push the price back to 1.3580.
2026.05.13 12:02 0 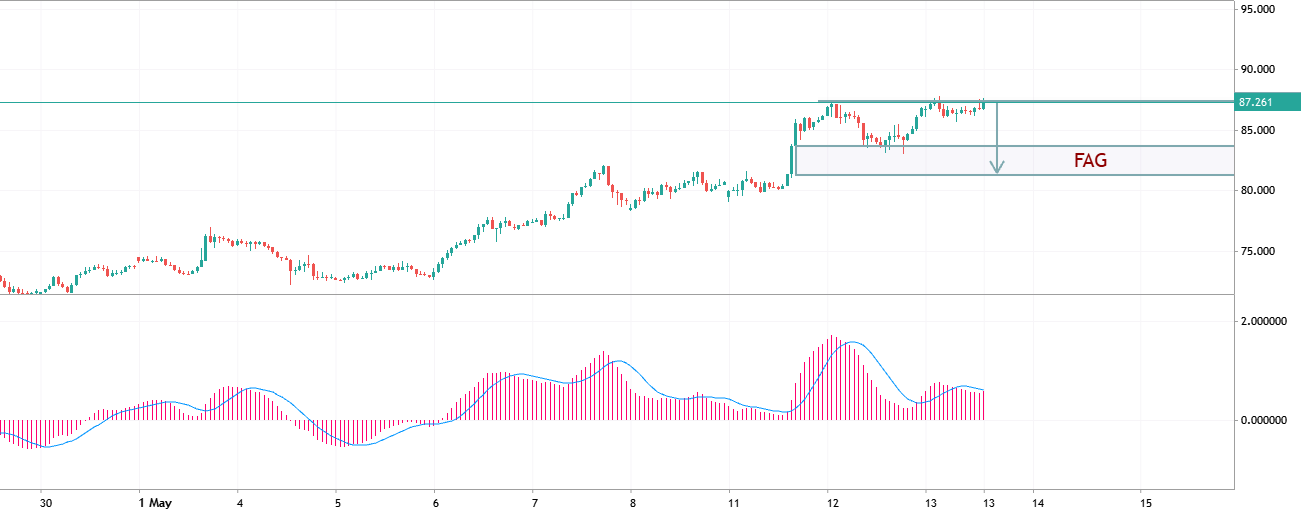
XAGUSD ANALYSIS
🥈 XAGUSD is correcting and may fall below the nearest fractal and close below the large imbalance. The MACD confirms the potential for a decline.
We are considering selling XAGUSD if it falls below 87.500; Target: 82.000.
2026.05.13 11:54 0 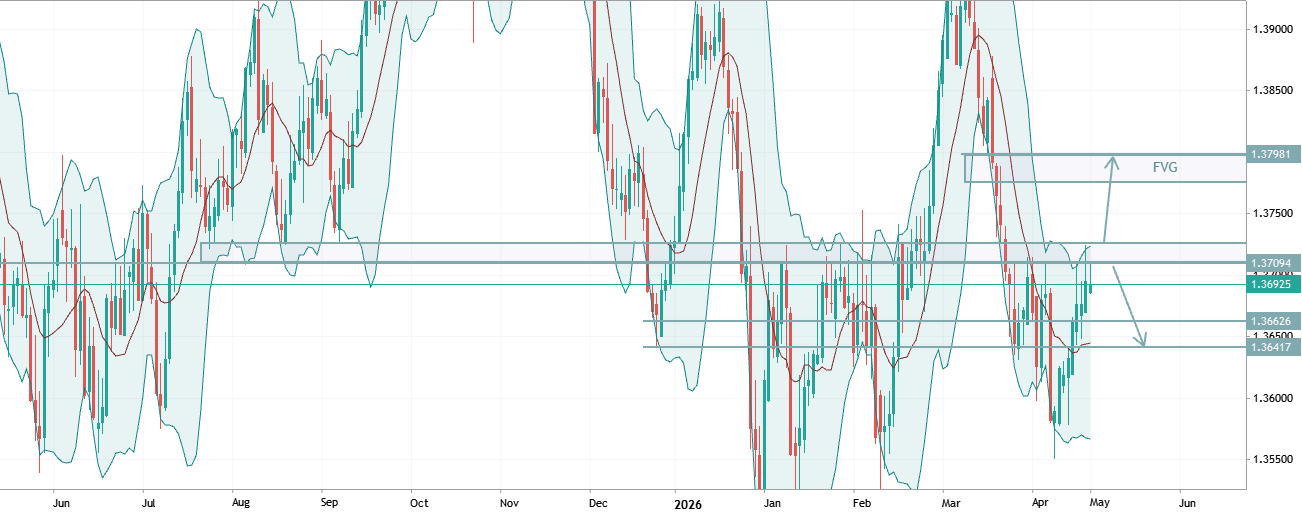
USDCAD TRADE IDEA
USDCAD is approaching a very strong level from which there have already been five rebounds. The price is testing the upper Bollinger Band, but there is an imbalance at the top.
A break above the 1.3710 resistance level will open the way to 1.3775; A pullback will drop USDCAD to 1.3660 and further to 1.3640.
2026.05.13 11:48 0 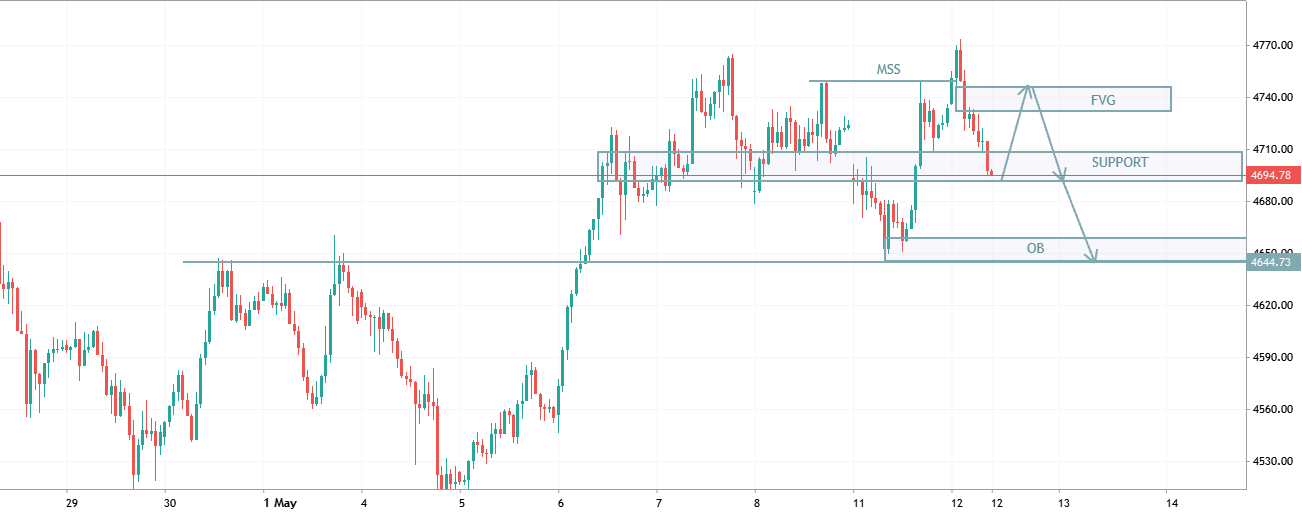
XAUUSD (Gold) Analysis
XAUUSD (Gold) Analysis
Gold is currently trading inside a corrective structure after taking liquidity from the highs near the MSS zone.
Price rejected from the FVG / supply area around 4740-equivalent zone on your chart and is now sitting near key support.
Bearish Scenario: • Break & close below support zone • Momentum continuation toward the OB demand below • Liquidity sweep already taken from highs
Target 1: Internal liquidity lows Target 2: OB zone below Final target: Full imbalance fill
Bullish Scenario: If support holds and buyers reclaim the FVG zone, gold can push back toward recent highs.
Right now this looks more like: “retest → reaction → then directional move” rather than immediate trend continuation
https://www.mql5.com/en/users/xking05
2026.05.12 07:17 0 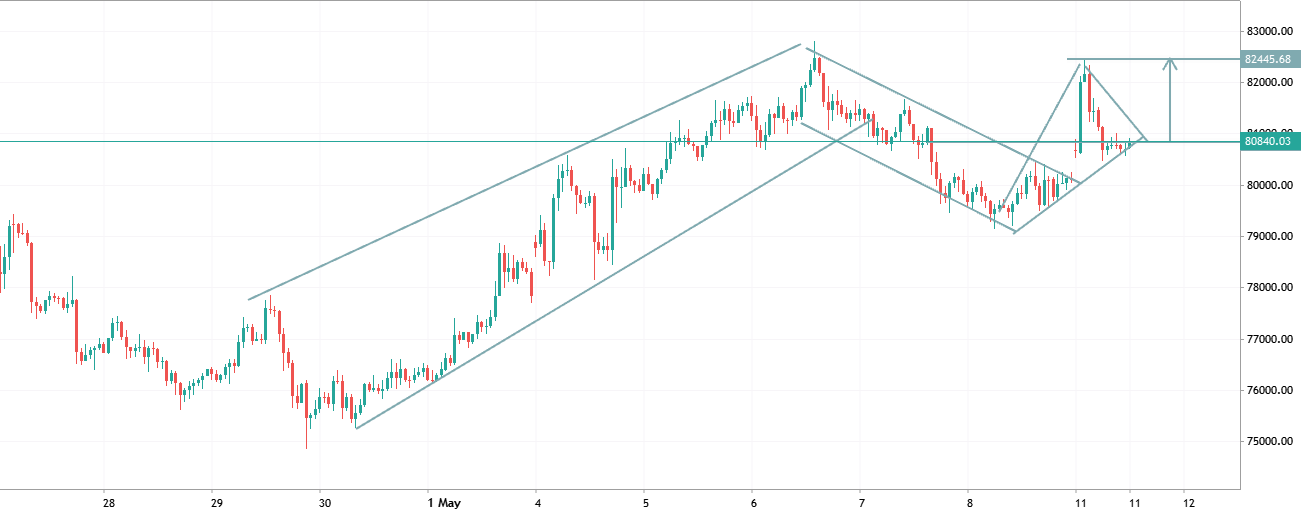
BTCUSD ANALYSIS
BTCUSD ANALYSIS ₿ BTC is currently showing a bullish market structure, while forming a potential Bullish Flag / Pennant pattern in the short term. After a strong impulsive rally, price has entered a consolidation phase around the 80.8k - 81k zone, which often signals continuation if buyers remain in control. Bullish Confirmation: • Break & close above the 81,500 – 82,000 resistance zone • Strong momentum and volume continuation Target 1: 82,500 Target 2: 83,000+ Invalidation: If BTC closes strongly below the 80k support zone, the bullish setup weakens and a deeper pullback may follow. Key Observations: • Higher lows are still being respected • Market structure remains bullish overall • Current movement looks more like consolidation than reversal In simple terms: Break above 81k =
2026.05.11 09:39 0 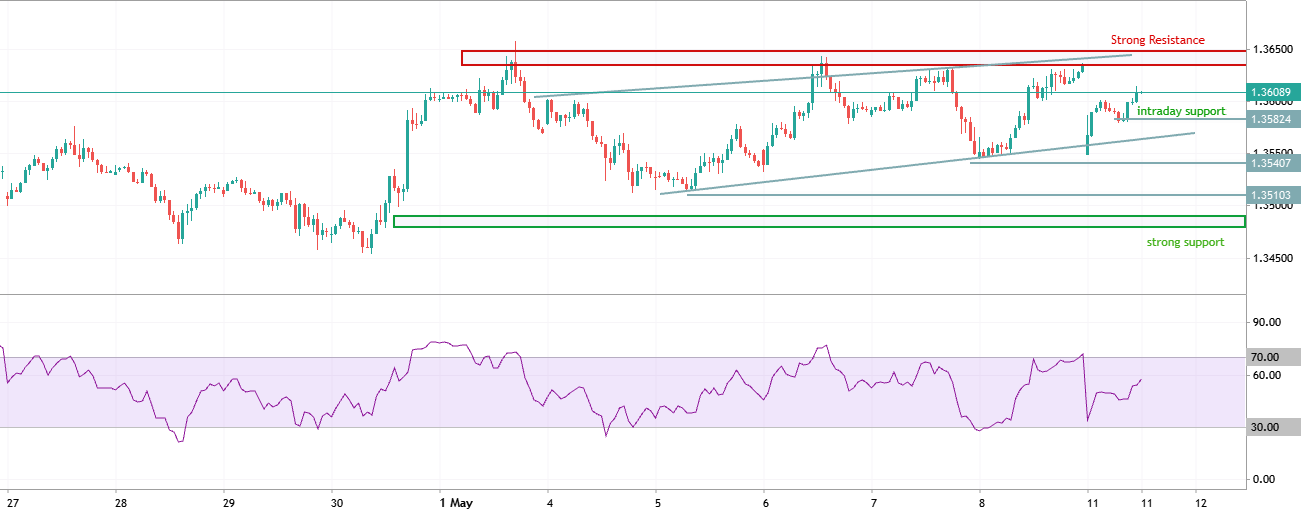
GBP/USD BUY SETUP
GBP/USD BUY SETUP
GBPUSD is maintaining a bullish market structure with clear higher highs & higher lows after a strong rebound from the 1.3540 support zone. Price is now approaching a key resistance area near 1.3620.
Buyers remain in control while price stays above 1.3580.
Buy Confirmation: • Break & close above 1.3620 • Strong bullish continuation toward upper resistance liquidity
Target 1: 1.3650 Target 2: 1.3680
Invalidation: Below 1.3580
Bearish Scenario: If price gets rejected from the 1.3620–1.3650 resistance zone, expect a pullback toward:
1.3540 1.3500
Overall Bias: Bullish unless support breaks
https://www.mql5.com/en/users/xking05
2026.05.11 09:02 0 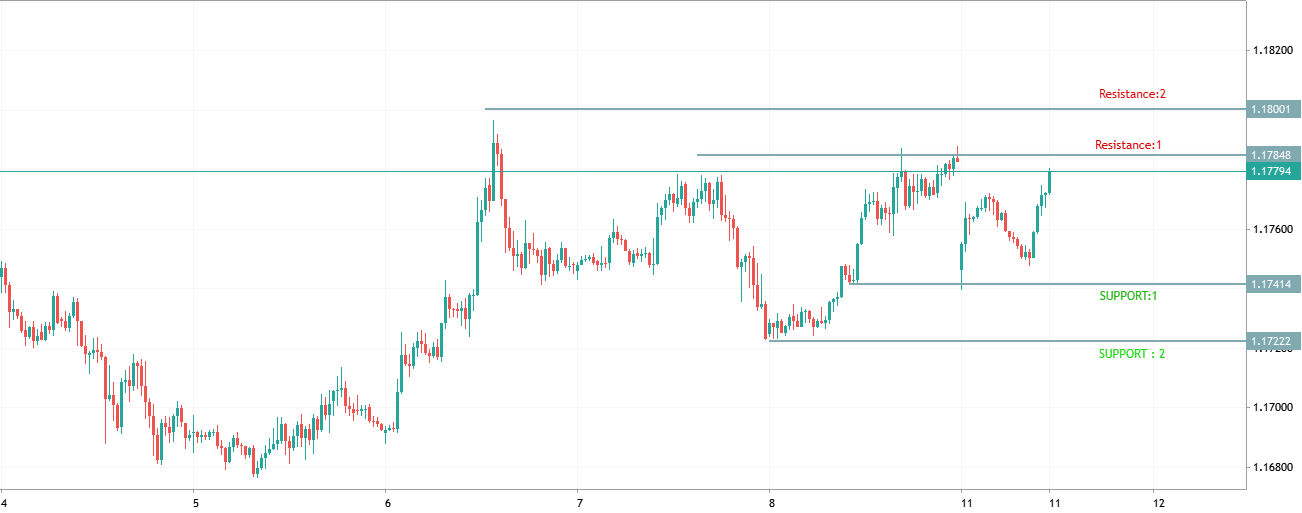
EUR/USD BUY SETUP
EUR/USD BUY SETUP
EURUSD is showing a bullish structure with higher lows formation after a strong rebound from support. Price is now testing a key resistance zone around 1.1775.
Buyers are still in control while price remains above 1.1750.
Buy Confirmation: • Break & close above 1.1785 • Momentum continuation toward upper liquidity
Target 1: 1.1800 Target 2: 1.1830
Invalidation: Below 1.1750
Bearish Scenario: If price gets rejected from 1.1785–1.1800 zone, expect a pullback toward: 1.1750 1.1720
Overall Bias: Bullish unless support breaks
2026.05.11 08:36 0 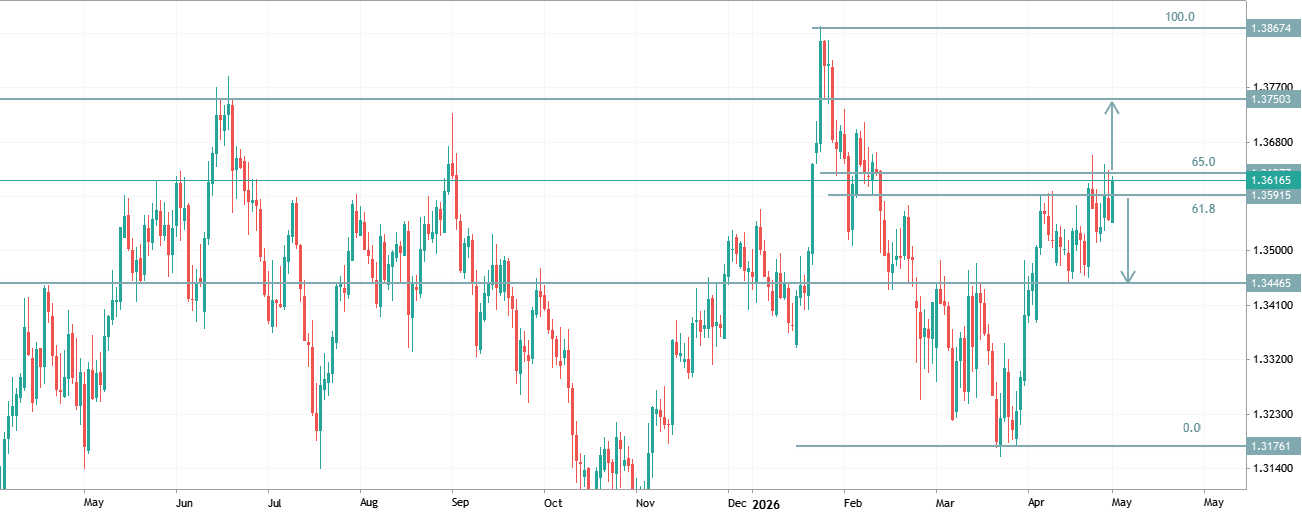
GBPUSD TRADE IDEA - Golden Fibonacci Zone
💷GBPUSD is consolidating near the Golden Fibonacci Zone ahead of today’s US NFP release, having reached the upper Bollinger Band.
A break above 1.3610 will open the way to 1.3750; A pullback will send GBPUSD down to 1.3450.
2026.05.08 10:22 1