

ArmanFx Trader
Technical Analyst en Search me on Telegram Gold master club
Pakistán
 Abrir perfil en MQL5
Gráficos e ideas
XAUUSD TRADE IDEA
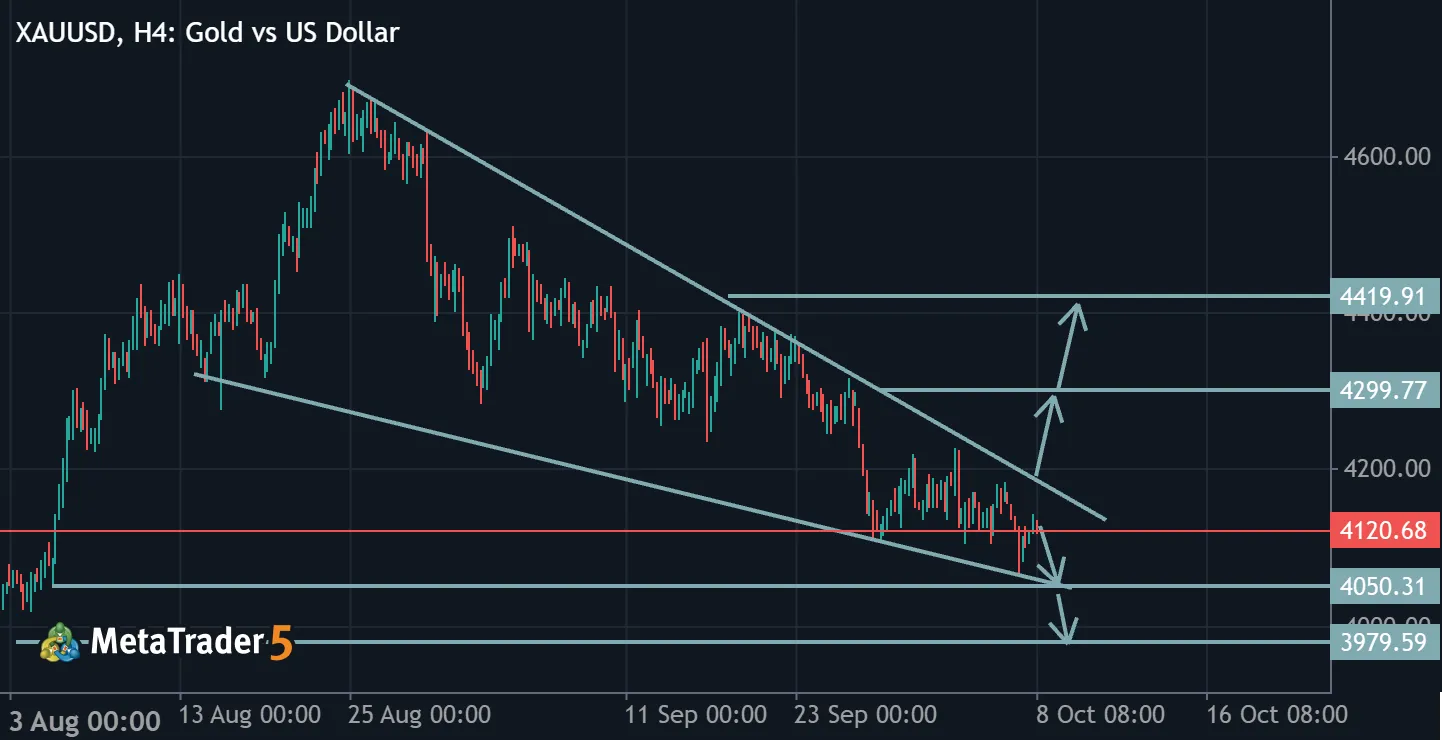
XAUUSD H4 – Technical Analysis 📊
Gold is currently moving inside a descending channel, forming lower highs and lower lows. Price is now consolidating near the lower boundary, creating a possible breakout setup.
🔹 Bullish scenario: Break & close above 4160 → TP 4300 / 4420 🔻 Bearish scenario: Break below 4080 → TP 4050 / 3980
Key level: 4129 Waiting for a confirmed breakout before considering an entry.
This is technical analysis, not financial advice. Trade with proper risk management.
#XAUUSD #Gold #TechnicalAnalysis #ForexTrading #MetaTrader
AUDUSD TRADE IDEA
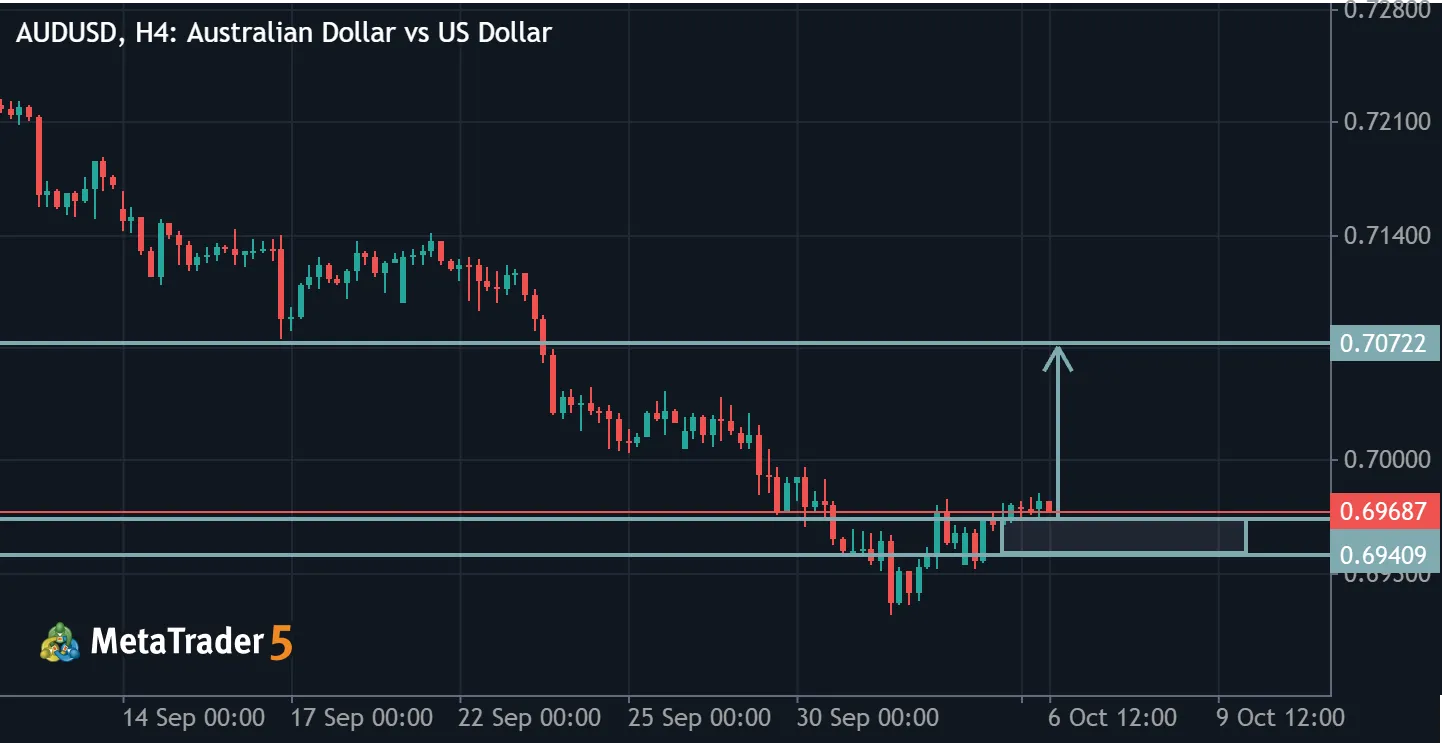
The asset has stopped making new local lows, which could indicate weakening selling pressure. The price is currently testing the 0.6969 resistance level. A Bullish Engulfing candlestick pattern has also formed on the chart, which could signal strengthening buying pressure.
#TradeIdea
If the price holds above 0.6969, the local structure could shift to bullish, after which further upside could be expected; 🎯 Target: 0.7010.
📲 Start Trading with US
EURUSD TRADE IDEA
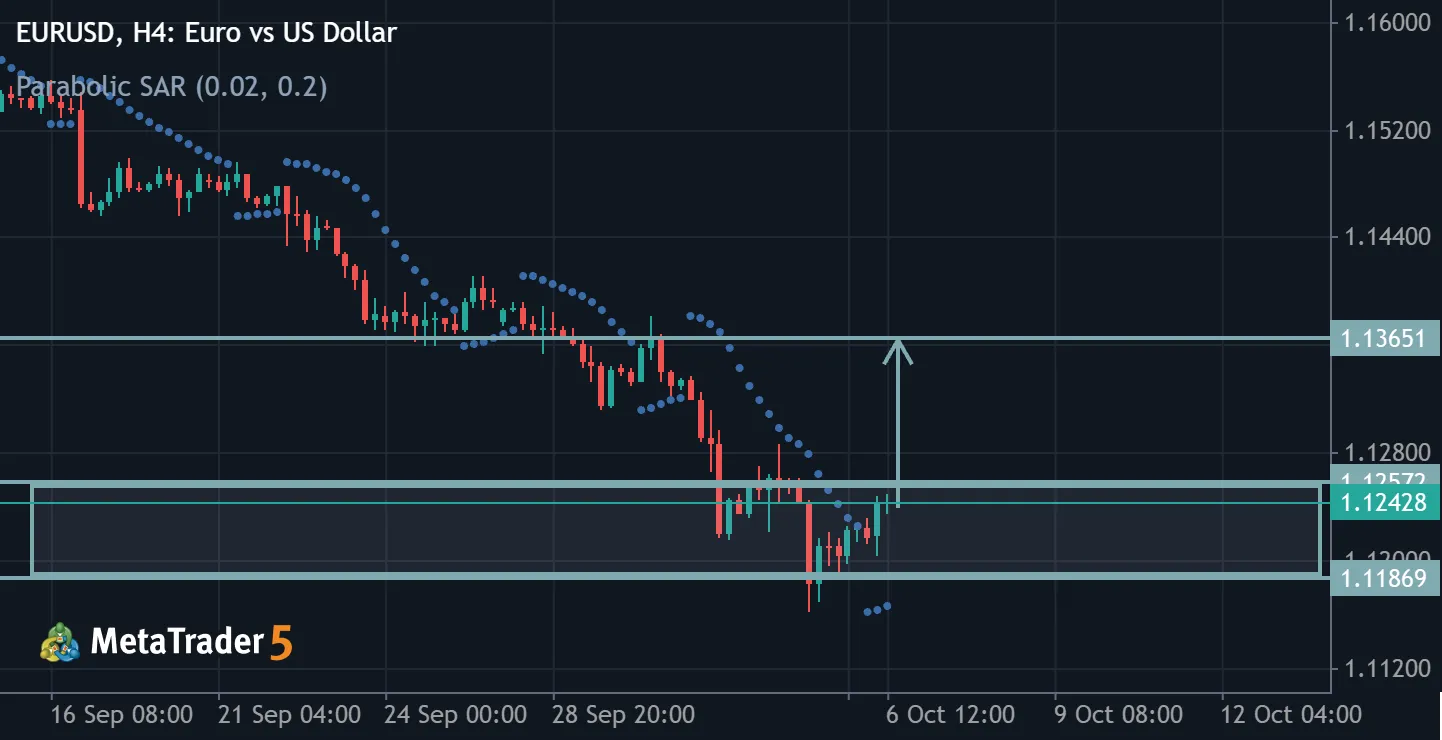
The asset is in a downtrend. However, after testing the 1.1182 support level, the price is showing a local upside move and is now approaching the local high and the 1.1261 resistance level.
#TradeIdea
If the price breaks above the 1.1261 resistance level, a corrective upside move could be expected; 🎯 TP1: 1.1315; 🎯 TP2: 1.1364.
📲 Start Trading with US
XUUUSD CHART ANALYSIS
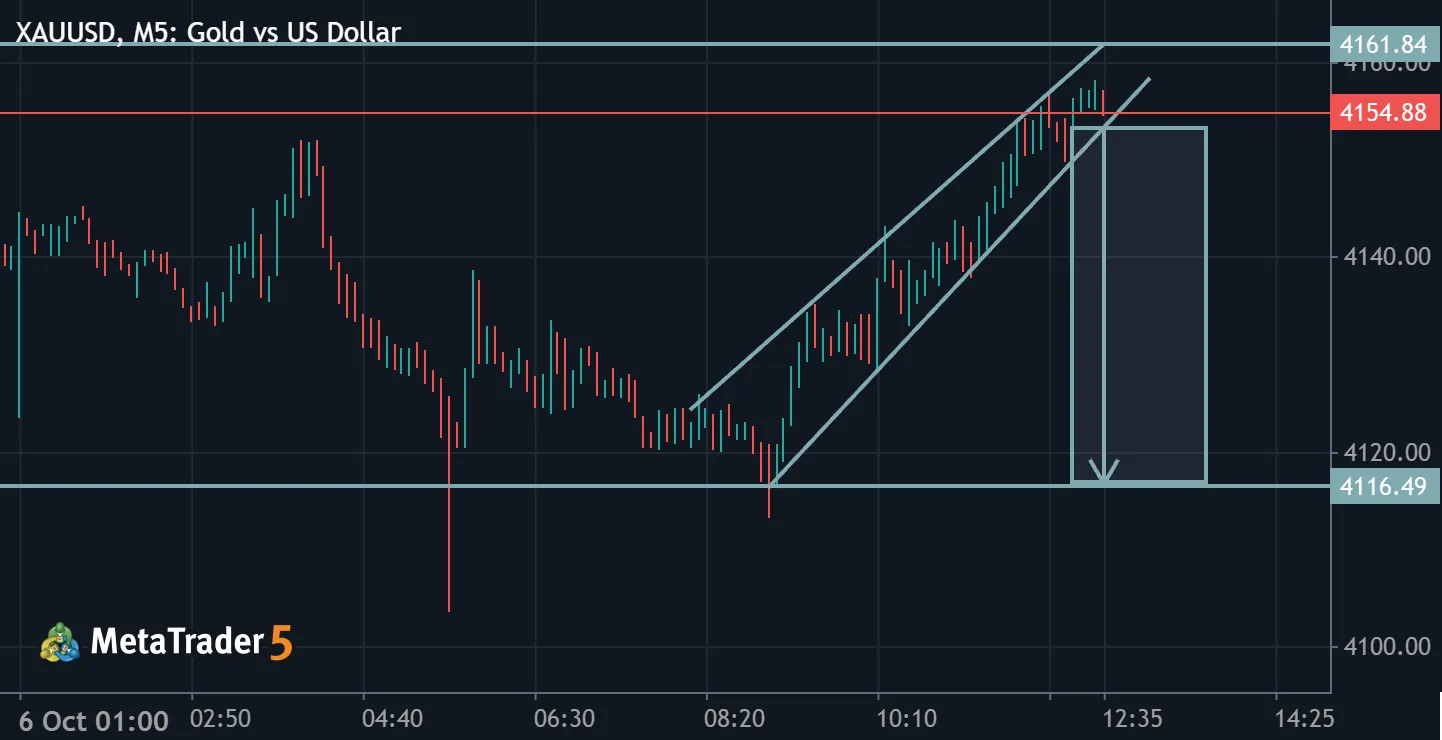
—XAUUSD Chart Analysis** Gold is moving inside an ascending channel, forming higher highs and higher lows after recovering from the marked horizontal support. Price is now near the channel’s upper boundary, where rejection or a pullback is possible. -Bullish scenario:As long as the lower channel boundary holds, the upward structure remains intact. A confirmed breakout above the upper boundary, followed by a successful retest, would favour further upside. - Bearish scenario: A clear candle close below the lower channel boundary, followed by a failed retest, would support a deeper correction toward the horizontal support marked on your chart. - Confirmation matters: The downward arrow shows a possible move—not a confirmed sell signal. Selling before the channel breaks would be trading
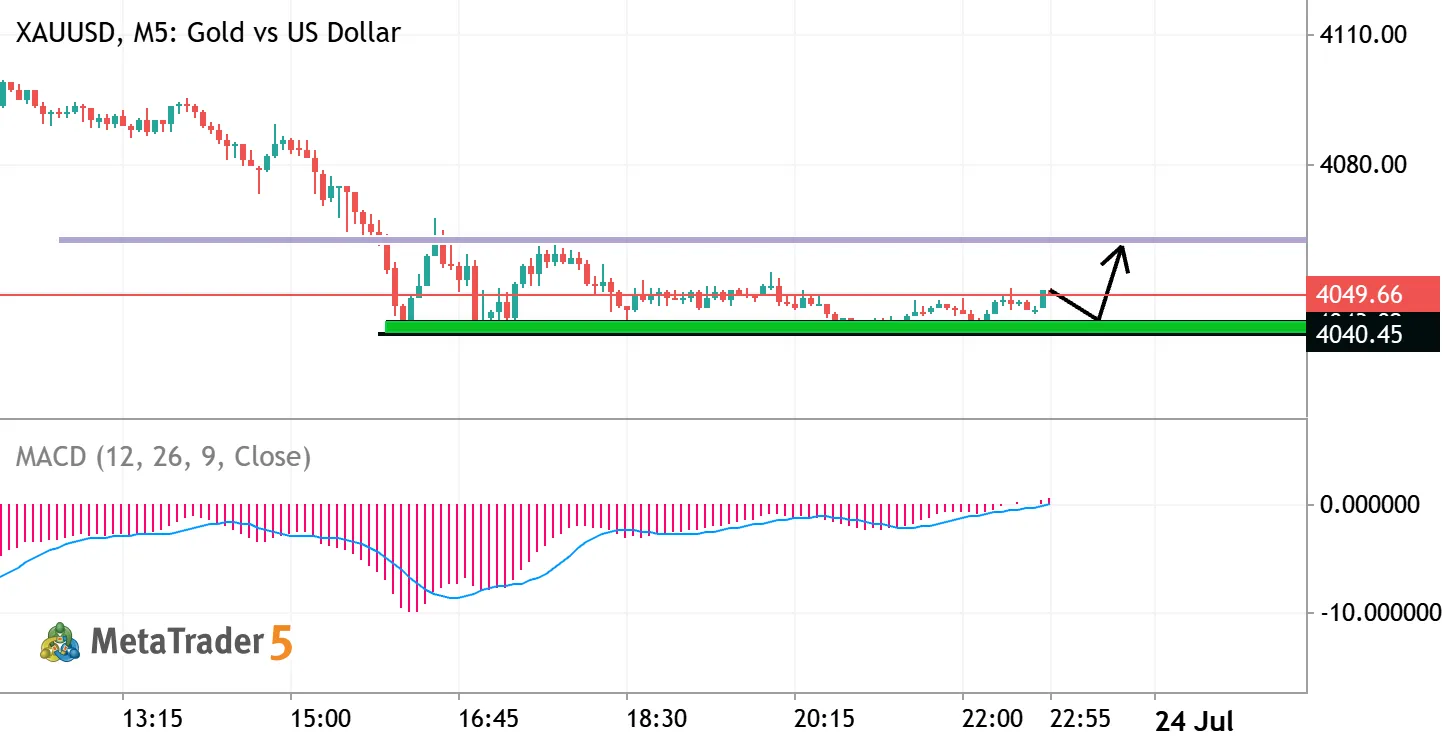
Gold trade idea
GOLD BUY Zone: 4040_4036 Target Levels • TP1:4050 • TP2: 4055 • TP3:4060 Stop Loss: 4032 Price is approaching a key support area where buying interest may begin to strengthen. I'Il wait for clear bullish confirmation before considering this setup Staying patient and allowing the market to confirm direction is the smarter approach. For educational purposes only. Not financial advice. Trade at your own risk.
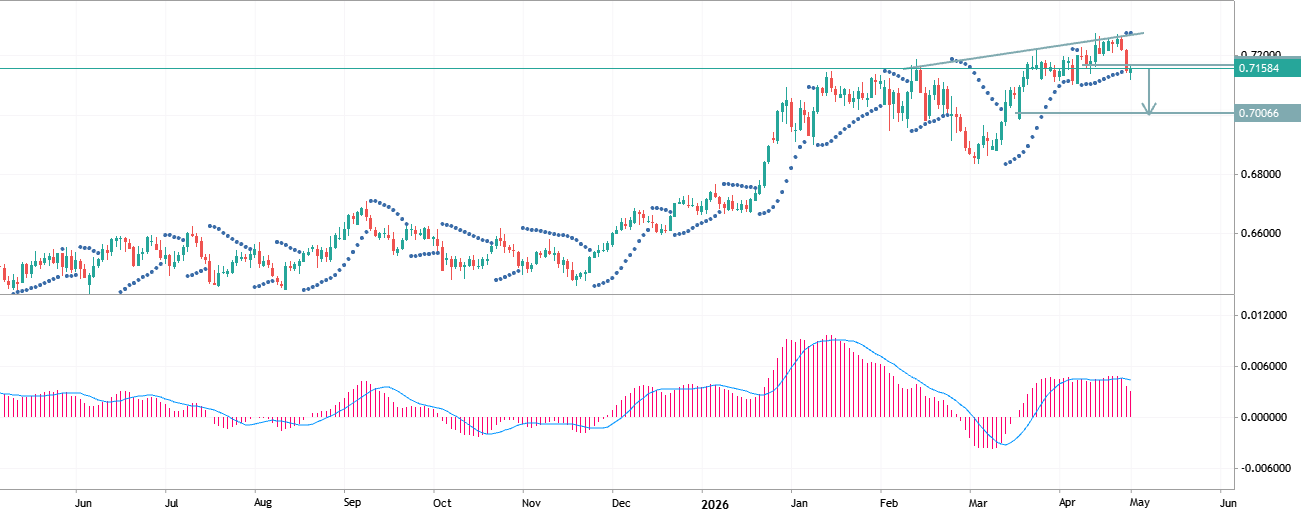
🇦🇺 AUDUSD has bounced off the trend line
🇦🇺 AUDUSD has bounced off the trend line and is beginning to correct, as confirmed by the Parabolic SAR. The MACD also suggests a potential decline.
We are considering selling AUDUSD if it falls below 0.7150; 🎯 Target: 0.7000.
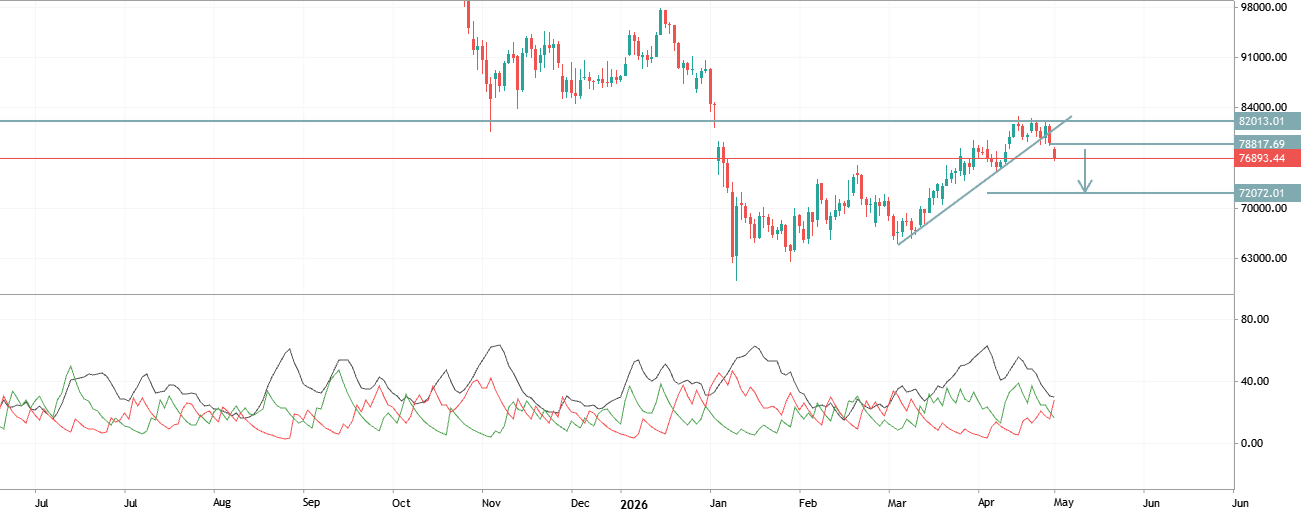
Bitcoin has broken through the upward trend line
Bitcoin has broken through the upward trend line, and the -DI has crossed below the +DI on the ADX.
If BTCUSD consolidates below 78,000, the downtrend will continue; Target: 72,000.
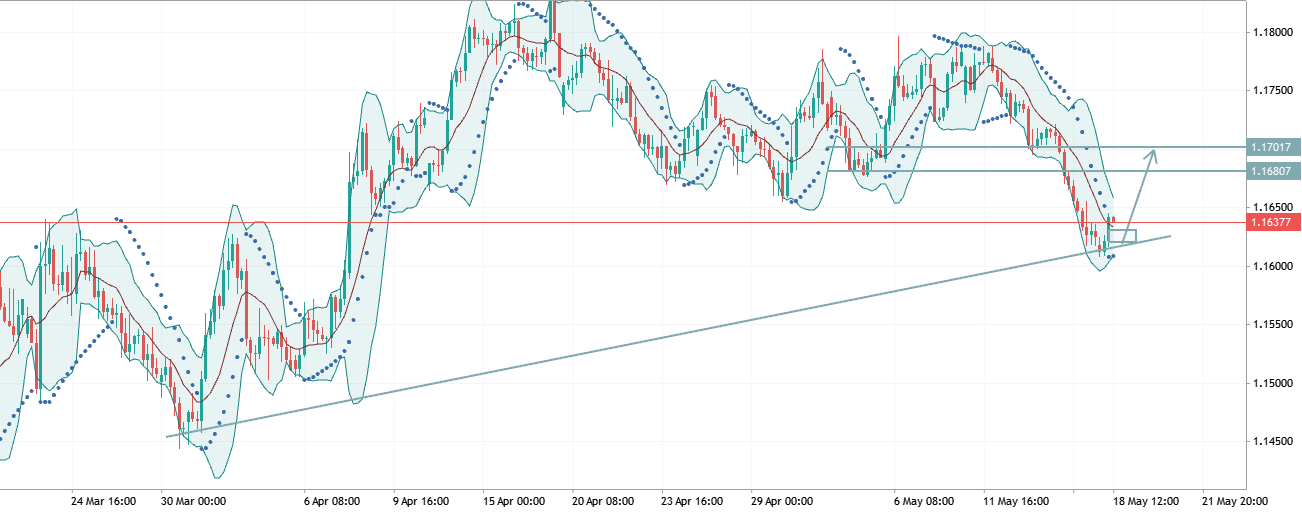
EURUSD bounced off the global trend line
EURUSD bounced off the global trend line after breaking below the lower Bollinger Band. The Parabolic SAR also confirms the possibility of a correction.
We are considering buying EURUSD if it rises above 1.1640; Target 1: 1.1680; Target 2: 1.1700 (optional)
USDJPY has reached a critical resistance level
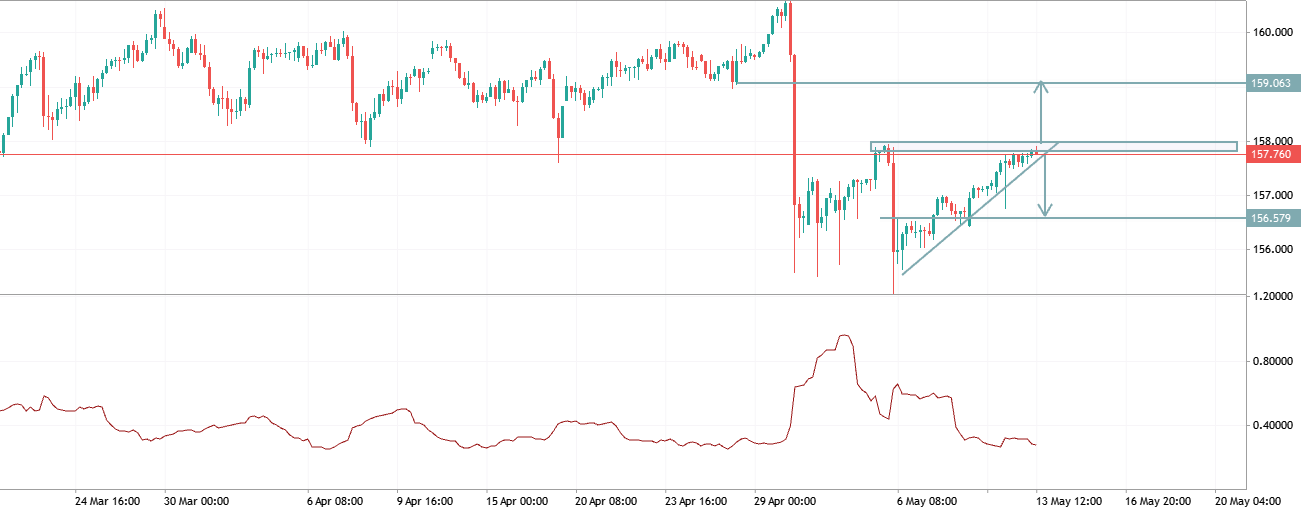
USDJPY has reached a critical resistance level, drawing out liquidity, and the price is testing the uptrend line. %R has moved out of the overbought zone, suggesting a potential decline.
🔼 Consolidation above 157.900 will open the way to 159.000; 🔽 A break below the lower trend line at 157.700 will send USDJPY down to 157.000 and 156.600.
GBPUSD is testing the lower trendline
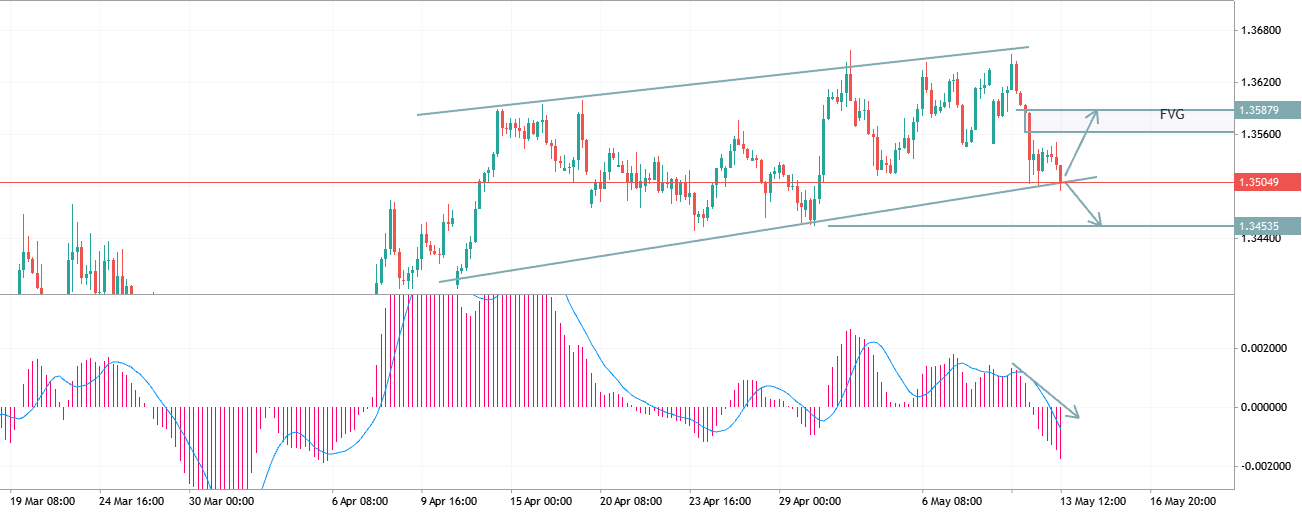
GBPUSD is testing the lower trendline of the ascending channel, and the MACD histogram confirms bearish dominance in the short term. However, there is an FVG above, acting as a magnet for the price.
⤵️ A break below the trendline at 1.3500 will send GBPUSD down to 1.3460; ⤴️ A rebound will push the price back to 1.3580.
XAGUSD ANALYSIS
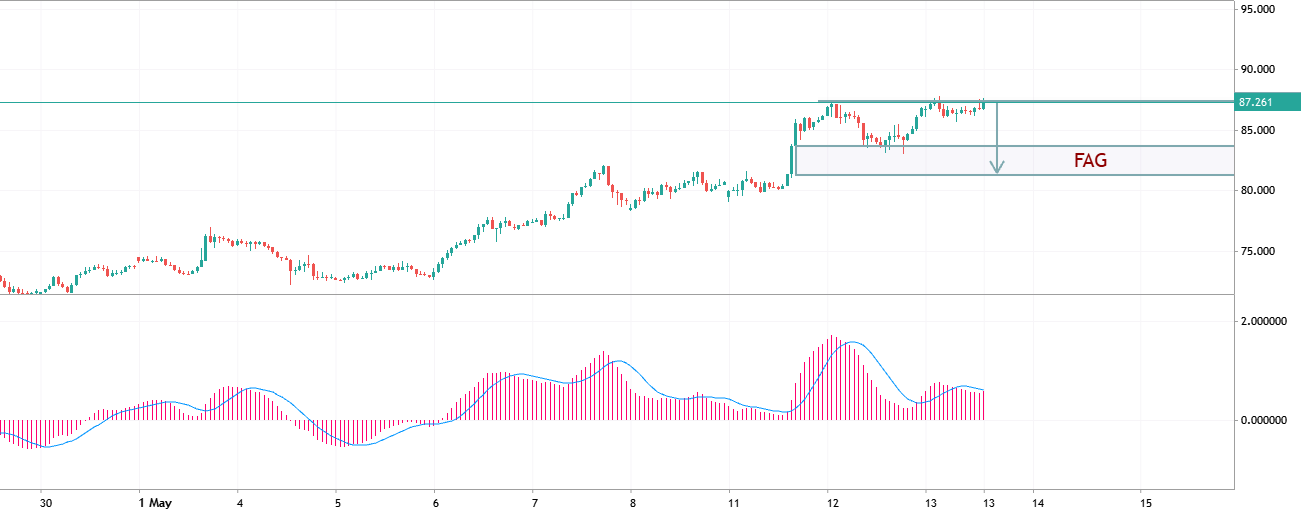
🥈 XAGUSD is correcting and may fall below the nearest fractal and close below the large imbalance. The MACD confirms the potential for a decline.
We are considering selling XAGUSD if it falls below 87.500; Target: 82.000.
USDCAD TRADE IDEA
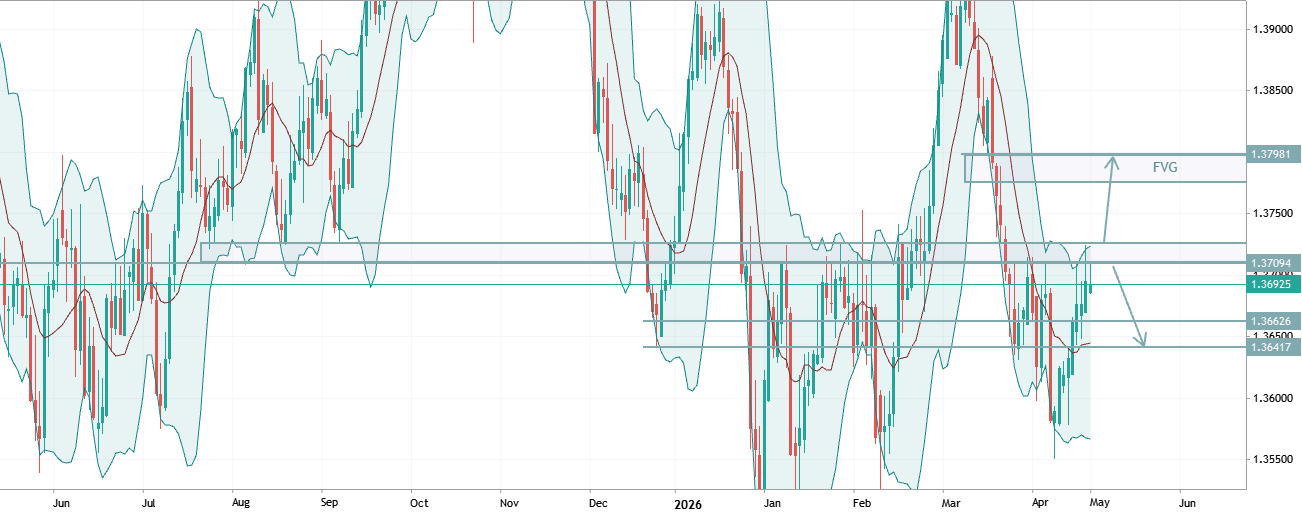
USDCAD is approaching a very strong level from which there have already been five rebounds. The price is testing the upper Bollinger Band, but there is an imbalance at the top.
A break above the 1.3710 resistance level will open the way to 1.3775; A pullback will drop USDCAD to 1.3660 and further to 1.3640.