
ArmanFx Trader
Technical Analyst at Search me on Telegram Gold master club
Pakistan
Sharing market insights and technical analysis.
Focused on XAUUSD price action and smart money concepts.
Grafikler ve Fikirler
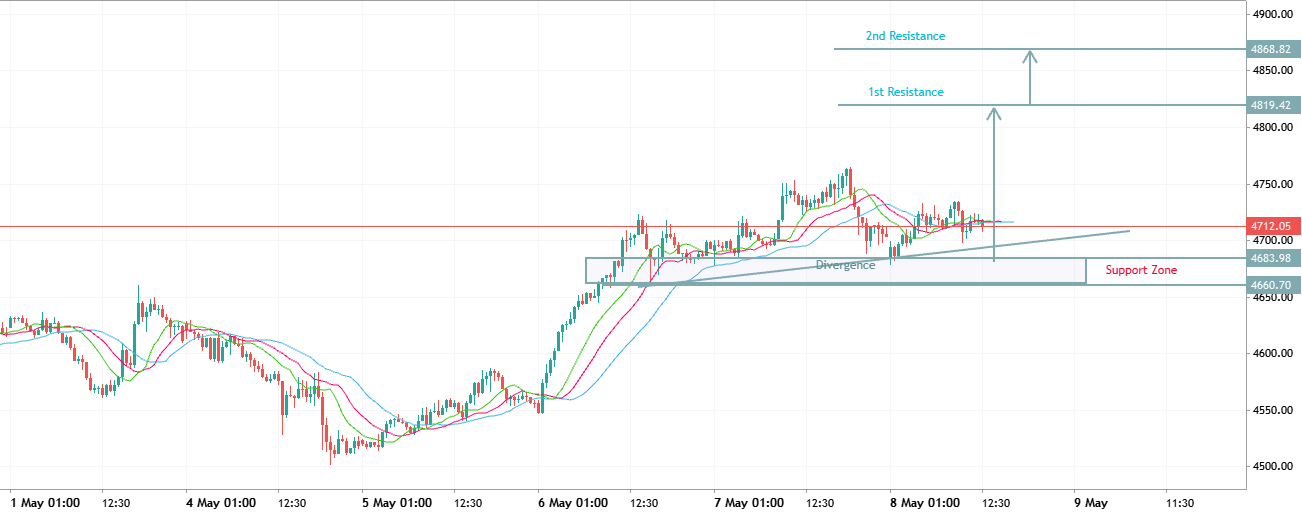
XAUUSD BUY SETUP
📈 Gold is consolidating above the rising trendline after a strong bullish impulse. ⚡ Price continues respecting the support zone around 4683–4660, showing buyer strength.
✅ Hidden bullish divergence is visible; ✅ Moving averages remain positively aligned, supporting continuation upside.
🟢 We are considering BUY positions ONLY if XAUUSD holds above 4683 support.
🎯 Target 1: 4819 🎯 Target 2: 4868
❌ Invalidation: Strong breakdown below 4660 support zone.
🔥 As long as the structure remains intact, bulls may push Gold toward higher resistance levels.
2026.05.08 10:01 0 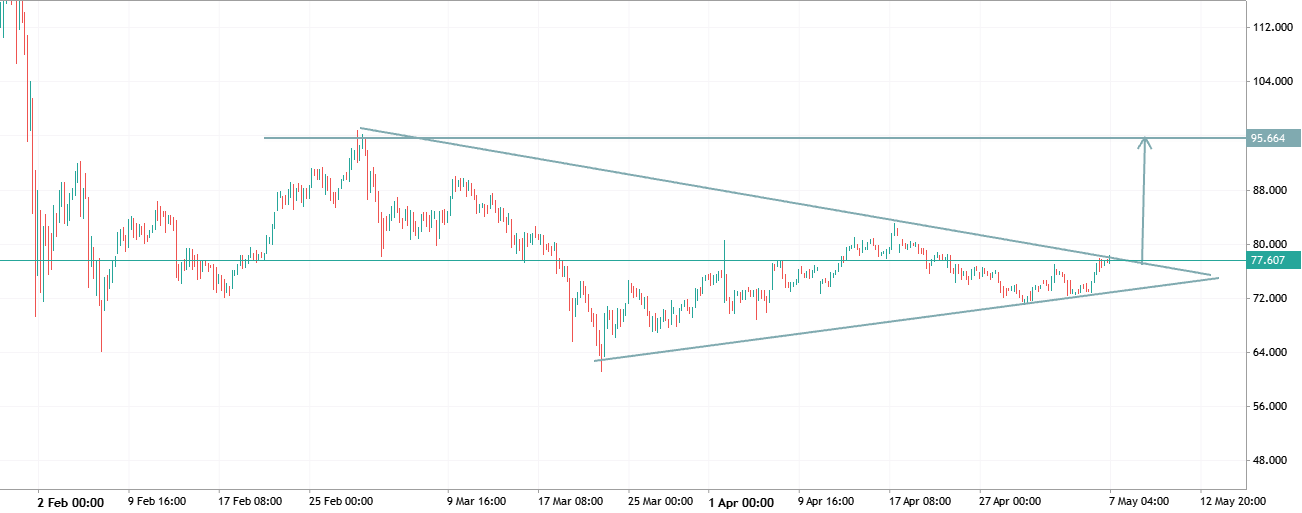
🥈📈 XAGUSD BULLISH BREAKOUT SETUP 👈
🥈📈 XAGUSD BULLISH BREAKOUT SETUP 👈
🥈 Silver is consolidating inside a symmetrical triangle and price is now approaching the apex near 77.65. The structure remains bullish with higher lows, while bearish pressure continues to weaken below the descending trendline.
📈 We are considering buying XAGUSD ONLY if price breaks and holds above 78.00; 🎯 Target 1: 80.00 🎯 Target 2: 88.00 🎯 Target 3: 95.60
⚠️ Invalidation: A rejection from the breakout zone and drop below 72.00 would invalidate the bullish scenario.
2026.05.07 04:30 0 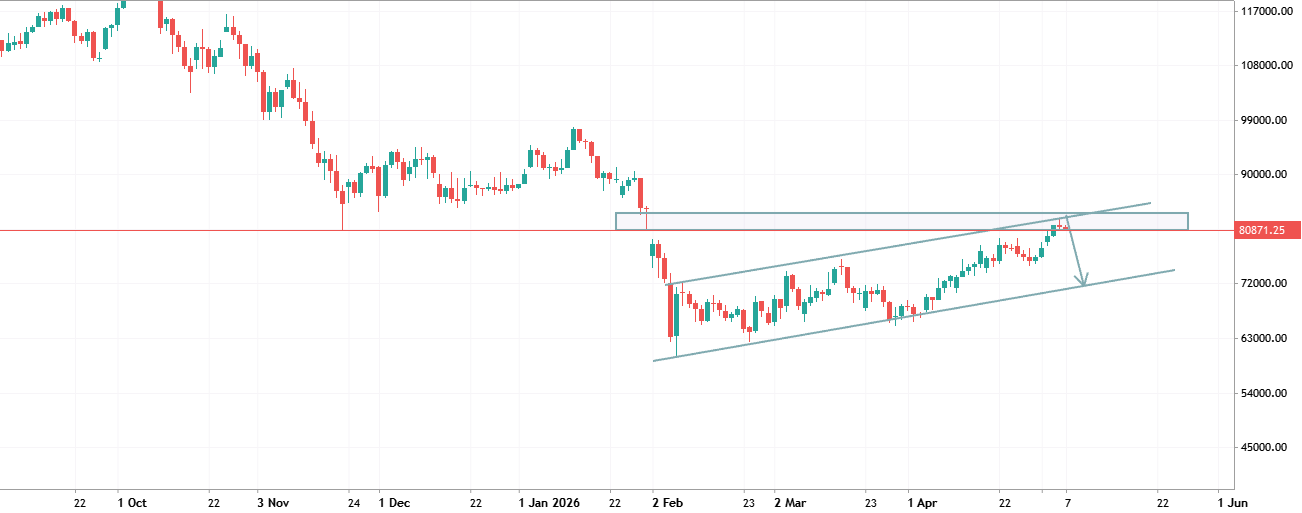
BTCUSD SELL SETUP!
BTCUSD SELL SETUP!
Bitcoin has reached a major resistance zone around 80,800 while trading inside a rising channel. Price is also testing the upper trendline, increasing the probability of a bearish rejection.
The current structure suggests weakening bullish momentum near resistance.
We are considering selling BTCUSD ONLY if price gets rejected below the highlighted resistance zone; Target 1: 76,000 Target 2: 72,500 Target 3: 69,000
Invalidation: A strong breakout and daily close above 83,000 could continue the bullish move higher.
2026.05.07 04:18 0 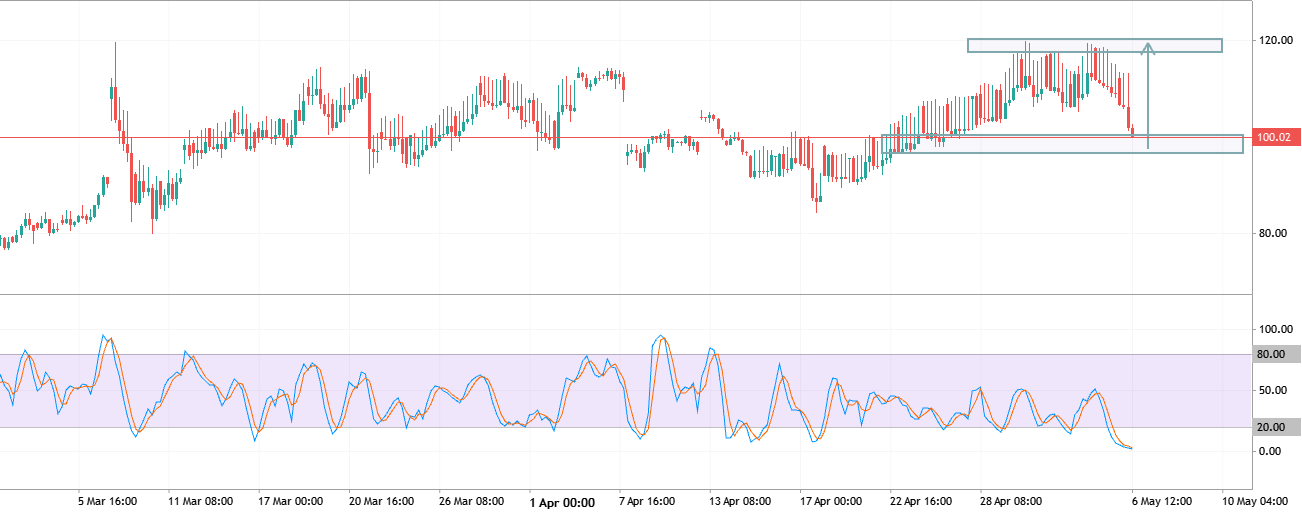
USOIL ALERT!
USOIL ALERT!
🛢️ Oil is currently reacting from a strong support zone near 96–100 after a sharp liquidity sweep from the highs.
📈 Price is still holding the bullish structure, and this pullback could become a buying opportunity if buyers defend the support area.
⚡️ We are considering buying USOIL ONLY if price holds above 100; 🎯 Target 1: 108; 🎯 Target 2: 118.
❌ Invalidation: Break below 96 support.
Click ❤️ if you are bullish 🔥
2026.05.06 10:00 0 
XAUUSD ALERT!
XAUUSD ALERT!
Gold has broken below the downtrend line, triggering a market structure shift. The Alligator’s lips have crossed the jaw, confirming the reversal.
We are considering buying XAUUSD ONLY if it consolidates above 4700; Target 1: 4770; Target 2: 4830.
Click❤️🔥 if you are bullish
2026.05.06 09:47 0 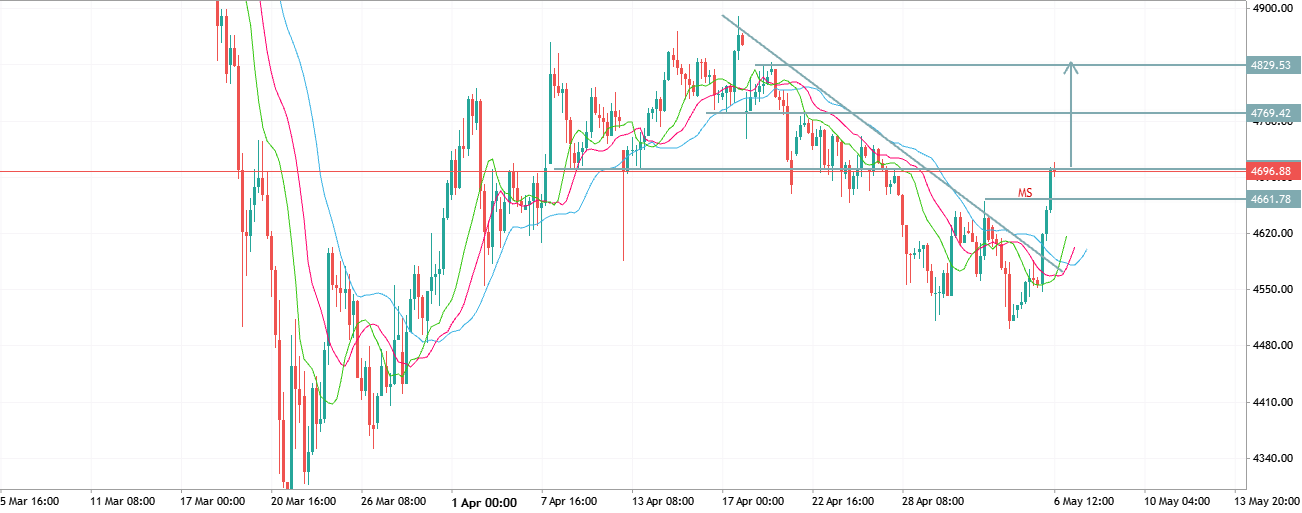
XAUUSD ALERT!
XAUUSD ALERT!
Gold has broken below the downtrend line, triggering a market structure shift. The Alligator’s lips have crossed the jaw, confirming the reversal.
We are considering buying XAUUSD ONLY if it consolidates above 4700; Target 1: 4770; Target 2: 4830.
Click❤️🔥 if you are bullish
2026.05.06 09:47 0 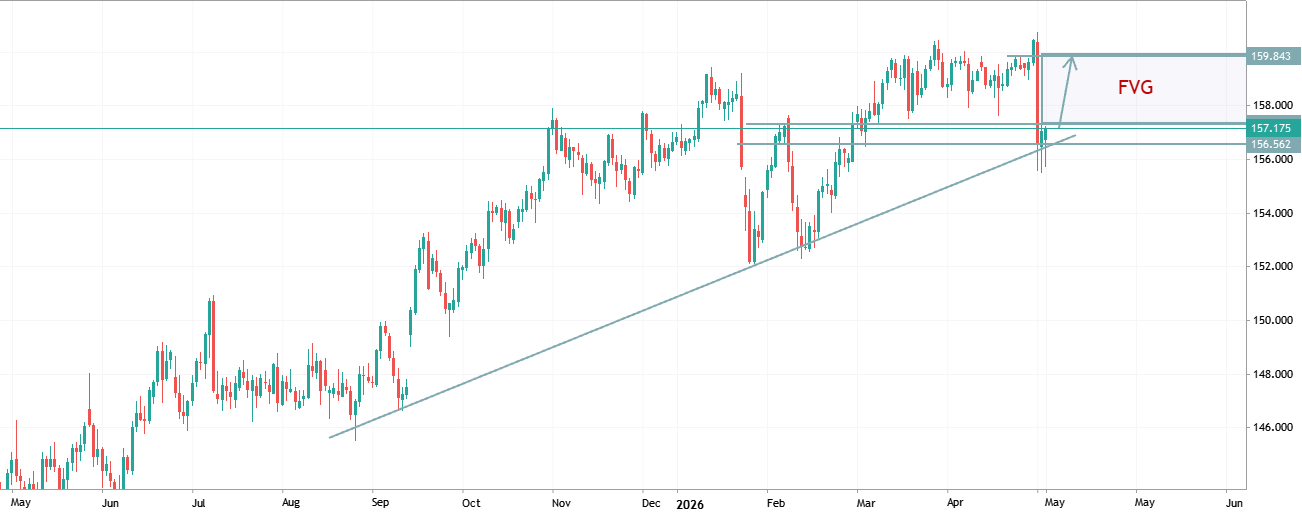
USDJPY bounced off the uptrend line
USDJPY bounced off the uptrend line after breaking below the lower Bollinger Band. There is an imbalance at the top acting as a magnet for the price.
If USDJPY rises above 157.300, we are considering a buy; Target: 159.700.
2026.05.04 12:00 1 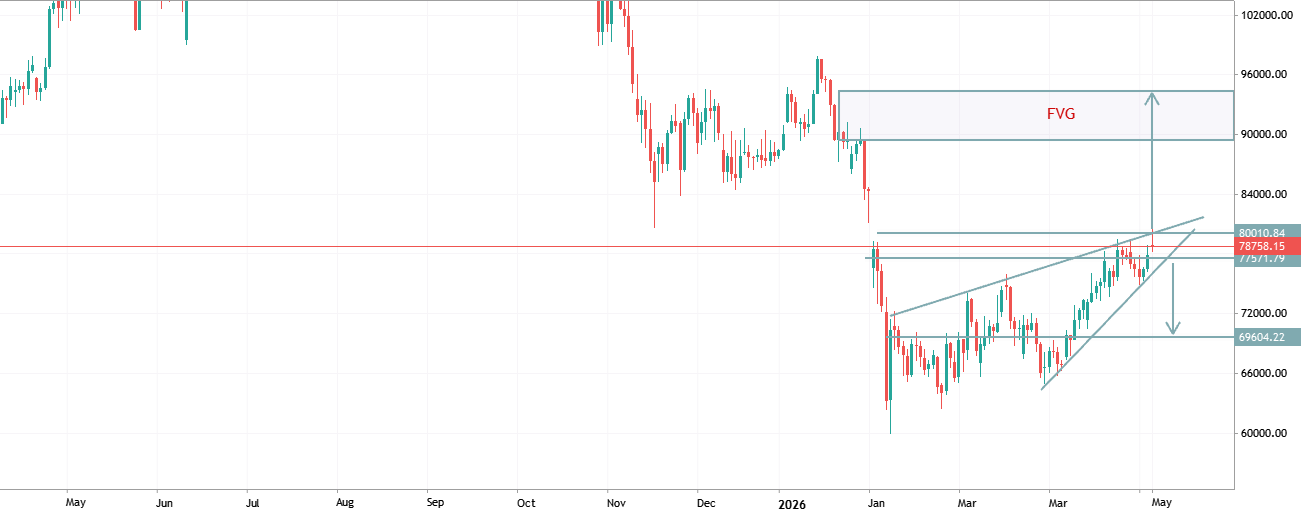
Bitcoin is testing extremely strong resistance
Bitcoin is testing extremely strong resistance and the upper boundary of the ascending wedge after breaking above the upper Bollinger Band. However, the trend has already been broken, and there is an FVG at the top.
Consolidation above 80,000 will open the way to 84,000 and 88,000; A break below the lower trend line at 77,500 will send BTCUSD down to 71,000.
2026.05.04 11:53 0 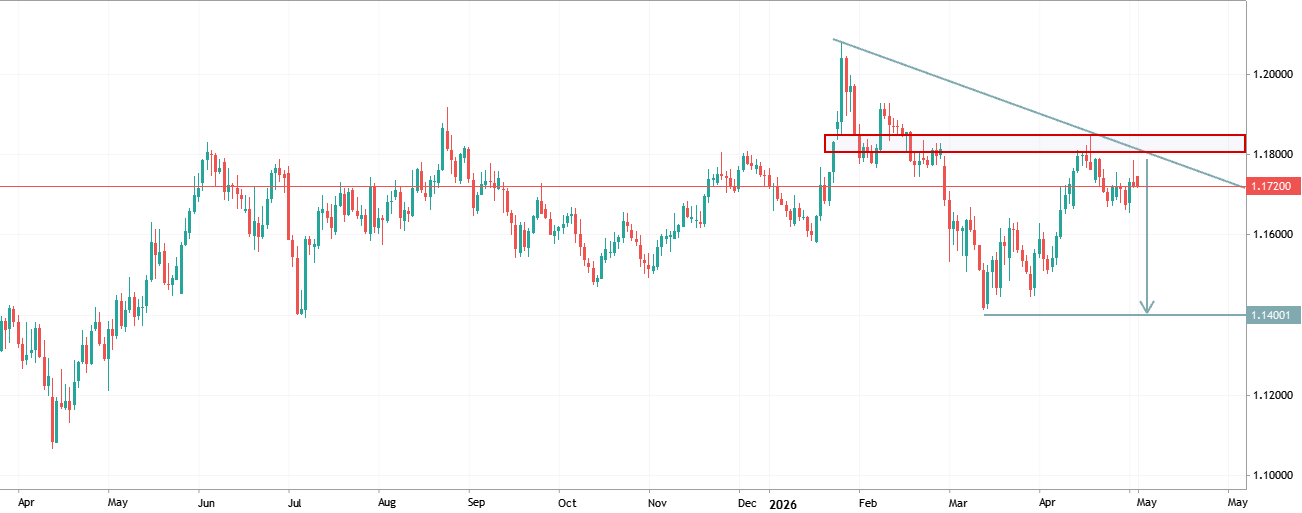
EUR/USD – Bearish Structure Under Resistance
EUR/USD – Bearish Structure Under Resistance
Trend: Lower highs forming → descending trendline intact (bearish pressure)
Key Zone: 1.1780 – 1.1820 (strong resistance + rejection area)
Confirmation: Price failing to break above zone + respecting trendline
Sell Trigger: Break below 1.1700 support (clean bearish momentum)
Targets: 1.1550 1.1400 (major support)
❌ Invalidation: Sustained close above 1.1820 (trendline breakout)
— Clean setup: rejection + structure = downside continuation bias.
2026.05.04 08:00 2 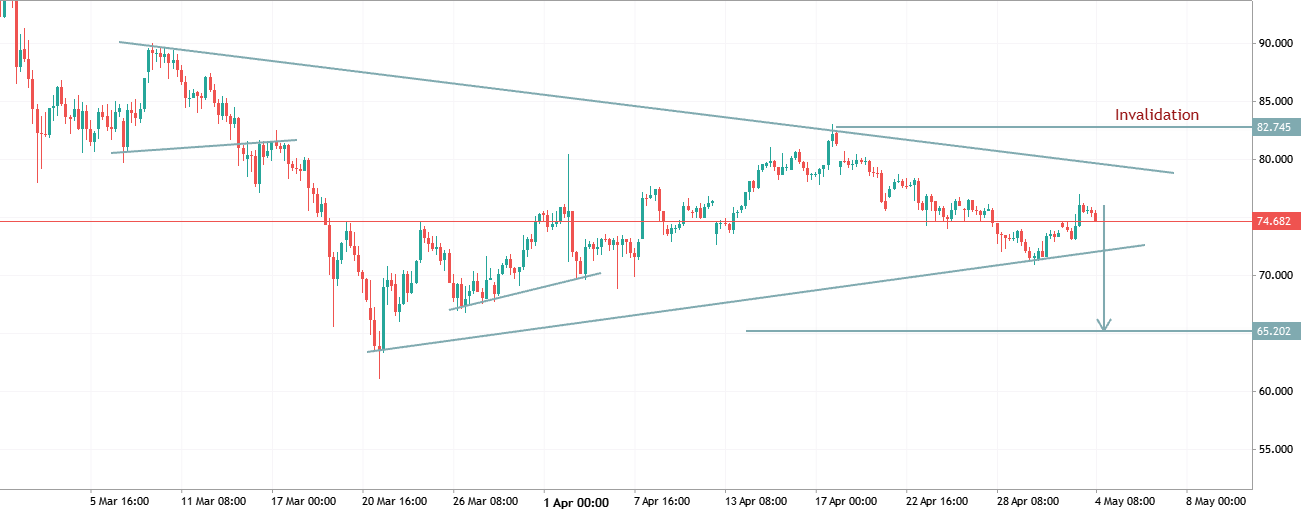
XAGUSD TRADE IDEA
XAGUSD
Silver has been quiet since February. Too quiet.
A wide range. Slow moves. Choppy candles. The market is forming a contracting triangle. Price is squeezing into a smaller and smaller area. Each swing is shorter than the last. The energy is building.
A triangle is like a spring. The longer it presses, the harder it jumps. When silver finally breaks, it will not be slow. It will be fast and loud.
2026.05.04 07:47 0 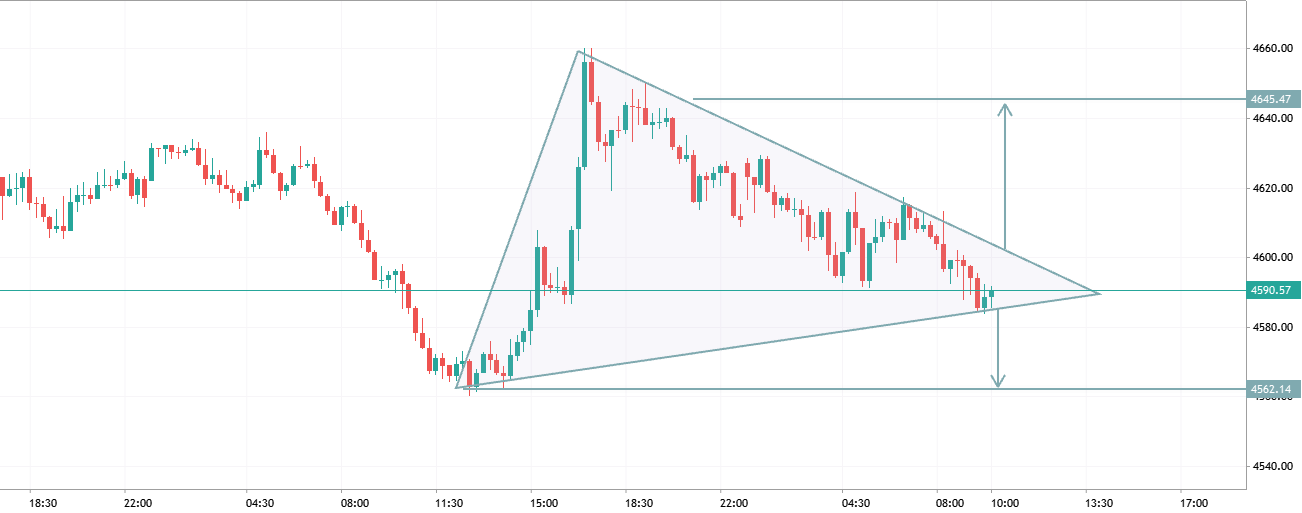
TRIANGLE BREAKOUT SETUP
TRIANGLE BREAKOUT SETUP
Price is compressing inside a symmetrical triangle, showing indecision after a strong bullish impulse. Lower highs + higher lows = breakout loading.
Sell Scenario: Break below 4580 support with momentum Target: 4560
Buy Scenario: Break above trendline resistance (~4615–4620) Target: 4645
Invalidation: No clear breakout = stay out (fake moves likely near apex)
2026.05.04 07:30 0 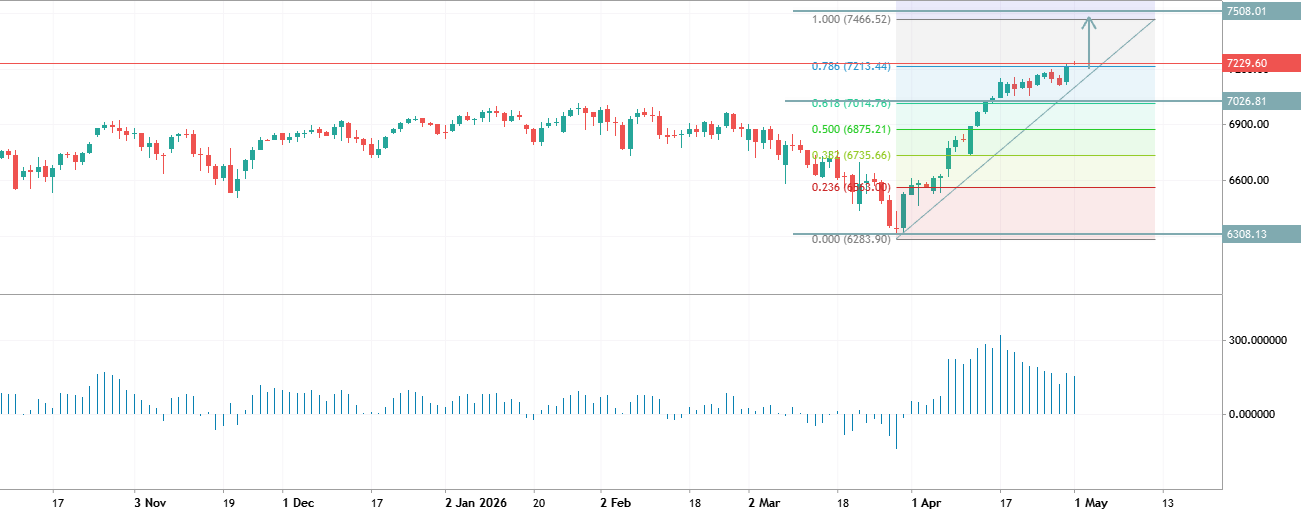
US500 Analysis
US500 Analysis
US500 continues to print new all-time highs, maintaining a strong bullish structure with sustained upward momentum.
Price is approaching the 161.8 Fibonacci expansion, indicating further upside potential supported by strong market sentiment.
We are considering buying US500 above 7250; Target: 7500
A drop below recent breakout support would weaken the bullish outlook.
2026.05.01 11:02 0