Force Index - traditional general approach AAPL Apple Inc. - Common Stock
Force Index - traditional general approach
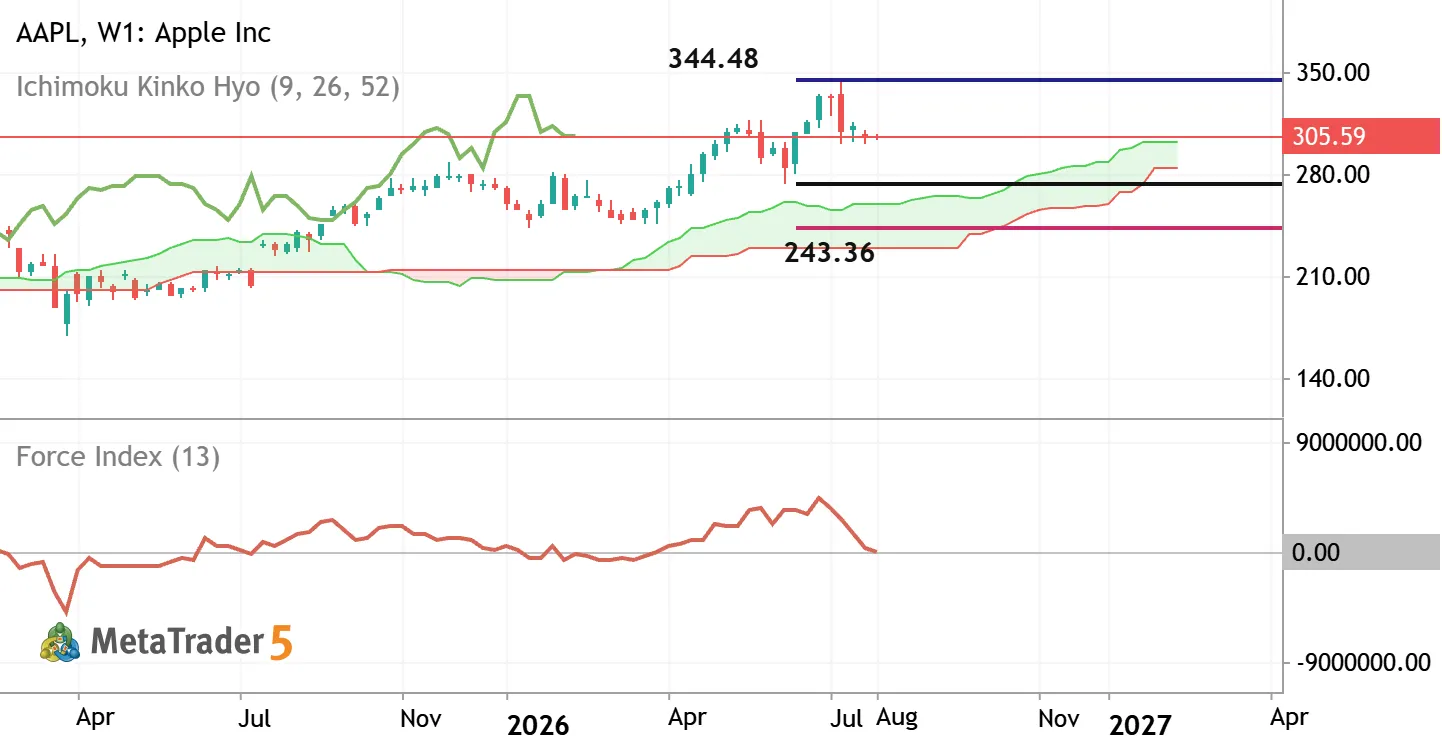
Force Index indicator was developed by Alexander Elder. It is a volume and momentum oscillator designed to measure the strength of buyers (bulls) during rallies and sellers (bears) during market declines. Force Index value above zero indicates dominant buying pressure. Negative value of Force Index (below zero) suggests strong selling pressure. Alternatively, if the price is on low volume so it is indicating the flat or the ranging market condition for the price to be moved within narrow support/resistance channel for example. The traders are traditionally using this indicator with two parameters: short-term approach (2 periods) - it is used to identify entry points during pullbacks; medium-term approach (13 periods) as a trend-following tool to indentify the primary trend as the bearish
Accelerator oscillator - traditional general approach PHO Invesco Water Resources ETF
Accelerator oscillator - traditional general approach
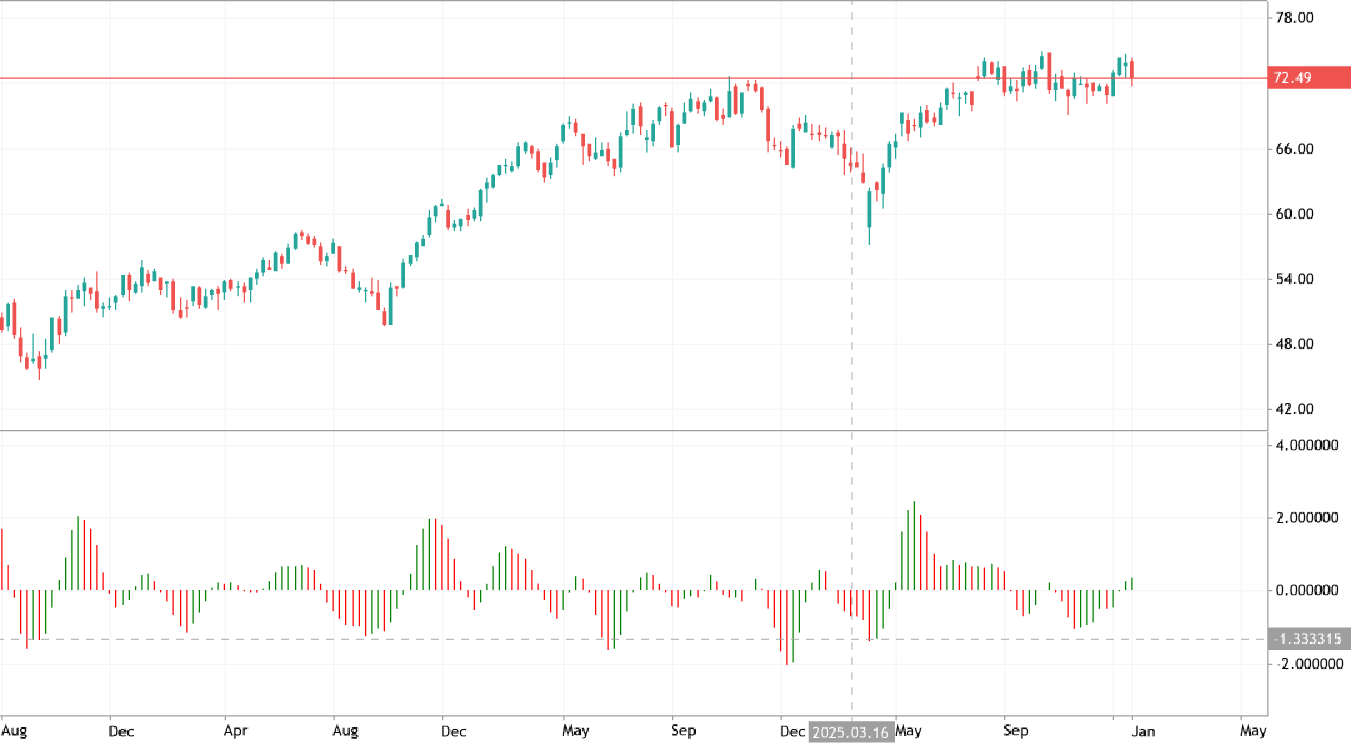
The Accelerator Oscillator measures the difference between the Awesome Oscillator and the 5-period moving average. The indicator reflects the rate at which the Awesome Oscillator changes to be detected the trend reversals. If the Accelerator Oscillator moves above the zero line so it is considered for the signal to be in upward acceleration to be continuing. Alternatively, if it moves below the zero line so the downward acceleration will continue. Besides, the potential price surge is confirmed by two consecutive green bars with the above the centre line. A potential price decline is confirmed by two consecutive red bars which is below the centre line.
Bollinger Bands - traditional general approach EXC Exelon Corporation - Common Stock
Bollinger Bands - traditional general approach
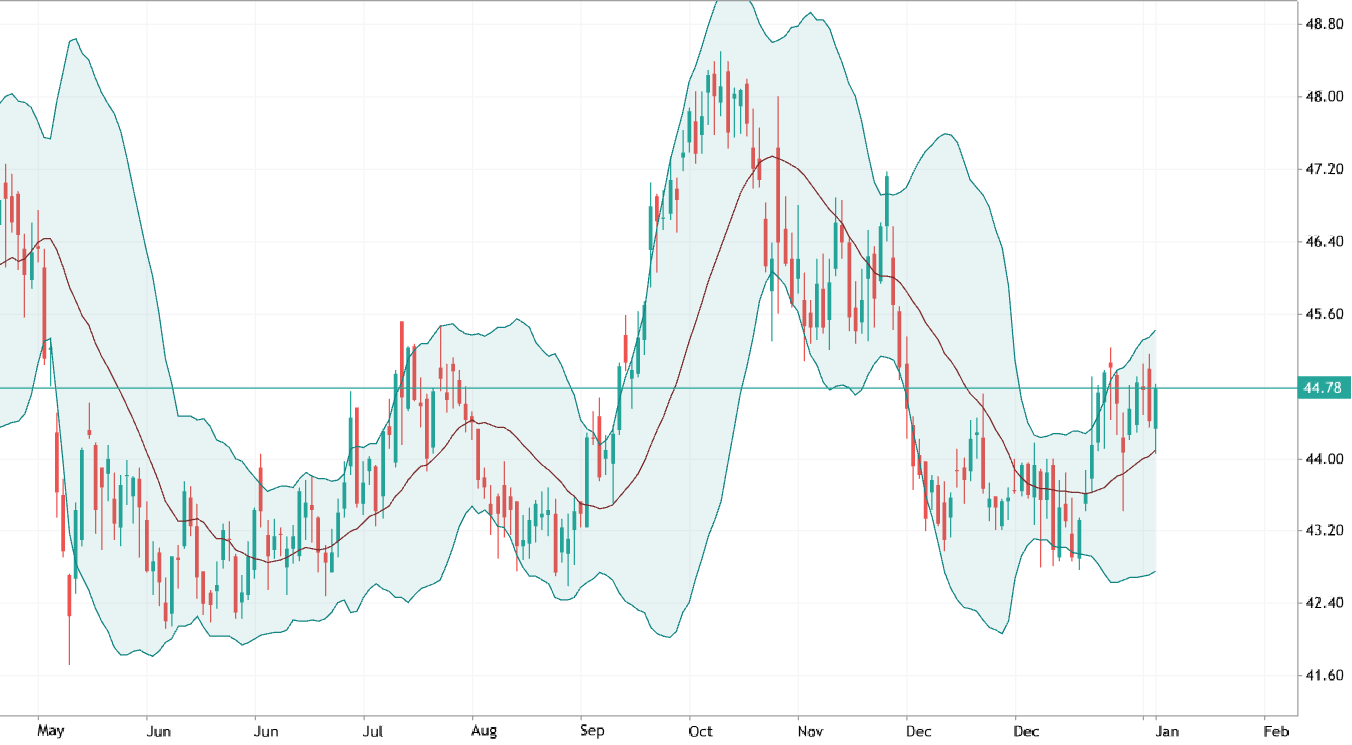
Bollinger bands are very similar to moving averages. The bands are plotted at two standard deviations above or below the moving average. This is typically based off of the simple moving average, but an exponential moving average can be used to increase the sensitivity of the indicator. A 20-day simple moving average is recommended for the center band and 2 standard deviations for the outer bands. Bollinger bands are typically used by traders to detect extreme unsustainable price moves, capture changes in trend, identify support/resistance levels and spot contractions/expansions in volatility. There are a number of ways to interpret Bollinger Bands: when the prices break above or below the upper or lower band, it is an indication that a breakout/breakdown is occurring. Alternatively, some traders use Bollinger Bands as an overbought and oversold indicator.
Trend following: Moving Averages indicator to open the positions on the direction of the primary trend AMZN Amazon.com, Inc. - Common Stock
Trend following: Moving Averages indicator to open the positions on the direction of the primary trend
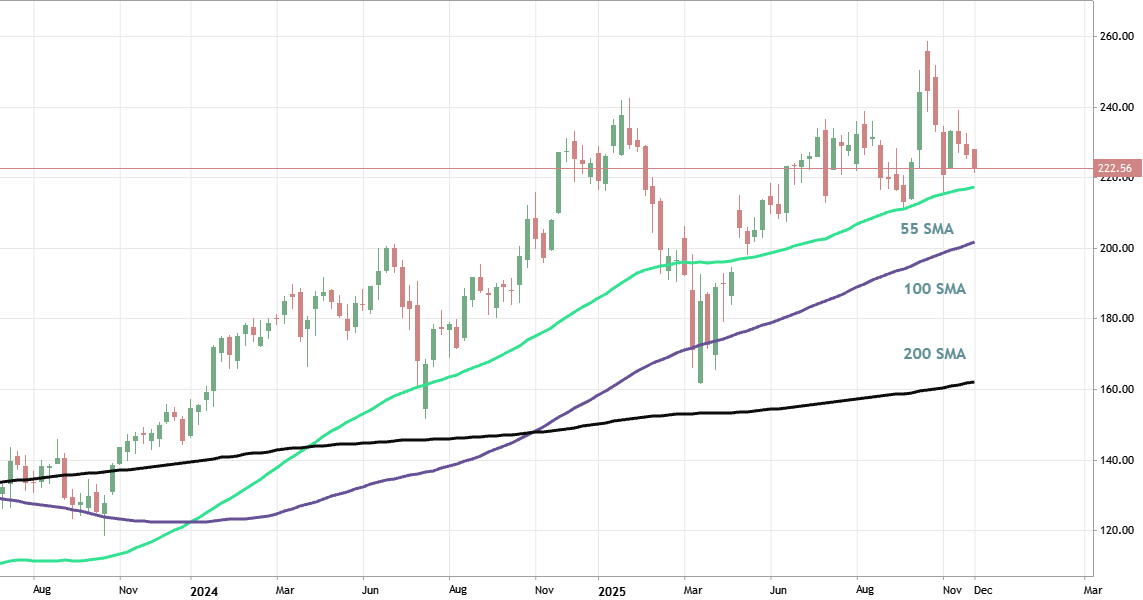
Moving averages indicator is commonly used for estimation of the primary trend as well as the secondary correction and bear market rally for example. Traders choose the moving average period depending on the type of trading they do: short-term, medium-term or long-term. Short-term: 10 -55 period Moving Average (11 and 55 are usually used on lower timeframe). Medium-term: 55 - 100 period Moving Average (or the combination of 55 SMA together with 100 SMA). Long-term: 100 - 200 period Moving Average (or the combilation of 100 MA together with 200 MA). This indicator is providing the good view related to the market condition with all the aspects of the situation together with the possible entry points by using the well-known combinations of 2 or 3 indicators on one chart for example.