
Ethereum is struggling below $1,700 as apathy and uncertainty keep the market in a directionless state that has frustrated participants on both sides of the trade. The price is neither recovering convincingly nor breaking down aggressively — and CryptoOnchain has identified a development in the network activity data that cuts directly against the narrative that the current weakness reflects a market in structural decline.
A notable divergence has emerged in Ethereum’s on-chain transaction patterns over the past week. Daily transactions from regular user wallets have dropped approximately 43% — a decline that, read in isolation, would suggest a network losing engagement and relevance during a difficult market period. That surface reading is where the analysis begins rather than ends.
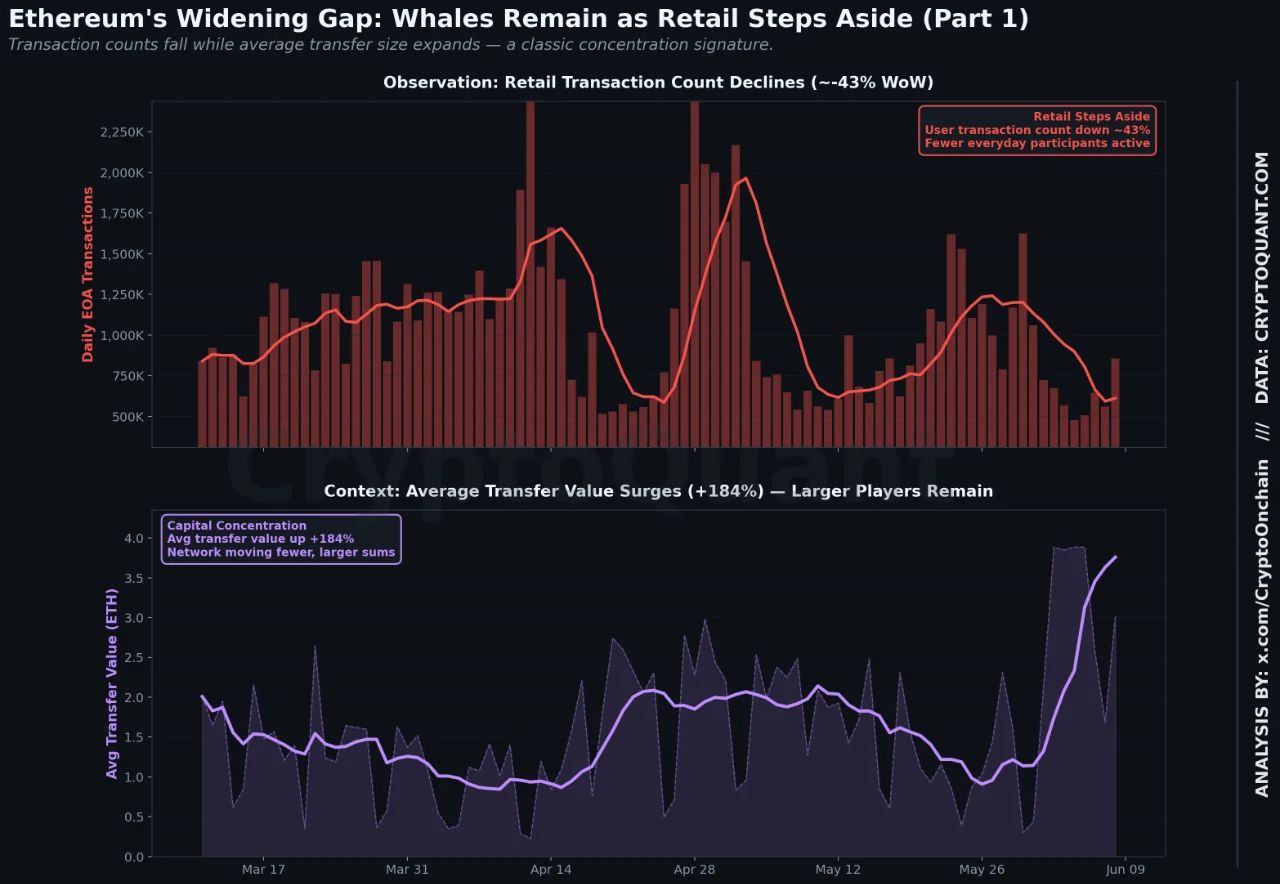
Against that transaction count decline, the average value moved per transaction has surged over 184%, with the median transfer size rising even more sharply. Ethereum is processing fewer transactions — but the transactions it is processing are dramatically larger than the ones that preceded them.
The pattern that produces that specific combination is recognizable to anyone who has studied on-chain behavior during previous market stress periods. Smaller routine participants step aside, reduce activity, and wait for clarity. Larger holders continue operating — moving capital in fewer but more significant transactions that reflect deliberate positioning rather than routine network usage.
CryptoOnchain’s analysis argues that the divergence between declining transaction counts and surging transfer values is not the signature of a fading network. It is the signature of capital consolidating into fewer and more significant hands at current price levels.
The Setup Is Consolidating
The CryptoOnchain analysis connects the transaction divergence to the broader flow data that confirms the same behavioral pattern from multiple independent angles. Total ETH netflows remain deeply negative at approximately -79,080 ETH — large volumes continuing to leave exchanges consistently rather than building up on platforms where they would be available for immediate sale. The spot supply contraction is real and ongoing.
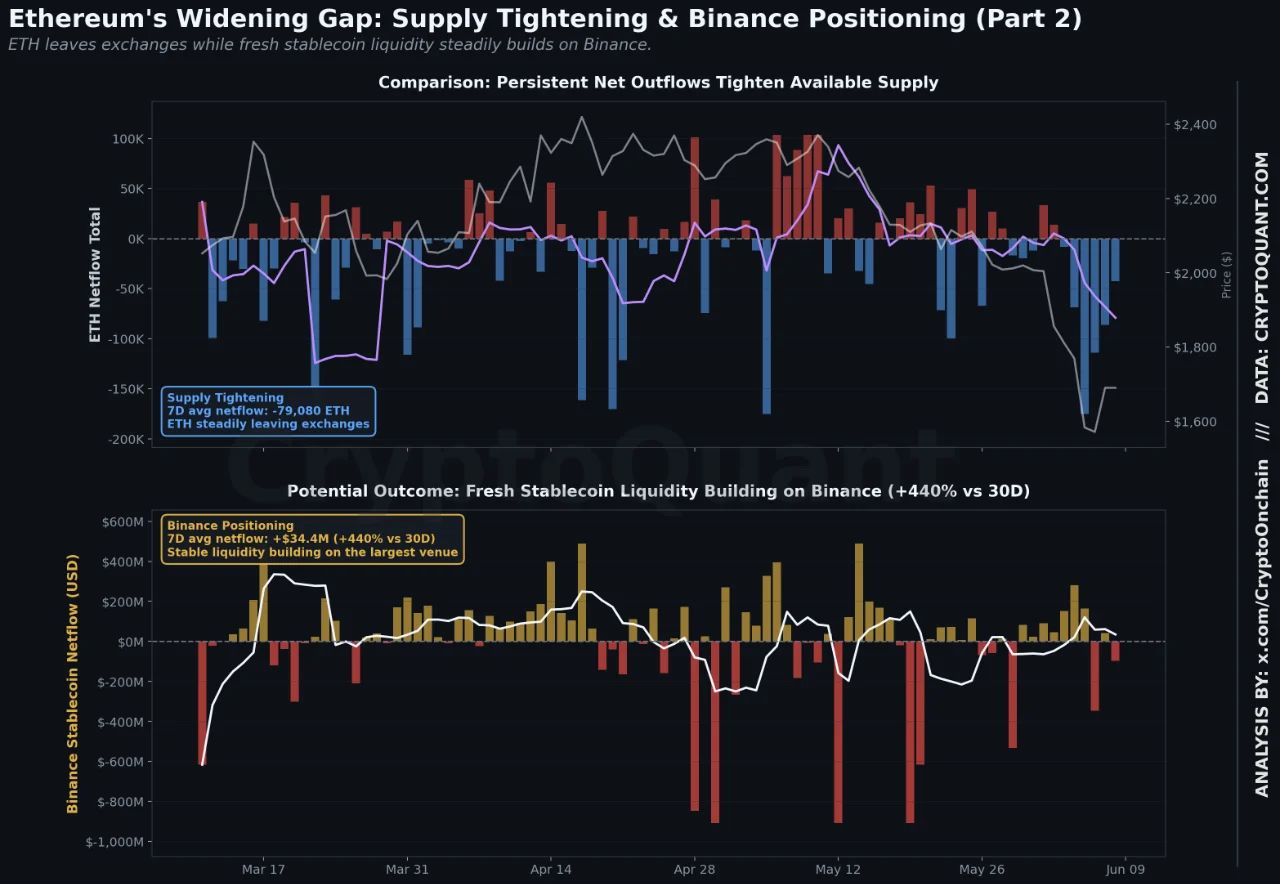
Simultaneously, fresh capital is positioning on Binance through the stablecoin channel. Stablecoin netflows into Binance have turned strongly positive at +$34.4 million — a 440% increase versus the 30-day average. Buying power is arriving on the exchange at the same time spot ETH is leaving it. Open Interest on Binance has expanded approximately 9% over the quarter, confirming that larger participants are quietly building derivatives exposure alongside the stablecoin inflows.
The combination the analysis identifies is specific and historically recognizable. Retail participation thinning while larger entities withdraw spot ETH and simultaneously park stablecoin liquidity on major exchanges describes a market structure where available float is tightening from the supply side while potential demand is accumulating on the buy side.
The honest framing of the report preserves matters. This combination does not guarantee a reversal — structural setups require catalysts to activate them. What it does describe is the specific pre-condition that has historically preceded more pronounced market moves once demand returns — a tightening float meeting concentrated buying power in an environment where the participants who remained active during the apathy phase are positioned to benefit disproportionately when sentiment shifts.
Ethereum Tests New Lows As Market Searches For A Bottom
Ethereum remains firmly under bearish control on the daily timeframe, with price trading near $1,630 after suffering a sharp breakdown from the multi-month consolidation that dominated trading between February and May. The most significant technical development on the chart is the decisive loss of the $1,800–$1,900 support zone, an area that repeatedly acted as demand throughout the first half of the year. Once that floor failed, selling pressure accelerated rapidly and pushed ETH to fresh 2026 lows near $1,500.
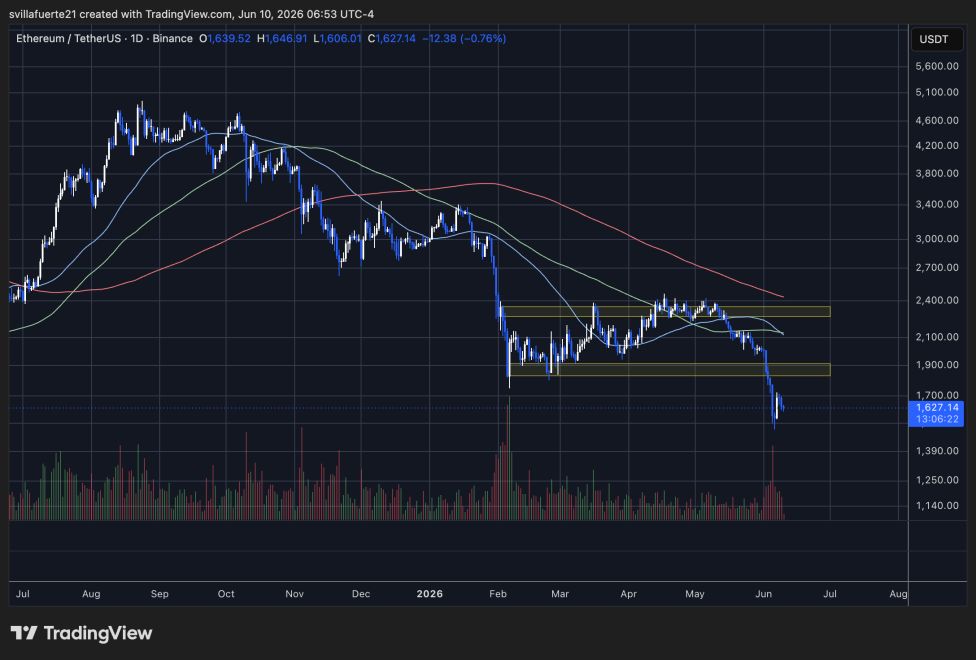
From a market structure perspective, the sequence of highs and lows remains clearly bearish. The April-May recovery peaked near $2,400, creating a lower high relative to previous rallies, before sellers regained control. Since then, Ethereum has produced a series of lower highs and lower lows, culminating in the recent collapse through support. Importantly, the current price is well below the 50-, 100-, and 200-day moving averages, confirming weakness across all major timeframes.
Volume behavior adds another layer to the analysis. The recent selloff generated one of the largest volume spikes seen in months, signaling aggressive participation as ETH broke support. While a short-term bounce emerged from the $1,500 area, buyers have so far failed to reclaim any meaningful resistance.
The immediate battleground is the $1,500–$1,550 region, which now represents the year’s most important support. A sustained hold could allow Ethereum to build a base after a nearly 35% decline from its May highs. However, unless price can reclaim the former support zone around $1,800, rallies are likely to be viewed as corrective moves within a broader downtrend rather than the beginning of a durable recovery.
Featured image from ChatGPT, chart from TradingView.com