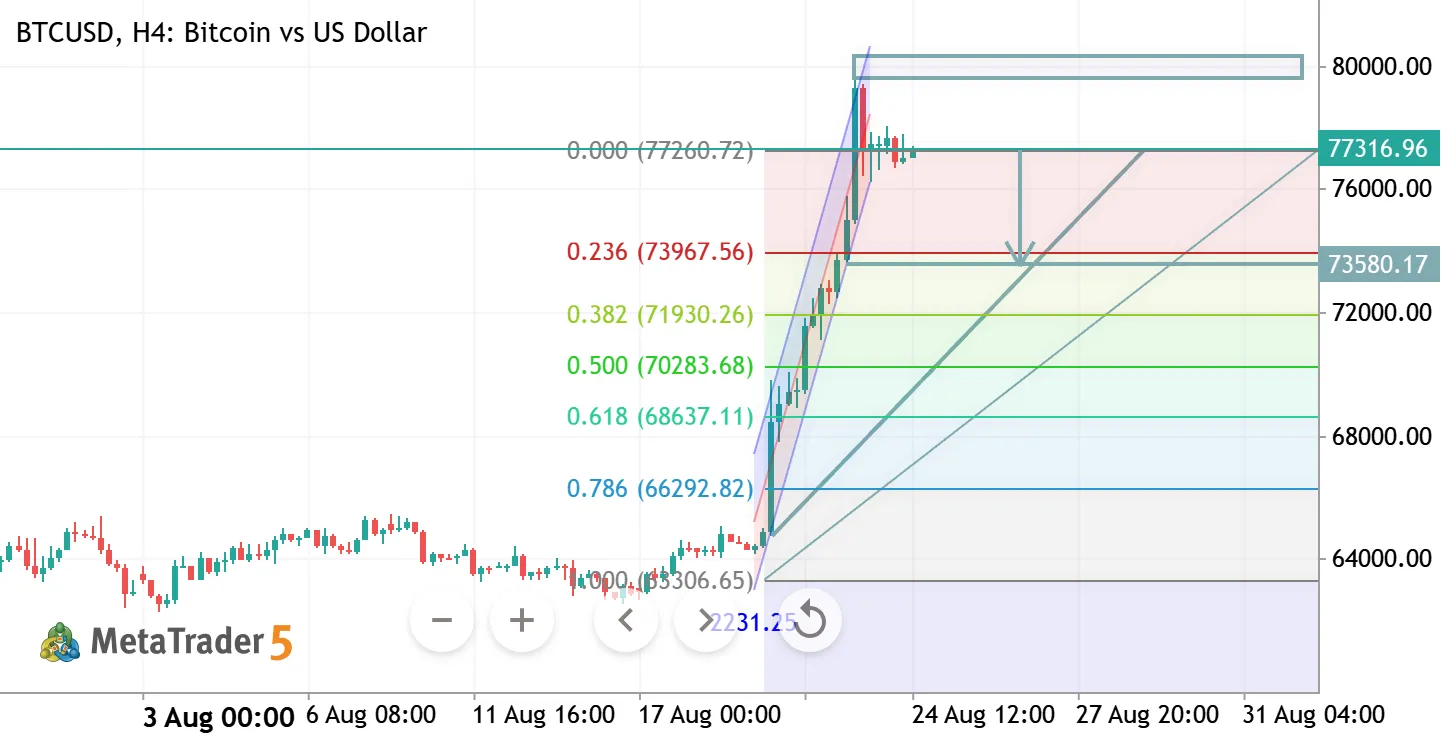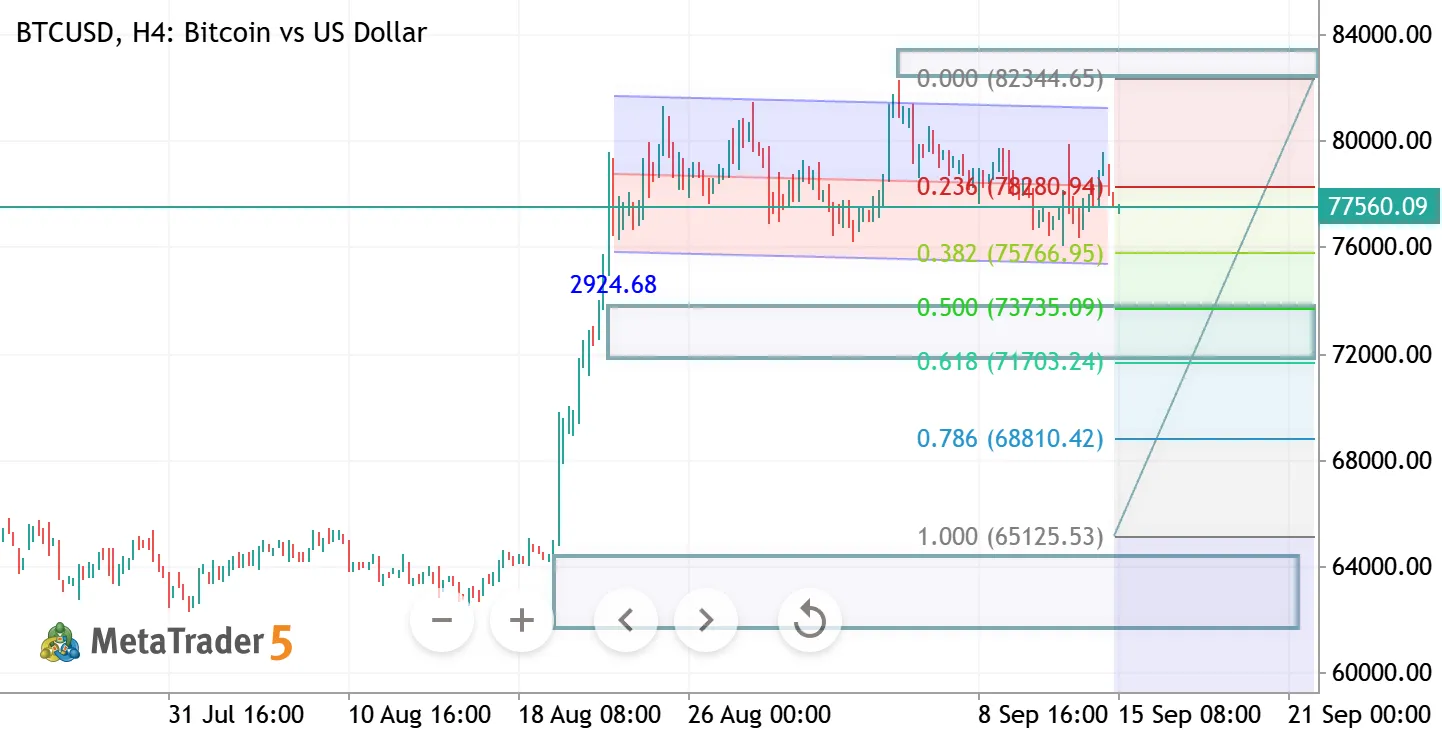
BTCUSD H1 ANALYSIS BTCUSD Bitcoin vs US Dollar
BTCUSD H1 ANALYSIS
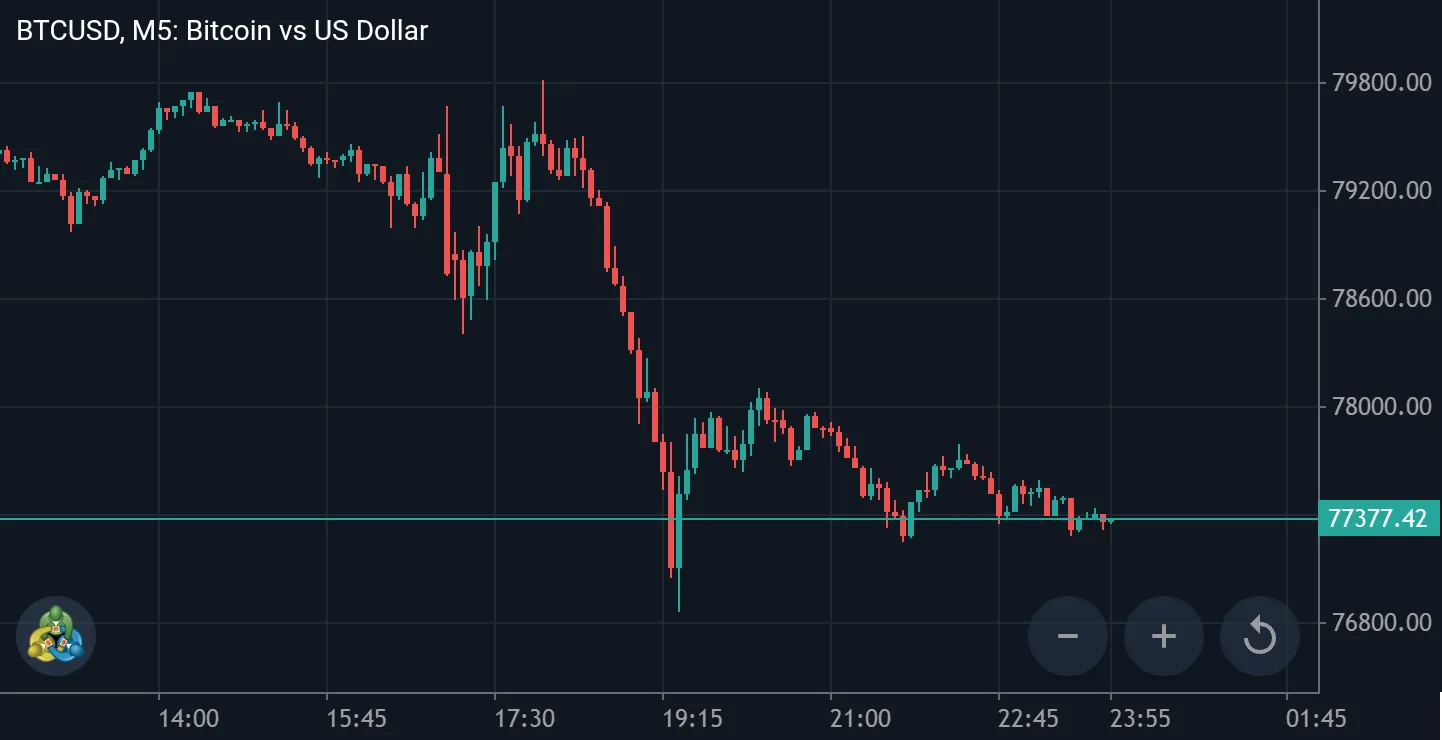
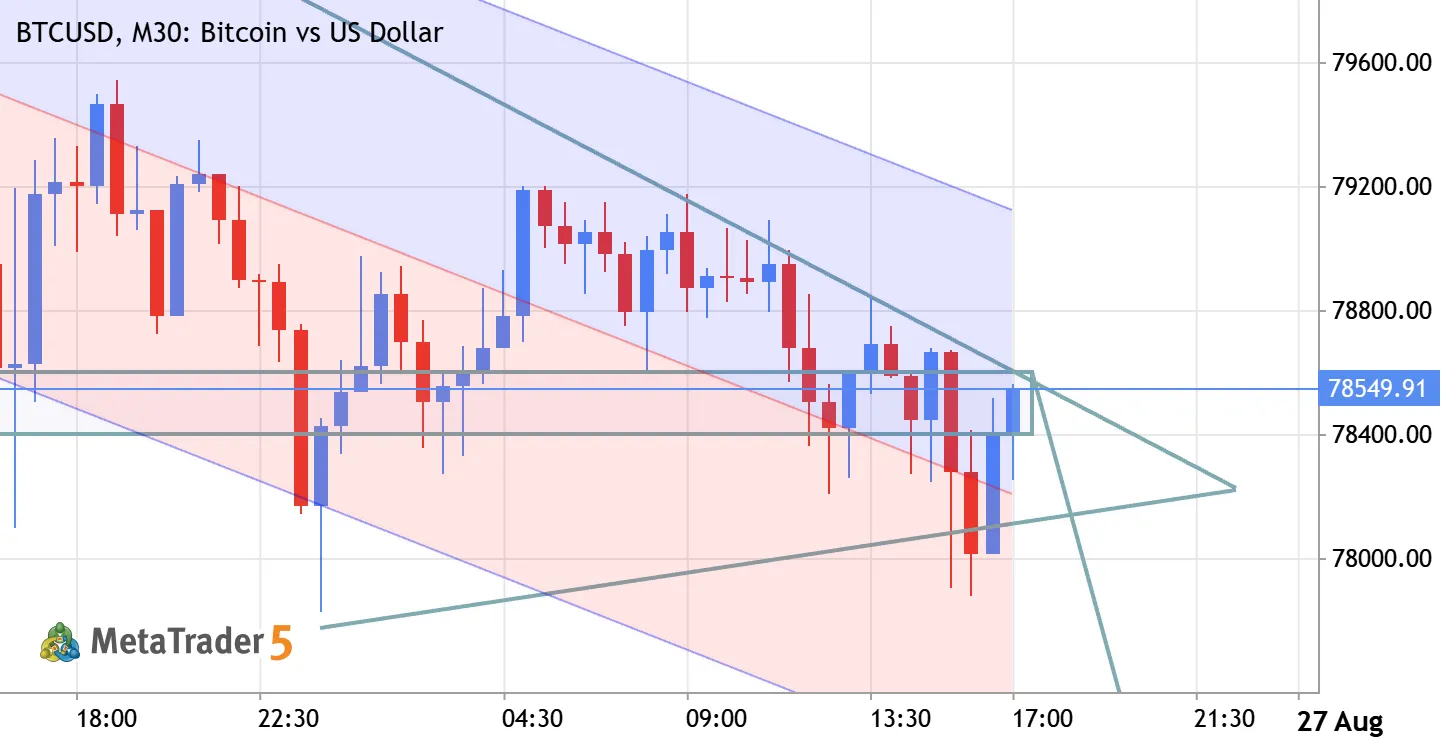
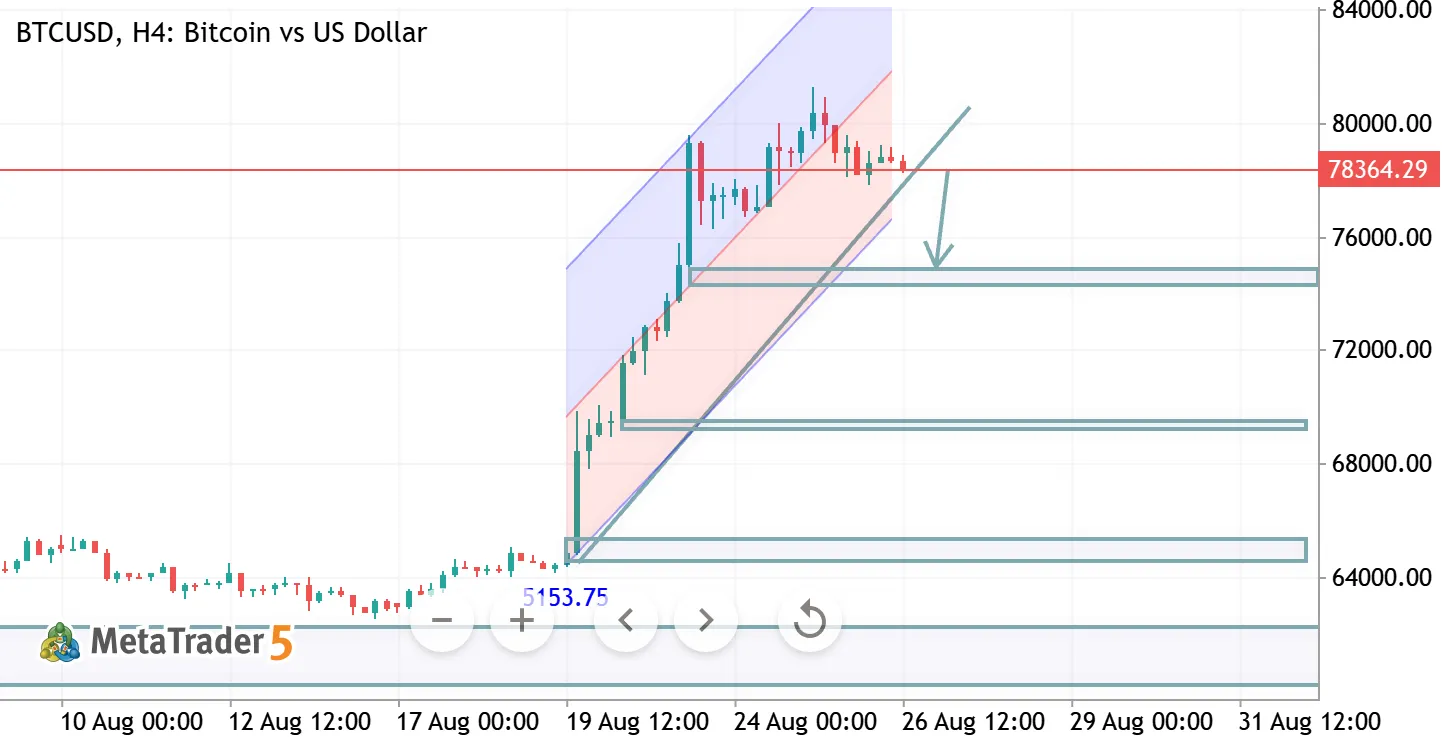
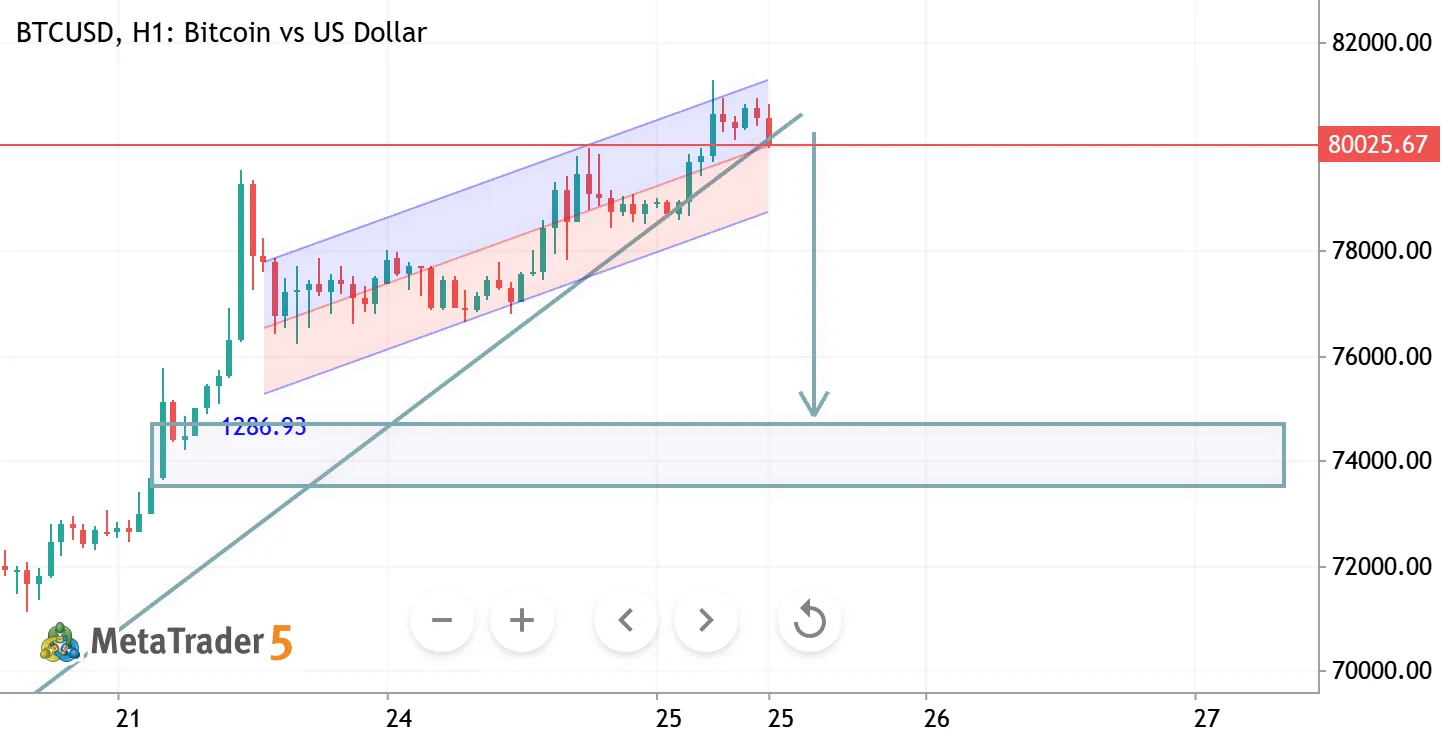
BTCUSD Analysis Price has rejected the upper resistance zone after a strong bullish impulse, signaling short-term weakness. As long as price remains below the recent high, a pullback toward the 59,000–58,500 demand zone is favored. A clean break below support could extend the bearish move, while reclaiming resistance would invalidate this setup. Bias: Bearish 📉 | Key Focus: Resistance rejection → Support retest
0
Goldanalysisteam Abdul Qayoom 2026.07.02 07:05
btcusd h1 analysis BTCUSD Bitcoin vs US Dollar
btcusd h1 analysis
BTCUSD | H1 Analysis Price remains under bearish trendline resistance, keeping sellers in control. A rejection from the resistance zone suggests another move toward lower support if bulls fail to reclaim the trendline. Watch for a breakout above resistance before considering a bullish shift. Bias: Bearish 📉 Key Levels: Resistance: 59,300–59,500 | Support: 58,100–57,800 Trade Safe – Wait for Confirmation.
0
Goldanalysisteam Abdul Qayoom 2026.07.01 08:14
BTCUSD TRADE IDEA BTCUSD Long Bitcoin vs US Dollar
BTCUSD TRADE IDEA
BTCUSD (H1) Trade Analysis – Bullish Bias Market Structure Price is trading inside a descending wedge , a pattern that often precedes a bullish breakout. Buyers have defended the 58,000–58,800 support area several times. Short-term momentum remains weak until the wedge resistance is broken. Buy Setup Entry Zone: 58,500–59,000 (after bullish confirmation) Stop Loss: Below 57,950 Take Profit 1: 60,300–60,600 Take Profit 2: 61,800–62,100 Take Profit 3: 63,500–64,000 (if bullish momentum continues) Alternative Scenario If BTC closes below 57,950 , the bullish setup is invalidated. A breakdown could lead to a move toward 57,000 and potentially 56,000 . Trading Plan Wait for a strong bullish rejection from support or a break and close above the wedge resistance before entering. Avoid buying in
0
HamadJatoi Hamad Jatoi 2026.07.01 05:58
BTCUSD H1 ANALYSIS BTCUSD Bitcoin vs US Dollar
BTCUSD H1 ANALYSIS
BTCUSD H1 Analysis BTC is consolidating within a descending structure while holding above a key Fibonacci support zone. Momentum is building, and a breakout could define the next major move. 📈 Bullish Scenario: A confirmed break above 60,700–61,300 may trigger a rally toward 63,900. 📉 Bearish Scenario: If support around 59,000 fails, expect a continuation toward lower demand levels. Bias: Neutral-to-Bullish. Wait for a confirmed breakout before entering. #BTCUSD #Bitcoin #Crypto #TechnicalAnalysis #MQL5 #PriceAction
0
Goldanalysisteam Abdul Qayoom 2026.06.29 08:16
BTCUSD H1 ANALYSIS BTCUSD Bitcoin vs US Dollar
BTCUSD H1 ANALYSIS
BTCUSD H1 Analysis BTCUSD has reached a key support zone after a sharp bearish move. Price is reacting near the Fibonacci retracement support and showing signs of a potential bullish rebound. A successful hold above the current low could trigger a recovery toward the 61.8%–78.6% Fibonacci resistance area. However, a break below support may extend the downtrend. Bias: Bullish Recovery Above Support Key Resistance: 60,500 – 62,300 Key Support: 58,700 – 59,200 Trade with proper risk management. This analysis is for educational purposes only and not financial advice.
0
Goldanalysisteam Abdul Qayoom 2026.06.24 17:50
BTCUSD H1 ANALYSIS BTCUSD Bitcoin vs US Dollar
BTCUSD H1 ANALYSIS
BTCUSD H1 Analysis Price has broken below the descending trendline and is testing a key support zone around 62.0k–62.2k. A successful rebound from this area could trigger a corrective move toward 63.0k–64.0k resistance. However, sustained weakness below support may keep bearish pressure intact. Bias: Neutral to Bullish (if support holds) Key Support: 62,000 Key Resistance: 63,000 – 64,000 Trade with proper risk management and wait for confirmation before entry.
0
Goldanalysisteam Abdul Qayoom 2026.06.23 08:36
BTCUSD H4 ANALYSIS BTCUSD Bitcoin vs US Dollar
BTCUSD H4 ANALYSIS
BTCUSD | H4 Analysis Price has successfully broken out of the consolidation range and is showing strong bullish momentum. The recent retest of support around 64,000 held firmly, confirming buyer strength. 📈 Bullish Scenario: As long as price remains above the breakout zone, the next target is around 69,800 – 70,000. ⚠️ Risk: A sustained move back below 64,000 could invalidate the bullish outlook and trigger a deeper correction. Bias: Bullish 🚀 | Buy the dips while above key support.
3
Goldanalysisteam Abdul Qayoom 2026.06.22 09:53
BTCUSD TRADE IDEA BTCUSD Long Bitcoin vs US Dollar
BTCUSD TRADE IDEA
BTCUSD (H4) – Buy Analysis 📈 Bias: Bullish (Short-Term Recovery) Entry Zone: 63,800 – 64,400 Stop Loss: 61,500 Take Profit Targets: TP1: 66,000 TP2: 67,255 TP3: 70,000 Technical Reasoning: Strong support is holding around 61,633 . Price has formed a higher low after the recent selloff. BTC is attempting to reclaim and hold above the 64,330 resistance zone. A breakout above 64,330 could trigger momentum toward 67,255 . Confirmation Signal: Wait for an H4 candle close above 64,330 . Increased bullish volume would strengthen the setup. Trade Idea: Buy above 64,330 , targeting 67,255 , while keeping risk below 61,500 . A successful breakout could signal a larger recovery move. 📈🚀
0
HamadJatoi Hamad Jatoi 2026.06.22 07:38
BTCUSD H4 ANALYSIS BTCUSD Bitcoin vs US Dollar
BTCUSD H4 ANALYSIS
BTCUSD H4 Analysis Bitcoin has broken out of its short-term bearish structure and is now testing a key resistance zone. The recent bullish momentum suggests buyers remain in control, with potential for a continuation move toward higher liquidity levels if resistance is cleared. 📈 Bias: Bullish 🎯 Targets: 64,000 → 68,000 ⚠️ Key Support: 60,000–61,000 Momentum favors the upside, but a rejection from resistance could trigger a pullback before the next move higher. Manage risk accordingly.
0
Goldanalysisteam Abdul Qayoom 2026.06.12 06:16
BTCUSD H4 ANALYSIS BTCUSD Bitcoin vs US Dollar
BTCUSD H4 ANALYSIS
BTCUSD Technical Outlook BTC is showing signs of a bullish reversal after breaking out of a descending channel. Price has reclaimed short-term structure and is attempting to build momentum from the recent lows. 📈 Bullish Scenario: A sustained move above 64,500 could accelerate buying pressure toward 67,000–72,000. 🔹 Support: 62,000–63,000 🔹 Resistance: 64,500, 67,000, 72,000 Market Bias: Bullish while price remains above the channel breakout zone. Higher lows suggest buyers are regaining control. Disclaimer: This analysis is for educational purposes only and not financial advice. Always use proper risk management before trading.
0
Goldanalysisteam Abdul Qayoom 2026.06.09 09:03