
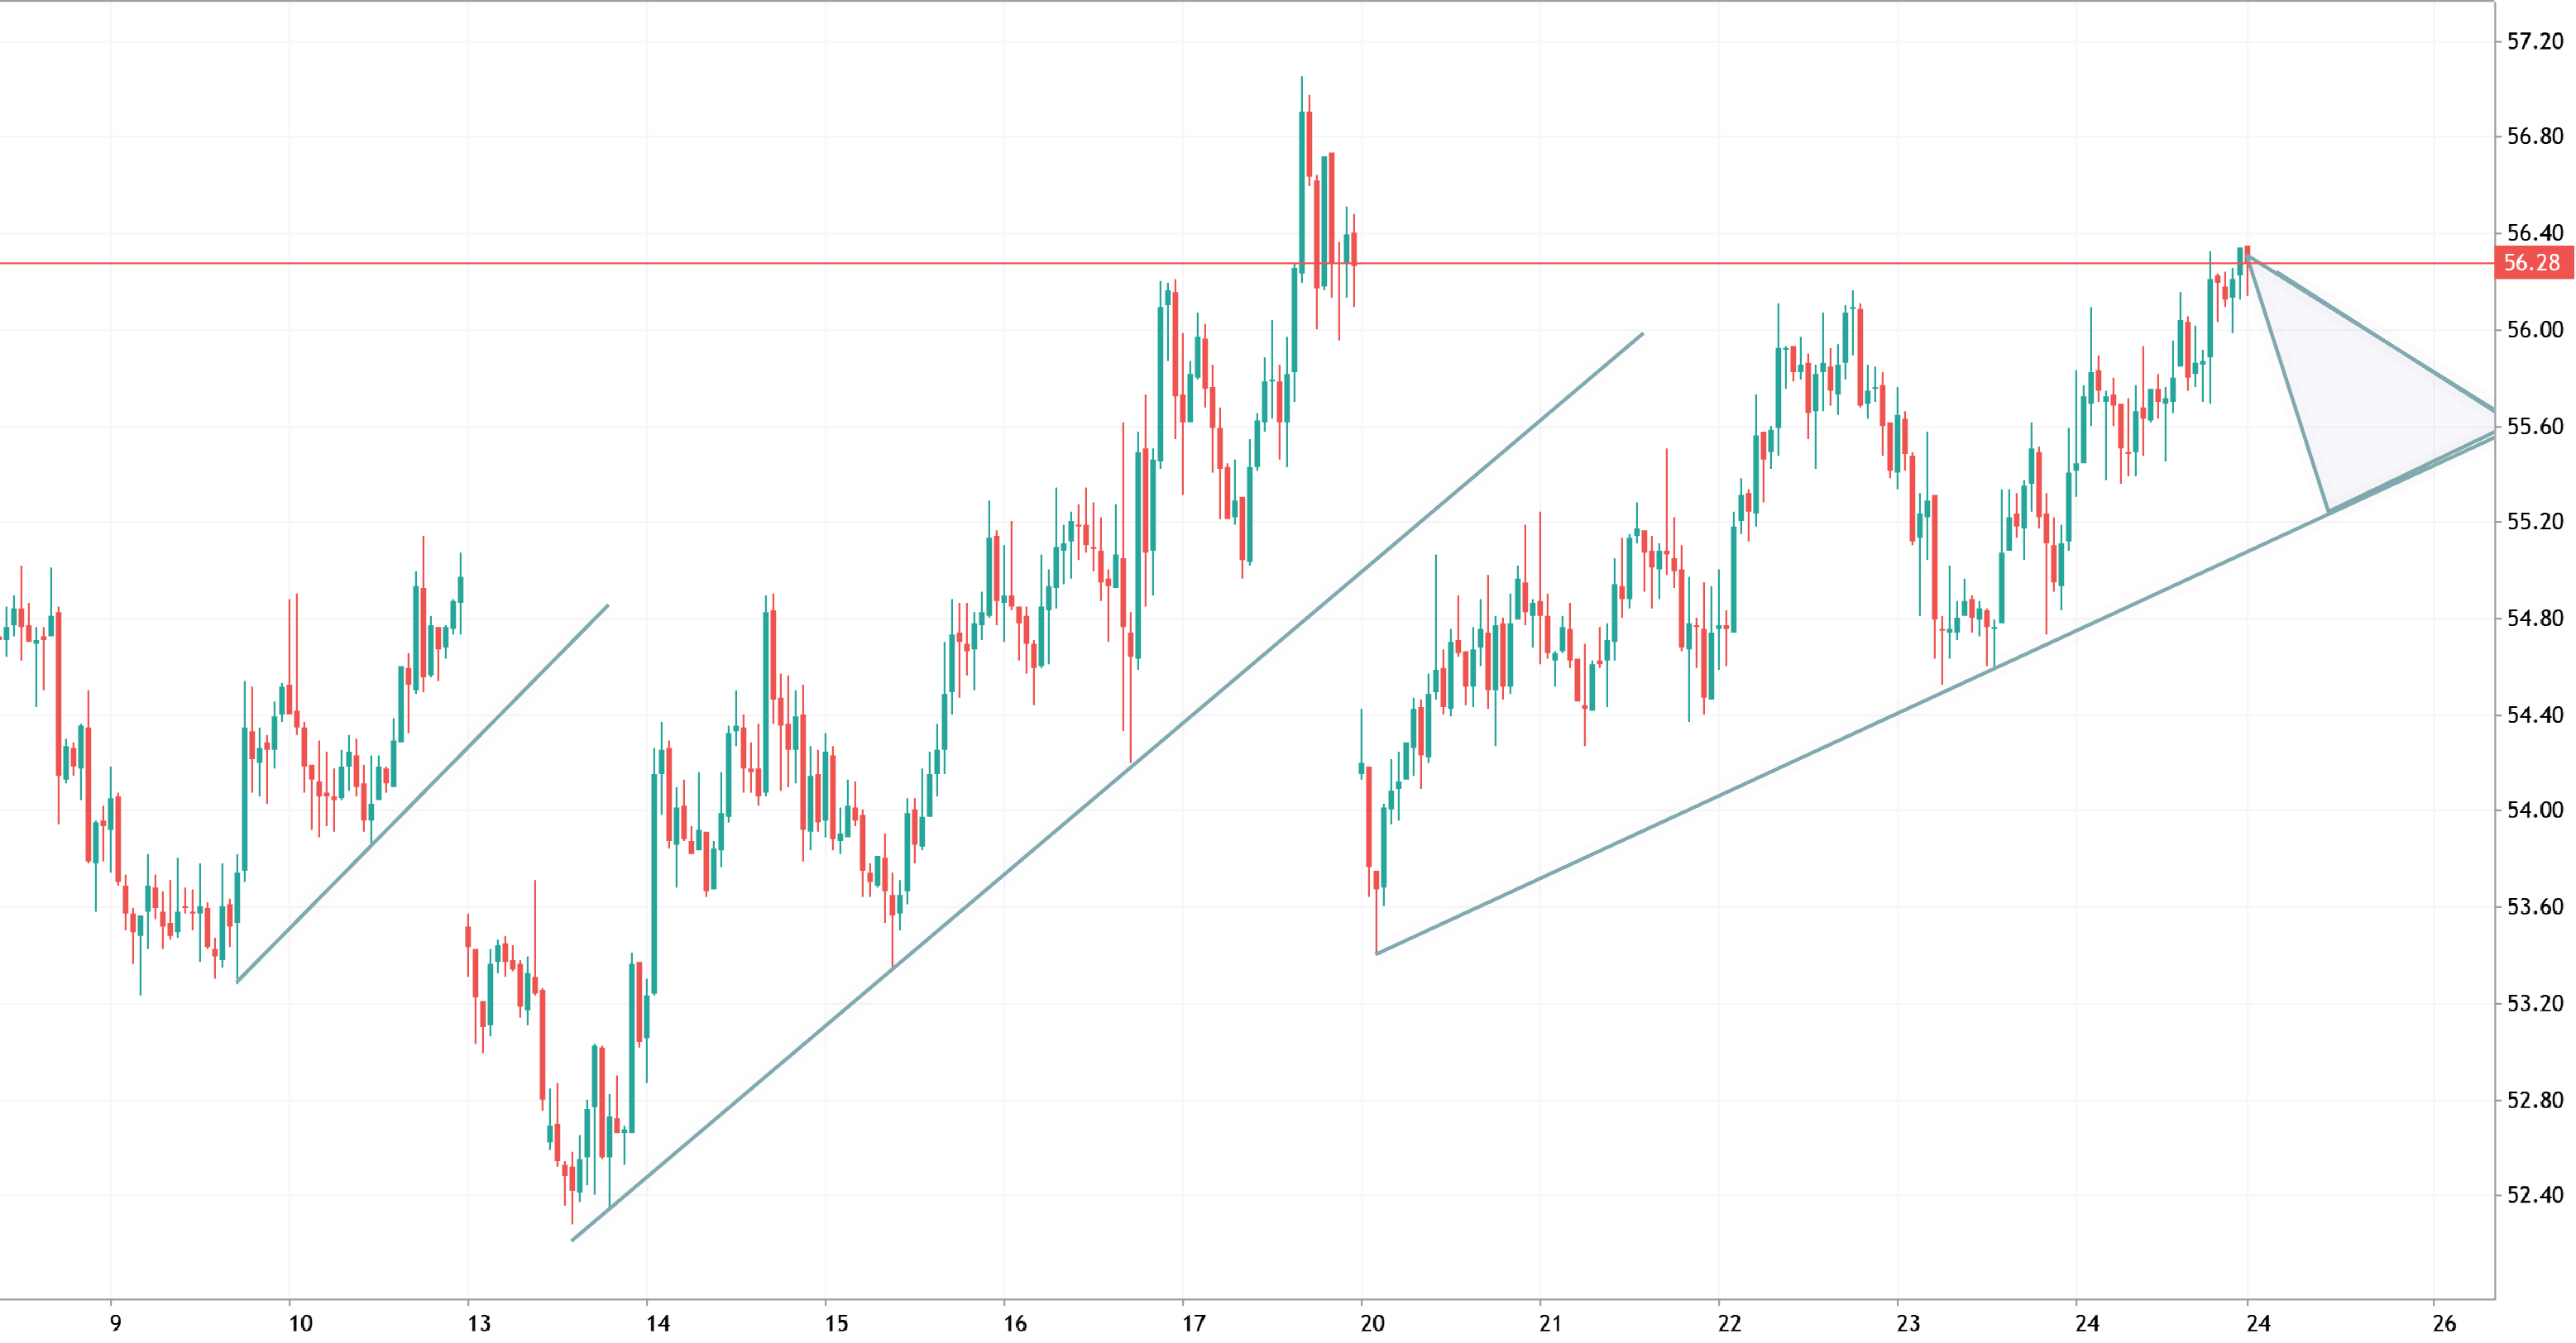
Short verdict — The chart shows an ascending triangle nested in an upward channel; the highest‑probability outcome is an upside continuation but with meaningful failure modes. Treat this as a probabilistic trade rather than a certainty: require confirmation (breakout close, volume, momentum) and manage position sizing to the edge you expect to earn.
Pattern quality and probabilistic scoring
AttributeAssessmentScore 1–10
Structure symmetry
Clean horizontal resistance; rising support with 3+ higher lows
8
Trend context
Inside a multi‑bar ascending channel — continuation bias
8
Volume signal
Not shown; missing critical confirmation
2
Momentum alignment
Price near mid‑channel; check RSI/MA slope for confirmation
6
Time compression
Triangle age moderate — measured move meaningful
7
Structure symmetry
Clean horizontal resistance; rising support with 3+ higher lows
8
Trend context
Inside a multi‑bar ascending channel — continuation bias
8
Volume signal
Not shown; missing critical confirmation
2
Momentum alignment
Price near mid‑channel; check RSI/MA slope for confirmation
6
Time compression
Triangle age moderate — measured move meaningful
7
Measured targets and math
- Triangle height = vertical distance between first high at resistance and first low at rising support.
Height=H
- Primary breakout target = breakout level B + H.
Target1=B+H
- Secondary extension = B+1.5⋅H if momentum and volume sustain.
Practical numbers from the chart (rounded):
- Breakout level B ≈ 56.28.
- Estimated height H ≈ 1.5–1.6 points.
- Target1 ≈ 57.8–57.9.
- Target2 ≈ 58.6–59.0.
Entry, stop, scaling, and position sizing (guru rules)
- Primary entry — A: buy on a daily close above 56.28 with volume confirmation; B: aggressive intraday entry on a clean breakout candle with >1.5× average volume.
- Stop placement — use ATR and structure: conservative stop below rising support (~55.6), tighter tactical stop below breakout retest if price reclaims breakout. Use ATR:
Stop distance=1.0–1.5×ATR(14)
- Sizing — risk per trade ≤ 1–2% of equity. Position size formula:
Size=Account RiskEntry−Stop
- Scaling — scale in: allocate 50% at breakout, add 25% on retest, final 25% on momentum continuation above Target1.
- Take‑profit plan — take partial at Target1, trail remainder with a moving average or ATR‑based trailing stop.
Confirmation checklist before committing capital
- Volume: contracting during consolidation, then spike on breakout.
- Momentum: RSI rising or breaking its own local resistance; no bearish divergence at breakout.
- Price action: clean breakout candle (large real body), minimal wick above resistance on first test.
- Higher timeframe: weekly trend not in structural downtrend; moving averages aligned (e.g., 20 > 50 on daily).
- Orderflow clues: if available, look for absorption at resistance (large sell prints followed by quick lift) or aggressive buy prints at breakout.
Failure modes and contingency plans
- False breakout: quick rejection above 56.28 and close back inside triangle — invalidate long bias; consider short or flat.
- Channel breakdown: break below rising channel support with volume — shift to bearish scenario and tighten stops.
- Low‑volume breakout: treat as suspect; wait for retest or additional confirmation before adding size.
Optional advanced plays (if you trade derivatives)
- Options debit spread (bull call spread) sized to risk: buy ATM call near breakout, sell higher strike near Target2 to reduce cost and define max loss.
- Iron condor / short premium only if you expect range — not recommended here given bullish structure.
- Delta‑scaling: use small delta long calls at breakout and add delta as price confirms.
Edge improvement and monitoring
- Add volume profile and VWAP to see institutional acceptance.
- Track ATR to size stops dynamically and to detect volatility expansion on breakout.
- Backtest similar ascending triangles on the same instrument and timeframe to quantify historical win rate and average R:R.

 MQL5-Profil
Neuer Kommentar