
While large holders continue to expand their positions, price action remains under pressure, leaving the market at a critical decision point between structural demand and bearish trend momentum.
Bitmine Expands Ethereum Holdings Amid Supply Contraction
Bitmine has continued its aggressive accumulation strategy, adding 126,971 ETH over the past week, bringing its total holdings to 5.54 million ETH. This positions the firm as one of the largest known Ethereum holders, controlling roughly 4.59% of the circulating supply.

BitMine increased its holdings to 5.54 million ETH after acquiring 126,971 ETH last week, bringing its total crypto and cash reserves to approximately $9.6 billion. Source: @BitMNR via X
A significant portion of this exposure is locked in long-term staking. According to the latest figures, 4.72 million ETH from Bitmine’s reserves is staked, reinforcing a strategy focused on yield generation and long-term network participation rather than short-term trading.
The company also reported total crypto and cash reserves of $9.6 billion, including $247 million in cash, highlighting a strong balance sheet allocation toward digital assets.
This accumulation trend comes at a time when Ethereum’s available supply on exchanges continues to tighten. In market structure terms, declining liquid supply combined with sustained demand from large holders is often viewed as a potential catalyst for sharper price reactions when sentiment shifts.
Ethereum Price Under Pressure Near $1,644
Despite the accumulation narrative, Ethereum is trading near $1,644, marking a 2.71% daily decline based on Bitstamp data. The broader trend remains decisively weak, with price positioned well below major moving averages across multiple timeframes.
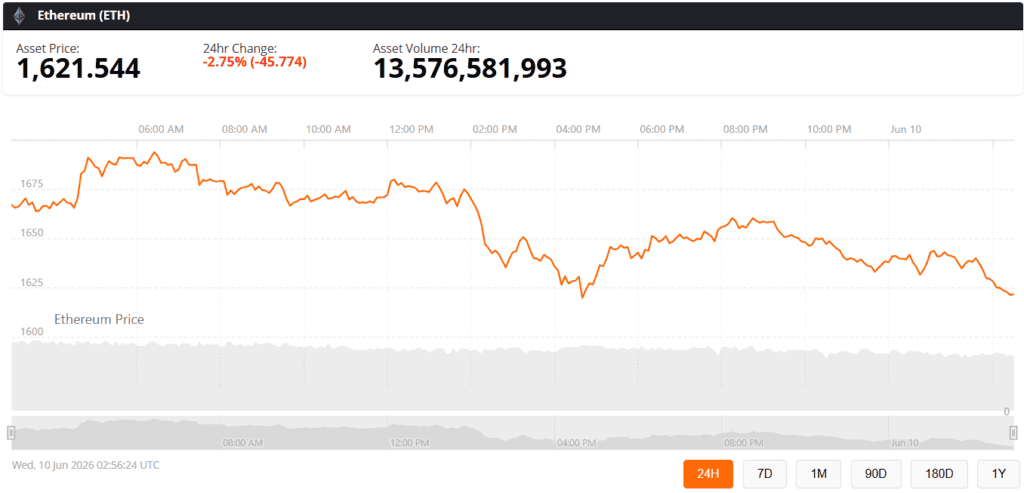
Ethereum (ETH) was trading at around $1,621. Down 2.75% in the last 24 hours at press time. Source: Ethereum price via Brave New Coin
Trading data shows a clear imbalance in sentiment:
15 Sell signals 9 Neutral signals 2 Buy signalsThe overall technical summary is classified as Neutral , though underlying indicators lean strongly bearish. Weekly and monthly readings continue to reflect strong sell conditions, suggesting that momentum has not yet stabilized despite occasional short-term pauses.
Ethereum Technical Analysis Signals Persistent Downtrend
Oscillator readings provide a mixed but cautious picture. Several key indicators are approaching oversold territory, yet confirmation of a reversal remains absent.
Notable readings include:
RSI (14): 26.0 — deep into oversold territory, indicating potential selling exhaustion Stochastic %K: 27.3 — also near oversold conditions CCI (20): -104.2 — the only clear buy signal among oscillators, suggesting possible short-term divergence MACD (12, 26): -145.0 — sell signal, reflecting sustained downside momentum Momentum (10): -375.1 — confirms continued bearish pressure ADX (14): 49.8 — indicates a strong trend, though direction remains bearishOverall oscillator distribution stands at 2 sell, 8 neutral, and 1 buy, showing that while downside momentum is strong, the market is not excessively stretched in the very short term.
Moving Averages Reinforce Bearish Structure
The moving average framework continues to paint a structurally negative outlook. Nearly all short- and long-term averages remain positioned above current price levels, reinforcing sustained downside pressure.
Key levels include:
EMA(10): ~$1,751 | SMA(10): ~$1,762 EMA(20): ~$1,873 | SMA(20): ~$1,914 EMA(50): ~$2,042 | SMA(50): ~$2,135 EMA(100): ~$2,178 | SMA(100): ~$2,139 EMA(200): ~$2,433 | SMA(200): ~$2,439The only notable positive outlier is the Hull Moving Average (9) at ~$1,610, which sits closer to current price levels and briefly registers a buy signal. However, broader trend alignment still confirms a dominant bearish structure, characterized by lower highs and lower lows.
Key Ethereum Support and Resistance Levels
From a pivot point perspective, Ethereum is currently trading within a fragile support zone:
Pivot Point (P): ~$2,131 Resistance (R1): ~$2,297 Support (S1): ~$1,838 Support (S2): ~$1,671 Support (S3): ~$1,211The market is currently hovering near the S2 support area, making this zone critical. A sustained breakdown below it could open the path toward deeper support levels, while a rebound could trigger a recovery attempt toward higher resistance clusters.
Outlook: Supply Tightening Meets Weak Momentum
Ethereum is currently caught between two opposing forces. On one side, institutional accumulation—led by Bitmine’s continued purchases—signals long-term confidence and shrinking liquid supply. On the other, technical indicators remain firmly bearish, with price trading below major averages and momentum indicators still pointing downward.
While some oscillators suggest early signs of exhaustion, there is no confirmed reversal structure yet. For now, Ethereum remains in a strong downtrend phase, and any recovery would likely require a combination of renewed demand, macro stability, and sustained breakouts above key resistance zones .