
Verwandte Ticker
| # | Name | Preis | 24h % | 7d % | 1M % | 1J % | Letzte 7 Tage | |
|---|---|---|---|---|---|---|---|---|
| 1 | LTCUSD Litecoin vs US Dollar | 59.75 USD | +1.44% | -3.27% | +11.49% | -37.84% | ||
| 2 | ETHUSD Ethereum vs US Dollar | 2433.74 USD | +0.53% | +0.76% | -5.29% | -40.78% | ||
| 3 | MBTUSD milliBitcoin vs US Dollar | 81.991 USD | +0.54% | +1.45% | +4.07% | -27.34% | ||
| 4 | ETCUSD Ethereum Classic vs US Dollar | 7.991 USD | +0.71% | +2.38% | +4.19% | -52.63% |
Nachrichten
Bitcoin fällt auf 80.000 USD nach starkem CPI: Halten die Wale ihre Zukäufe?
Bitcoin rutscht unter 81.000 Dollar: Heiße US-Inflationsdaten befeuern Wetten auf Zinserhöhungen
Krypto-Liquidationen erreichen fast 1 Milliarde USD, Long-Positionen tragen die meisten Verluste
Verliert XRP an Bedeutung in Korea? Einblicke von Chainalysis und Upbit
Ist Bitcoin bereit für Quantencomputer: Was der neue Plan von Coinbase zeigt
Bitcoin verharrt bei 83.000 Dollar – Märkte blicken gespannt auf US-Inflationsdaten
Wall Streets 110-Milliarden-USD-Anleihenwarnung: Was das für Aktien und Bitcoin bedeutet
Ethereum-FOMO kehrt zurück: ETF-Anleger verkaufen seit zehn Tagen
Der Wal hinter 29,75 Millionen USD Gewinn setzt jetzt auf Ethereum
Ausverkauf im Tech-Sektor drückt Bitcoin unter 84.000 $
Cleveland-Fed-Präsidentin fordert kleine, schnelle Zinsschritte: Das bedeutet es für Bitcoin
Charts & Ideen
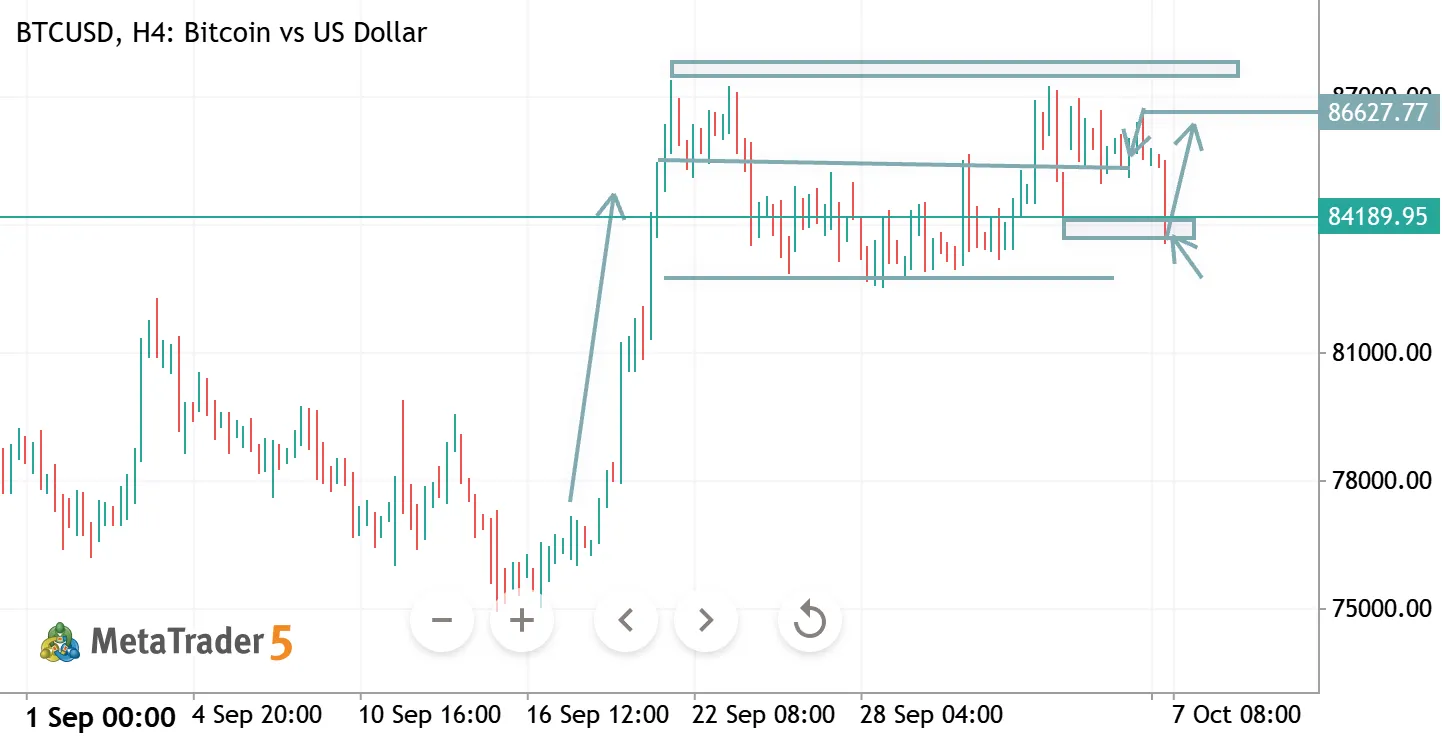
BTCUSD H4 ANALYSIS
BTCUSD H4 Analysis
BTC is consolidating near 84,100 after a strong recovery. The 84,000–84,500 zone is key support; holding above it could push price back toward 86,700–88,000.
🔹 Support: 84,000–84,500 🔹 Resistance: 86,700–88,000 🔹 Bias: Bullish above 84,000 🔹 Key Trigger: Break above 86,700 → upside continuation.

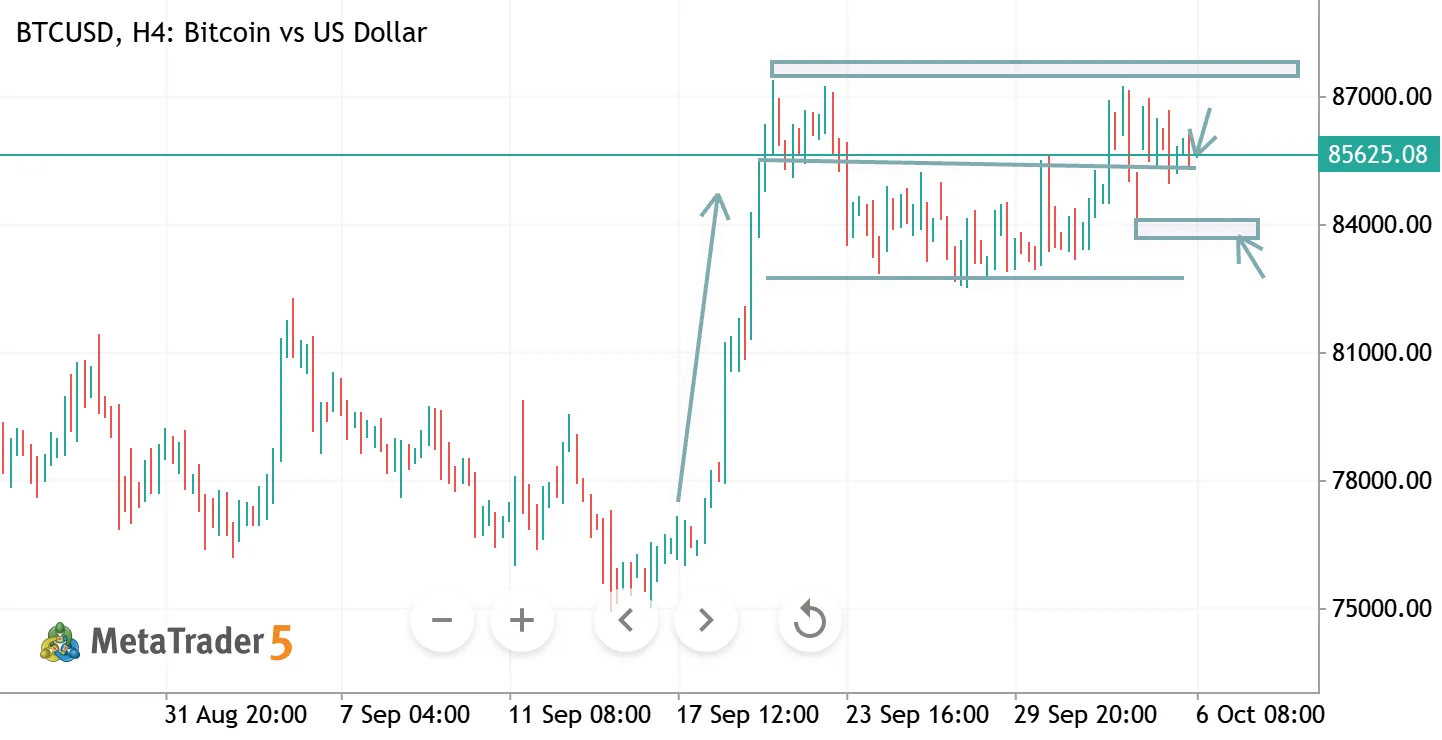
BTCUSD H4 ANALYSIS
BTCUSD H4 Analysis
BTC is consolidating below the 86,000–87,000 resistance zone after a strong recovery. A breakout above this area could resume the bullish move toward 88,000, while rejection may pull price back toward 84,000–82,500.
🔹 Resistance: 86,000–87,000 🔹 Support: 84,000–82,500 🔹 Bias: Bullish above 84,000 🔹 Key Trigger: H4 close above 87,000 → upside continuation.
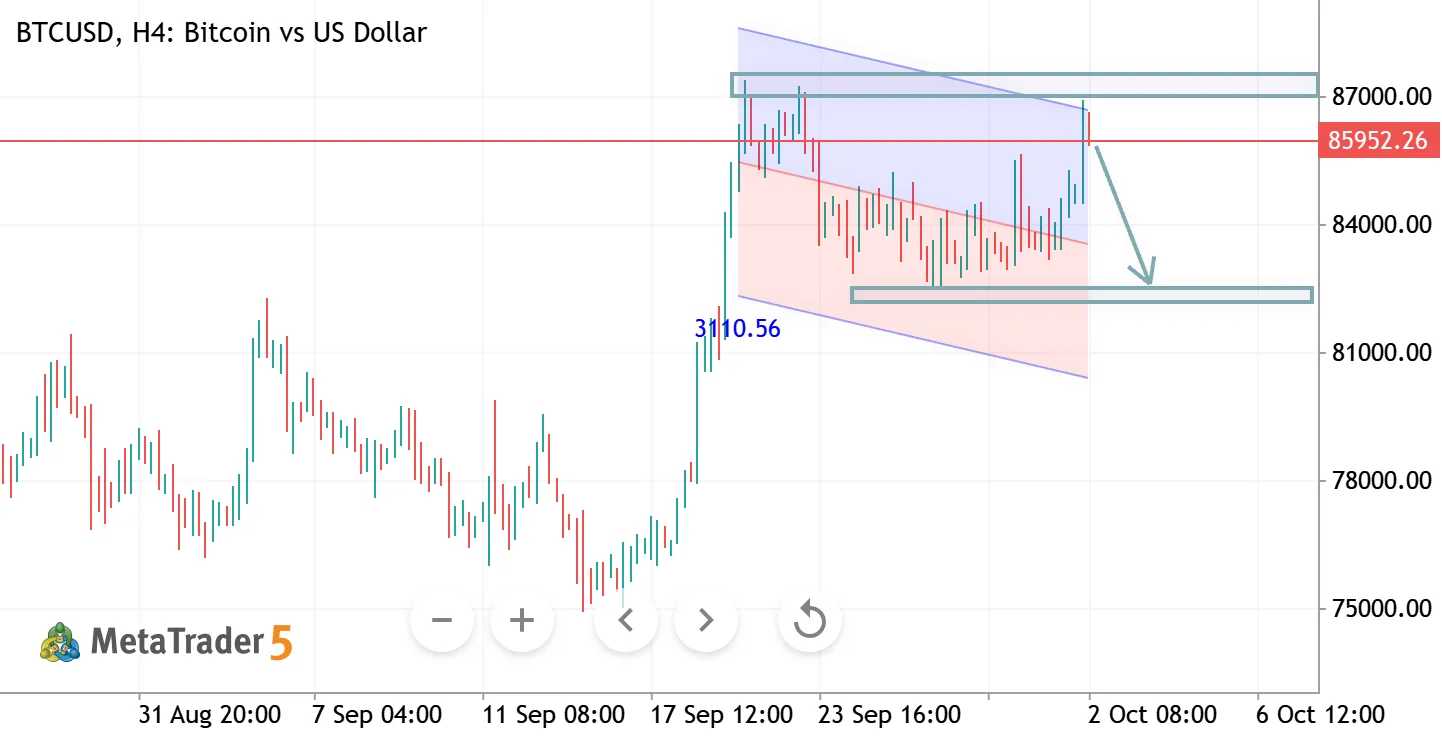
BTCUSD H4 ANALYSIS
BTCUSD H4 Analysis Bitcoin is testing a major resistance zone around 85,800–86,500 after a strong recovery. Rejection here could trigger a pullback toward the 82,000 support zone. 🔹 Resistance: 85,800–86,500 🔹 Support: 82,000–82,500 🔹 Bias: Bearish below 86,500 🔹 Key Trigger: Break above 86,500 → bullish continuation; rejection → downside toward 82,000.
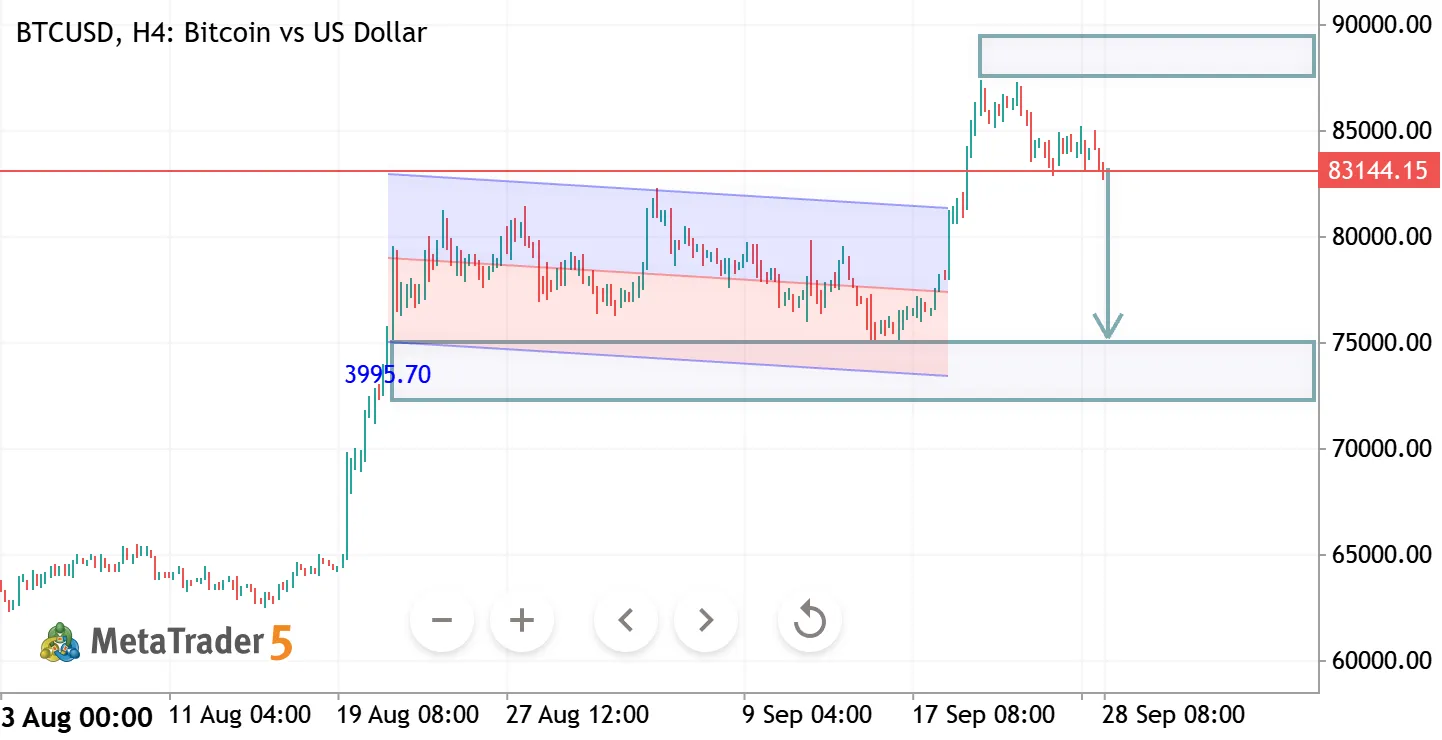
BTCUSD H4 ANALYSIS
GBPUSD – Technical Analysis 📊
GBPUSD is showing signs of a potential bullish reversal after moving within a descending channel. Price is holding around 1.3230, with the chart indicating a possible move toward the 1.3380–1.3400 resistance zone.
🔹 Support: 1.3200–1.3230 🔹 Target Zone: 1.3380–1.3400 🔹 Key Level: Sustained strength above 1.3260 would support the bullish setup.
Disclaimer: Technical analysis is based on chart structure and is not financial advice.
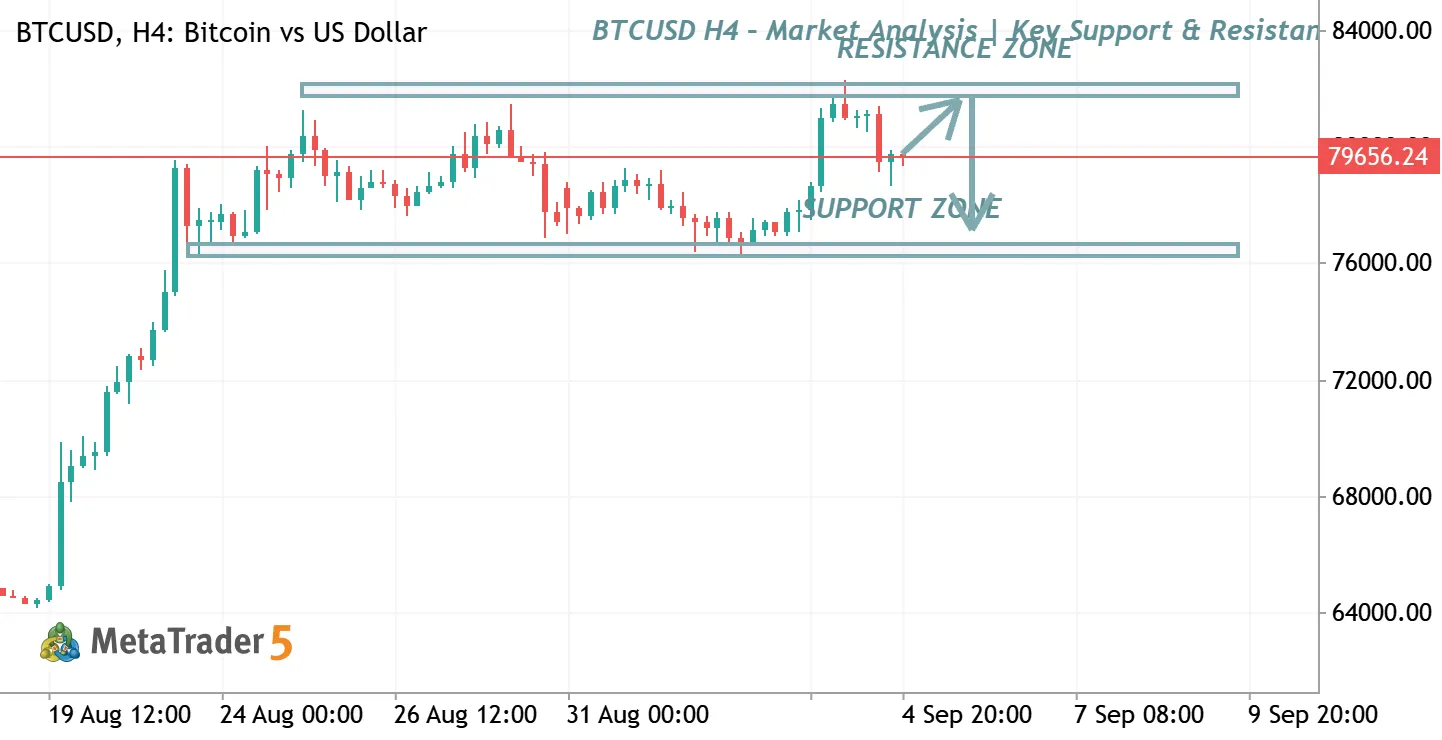
BTCUSD H4 – Market Analysis | Key Support & Resistance
BTCUSD is currently trading between important support and resistance zones on the H4 timeframe. Price is approaching a critical area where traders should watch for confirmation of either a bullish breakout toward the resistance zone or a bearish rejection toward support . 📈 Bullish Scenario: Break and hold above resistance may open the way for further upside.
📉 Bearish Scenario: Rejection from resistance could lead price back toward the major support zone. ⚠️ Trade with proper risk management and wait for confirmation before entering

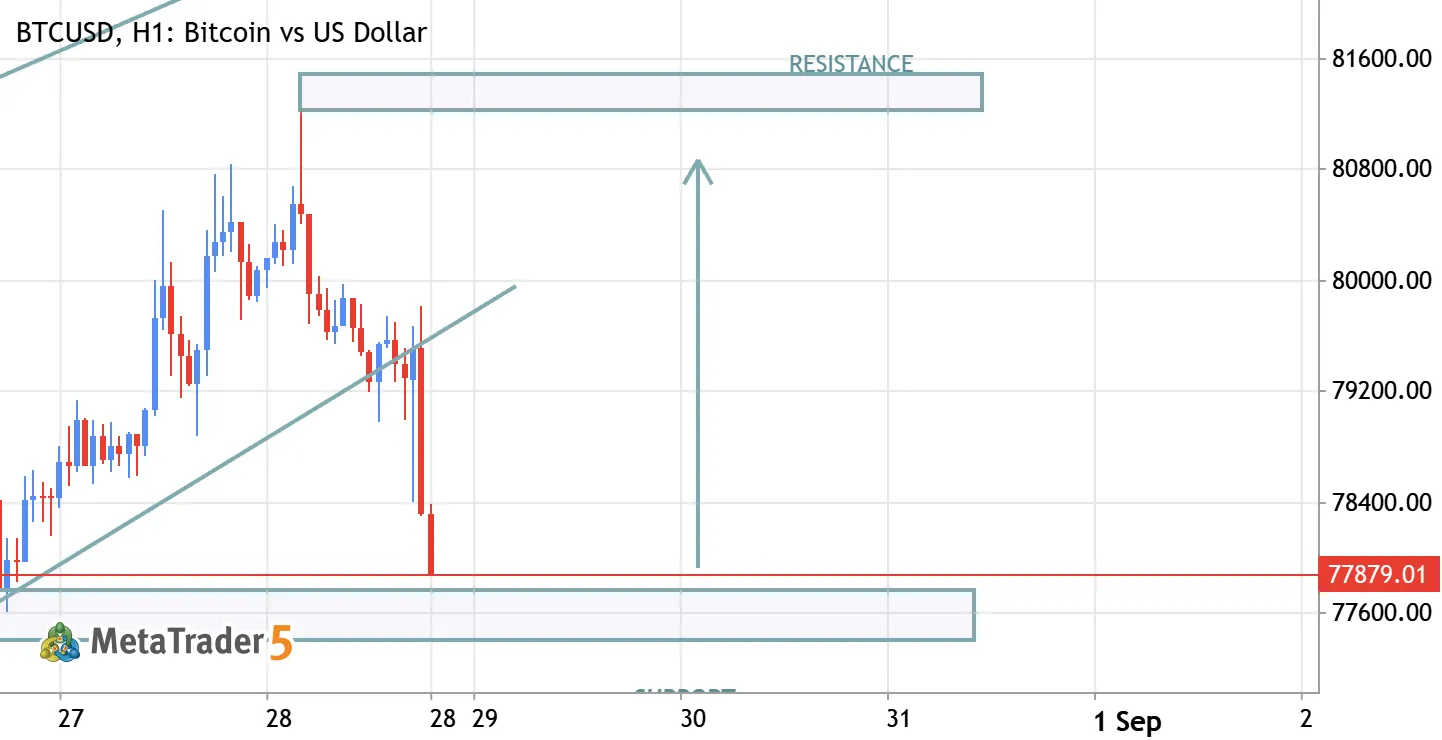
BTCUSD BULLISH TREND AFTER SUPPORT
BTCUSD BULLISH FROM SUPPORT TARGETS 81600


Für das BTCUSD gibt es derzeit keine weiteren Handelsideen.
Durchsuchen Sie vorgefertigte Handelsideen oder wählen Sie ein Symbol aus und verwirklichen Sie Ihre eigenen.
Gehen Sie zu „Charts und Handelsideen“