


Bitcoin (BTC) price has slipped more than 1% this month, trading at $77,577 as geopolitical tensions and rate expectations weigh on risk assets.
The decline has left traders watching several potential downside levels. One analyst points to $71,000, while seasonal trends suggest a similar target. On-chain data, however, places Bitcoin’s structural support much lower.
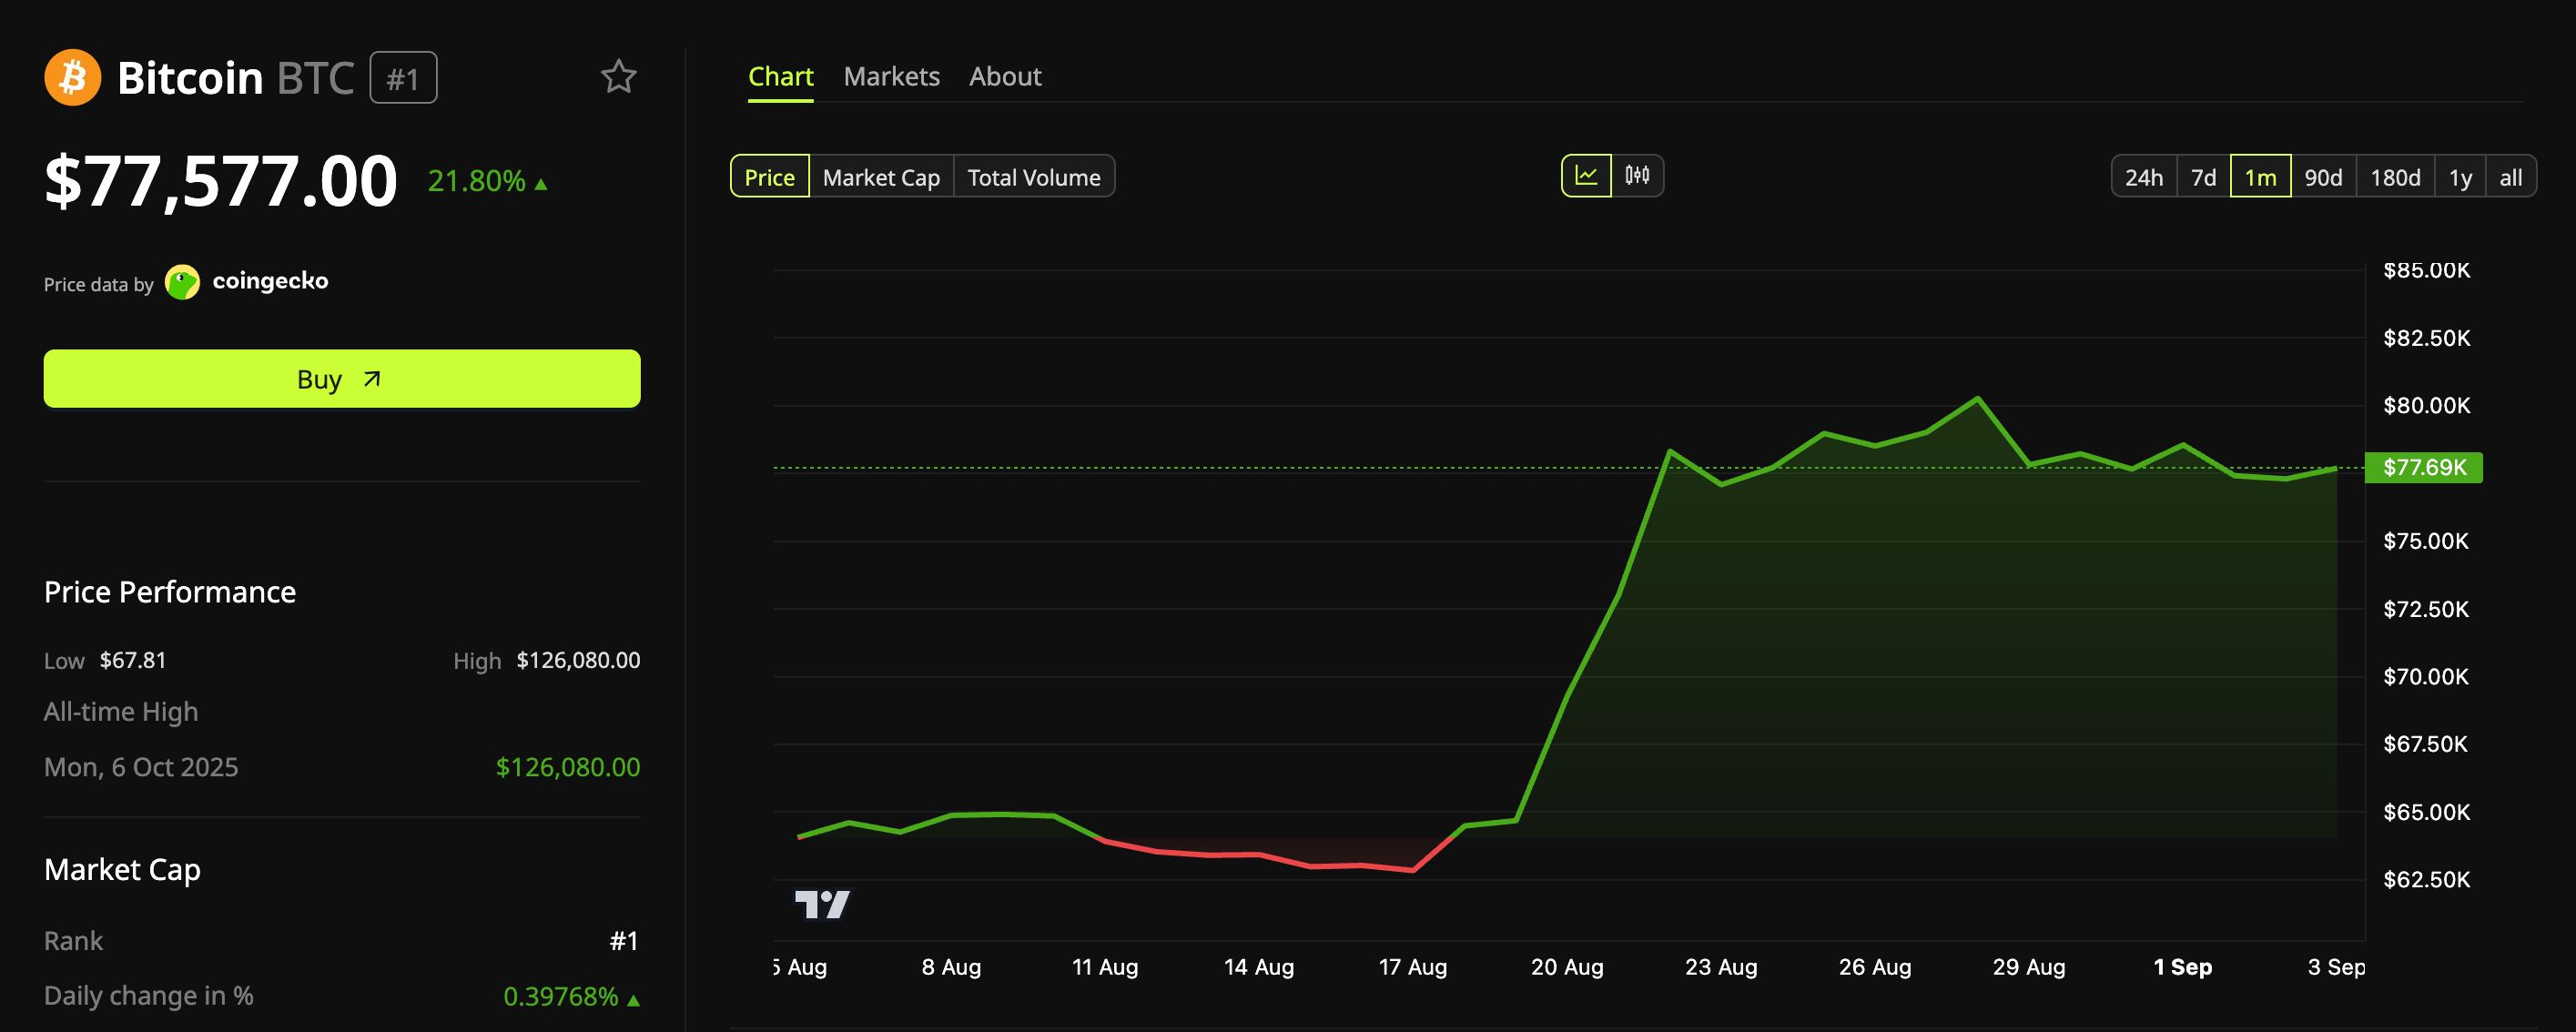 Bitcoin (BTC) Price Performance. Source: BeInCrypto Markets
 Follow us on X to get the latest news as it happens
Head And Shoulders Break Puts $71K In Play
Analysts CryptoGoos and Wealthmanager both identified the formation on four-hour charts. Price has lost the ascending neckline and is testing it from below.
Wealthmanager put $71,000 in play, should that retest get rejected. The same analyst set out the condition that would cancel the setup.
$BTC is forming a clear head and shoulders on the 4H.
— Wealthmanager (@Wealthmanager) September 2, 2026
Price has already lost the neckline and is now attempting a retest.
If the retest gets rejected this could open the door toward K.
The setup gets invalidated if $BTC reclaims the neckline and holds above it. pic.twitter.com/HThtCuZbl8
The pattern, therefore, hinges on a single level. Bitcoin reclaiming and holding above the neckline removes the bearish case.
Green Bitcoin August Records Point Lower
Seasonal data also points to further weakness. Bitcoin gained 24.95% last month, marking its strongest August performance since 2017.
Historically, strong August gains have often been followed by September declines. CoinGlass's monthly return data show four previous instances in which Bitcoin posted a green August and then closed September lower.
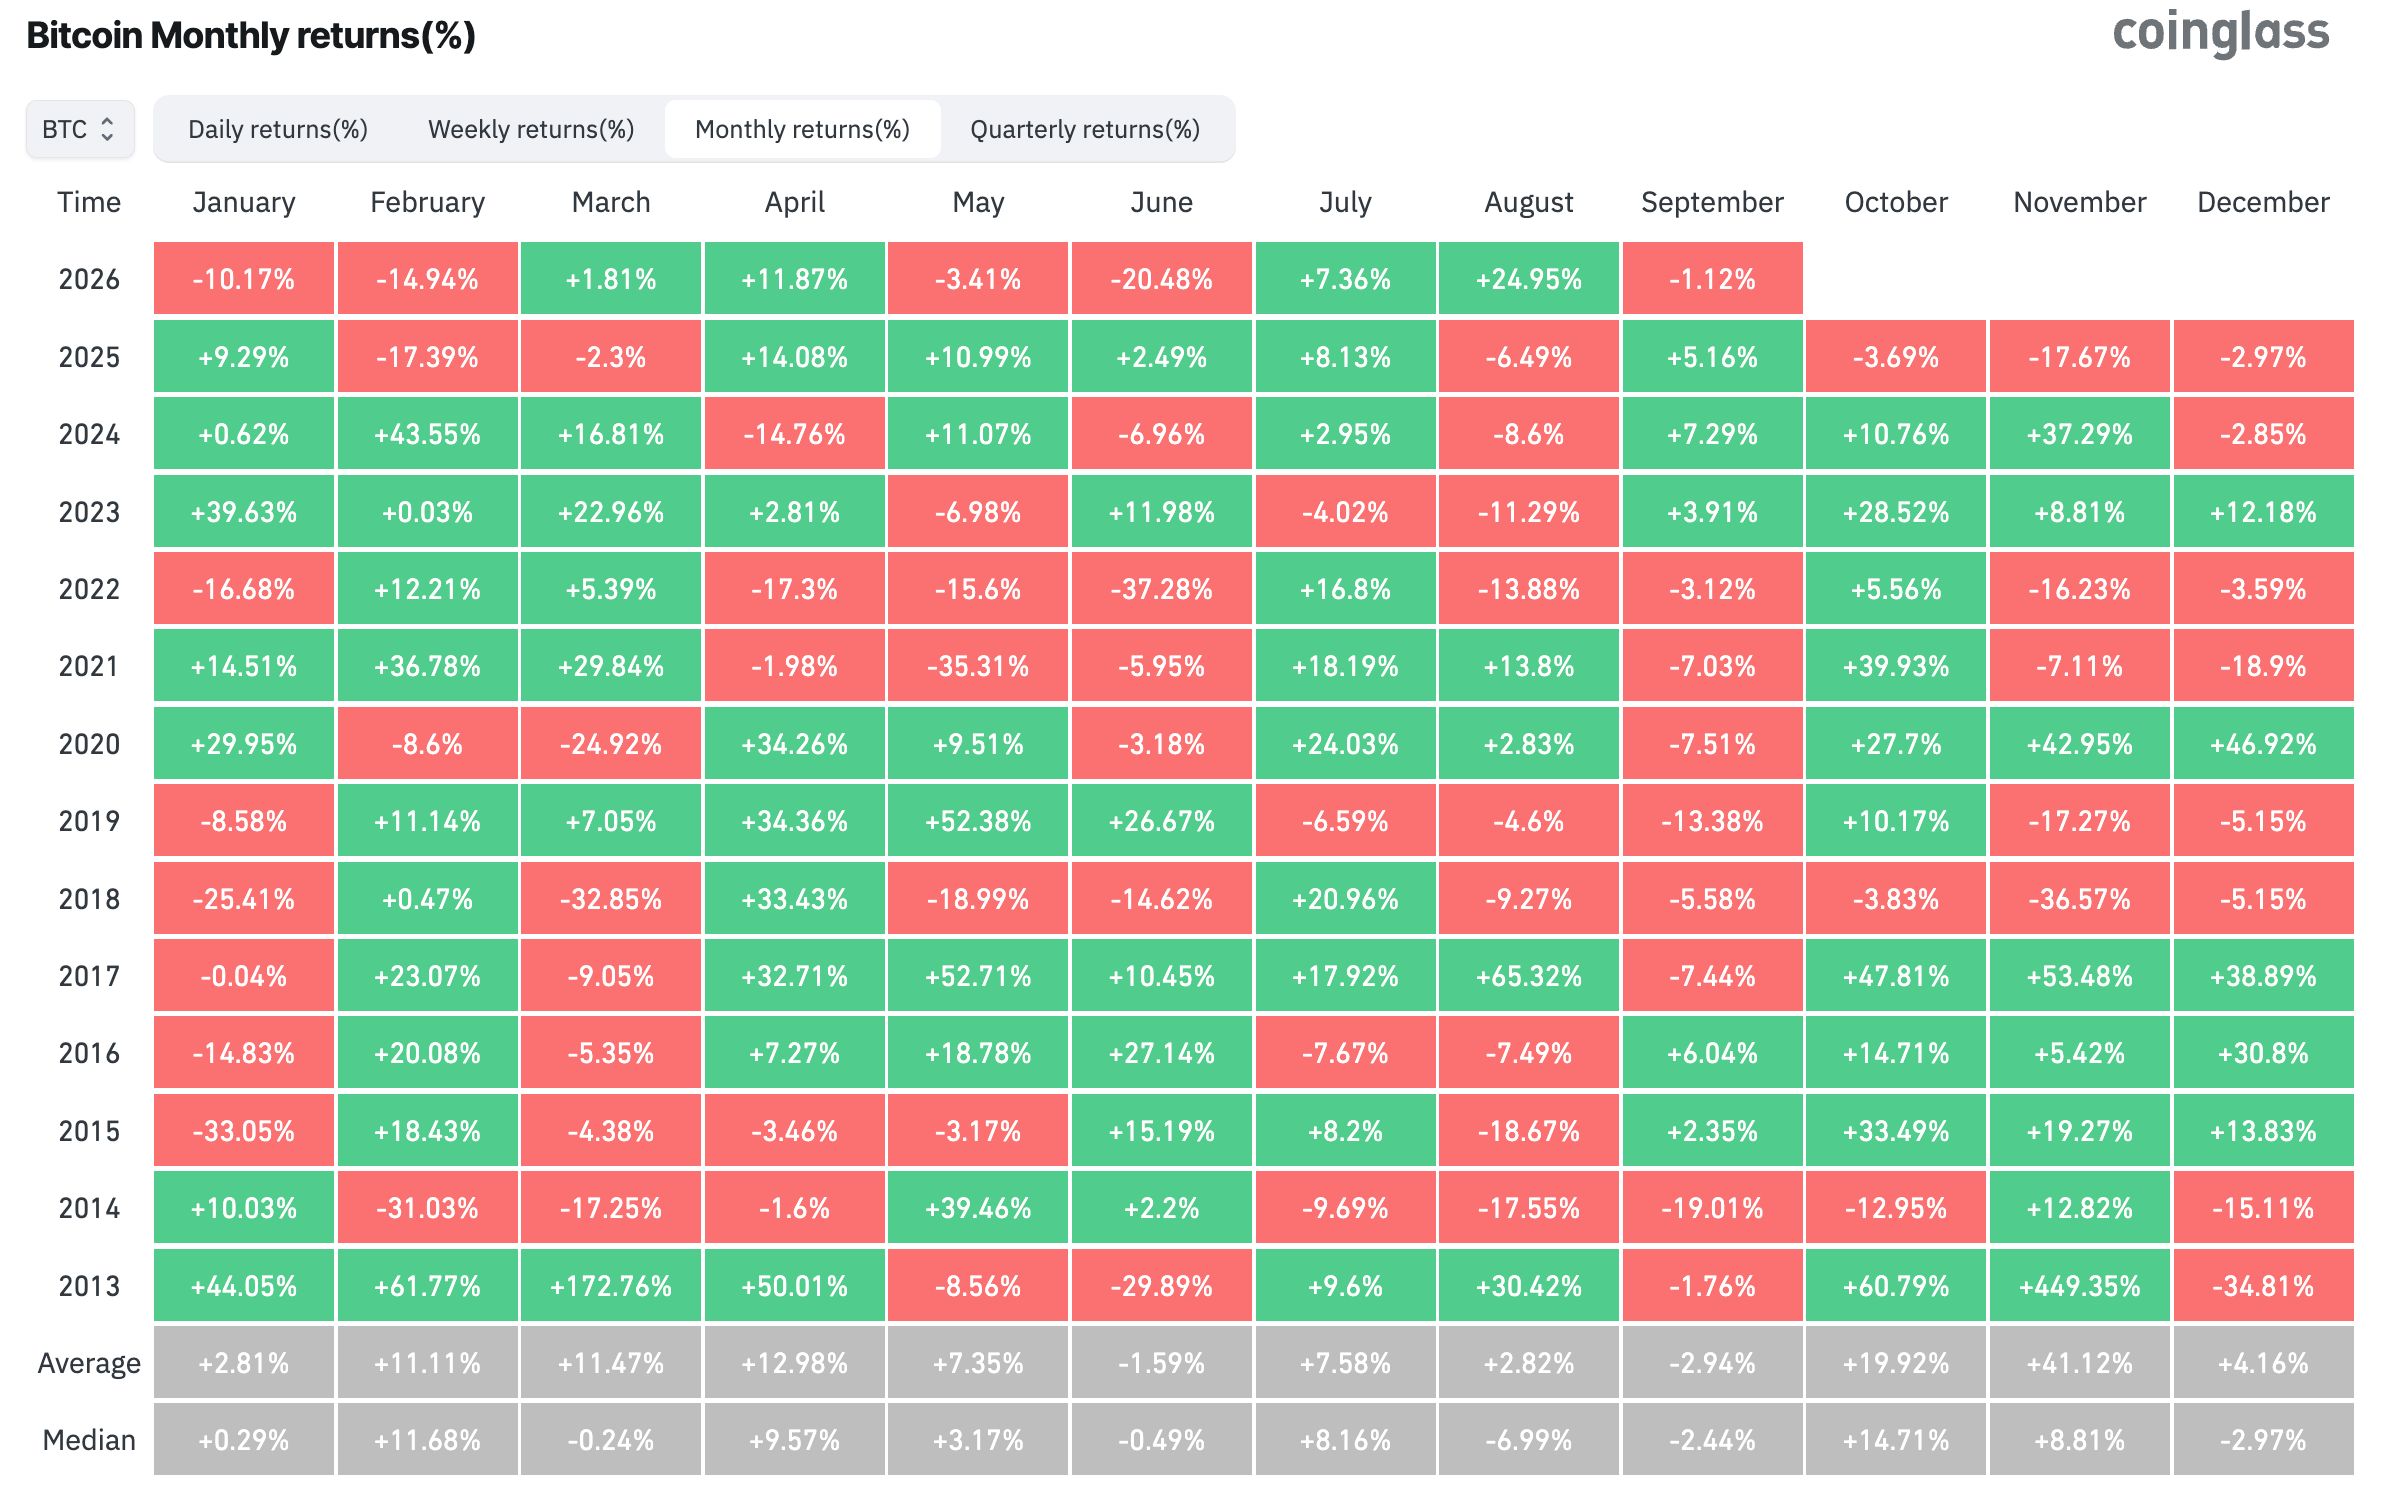 Bitcoin Returns in September After a Green August. Source: CoinGlass
 Those declines measured 1.76% in 2013, 7.44% in 2017, 7.51% in 2020, and 7.03% in 2021. The median is 7.24%.
Applied to September's opening price of $78,516 on Binance, that projects $72,831. However, only four instances exist across 13 years. The last three Septembers all closed green. None of them followed a green August.
Glassnode Places The Floor Far Below
Structural support sits well beneath both projections. Glassnode identifies an accumulation floor between $62,000 and $65,000, built during summer consolidation.
The firm also identified a band of long liquidation fuel between $60,000 and $63,000. Meanwhile, heavy long-term holder supply sits between $83,000 and $86,000, capping advances above the current price.
“Until the overhead ceiling is absorbed, the structural floor between $62K and $65K defines the primary downside reference,” the firm said.
The three levels sit far apart. What happens at the neckline may decide which one comes into view first.
Subscribe to our YouTube channel to watch leaders and journalists provide expert insights
https://youtu.be/E6LXrDa_Ri8Read the Original story Where Does Bitcoin Go From Here? This Chart Pattern Says $71,000 by Kamina Bashir at beincrypto.com