


Bitcoin is going quiet after a violent week, and chart watchers think that calm could be the setup for the next move higher.
Our Bitcoin technical analysis shows that currently, BTC is trading at $75,865, down 0.41% on the day, inside a tight range between $75,645 and $75,979. That is a 0.4% daily range after a week in which Bitcoin was knocked back to the critical $76,000 level by the AI-driven sell-off.
The price is still down 3.2% over the past week and 7.2% over the past month. But two well-followed analysts now see bullish signals building on both the short- and long-term charts.
Below, we are showing a detailed BTC technical analysis and the current sentiment by traders on X..
Analyst Spots A 4H Bullish Checkmate Setup
Crypto trader Cheds Trading took a bullish note and shared it on X , showing Bitcoin’s 4-hour chart and how it is now flashing a potential bullish checkmate setup.
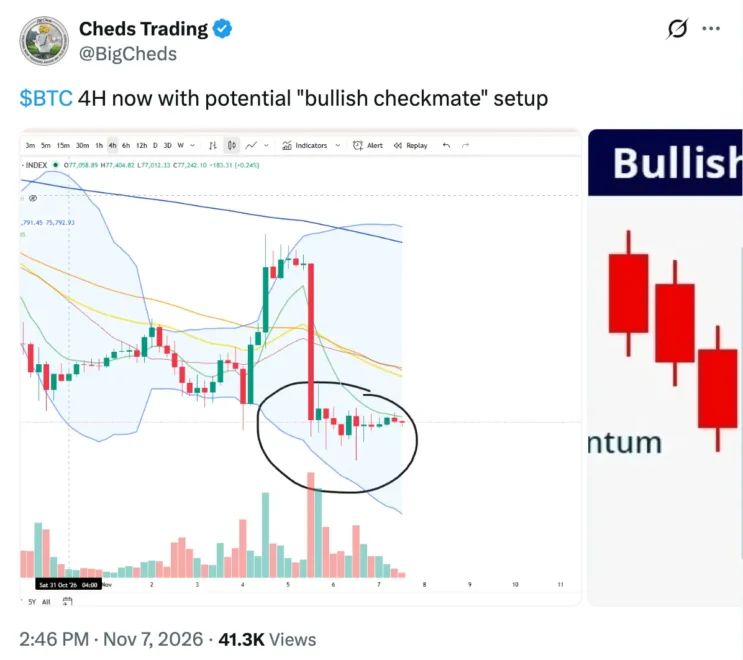
The chart shared by the analyst shows a large red capitulation candle that wiped out the early-November rally, followed by a series of small-bodied candles grinding sideways near the lower Bollinger Band. Selling momentum has faded, volume has dropped off, and price has stopped making meaningful new lows.
That kind of compression after a sharp flush often signals that sellers are running out of steam. If buyers step in, the tight range can resolve with a sharp move to the upside.
The short-term indicators support that view. On the hourly chart, BTC’s technical summary reads Buy, while technical indicators flash Strong Buy with seven buy signals against just one sell.
Bitcoin Reclaims A Nine-Year Trendline
The bigger picture is turning more constructive too. Part-Time Trader posted on X saying that Bitcoin has reclaimed a nine-year trendline he has been tracking for months, calling it one of the reasons he has now flipped bullish on crypto.
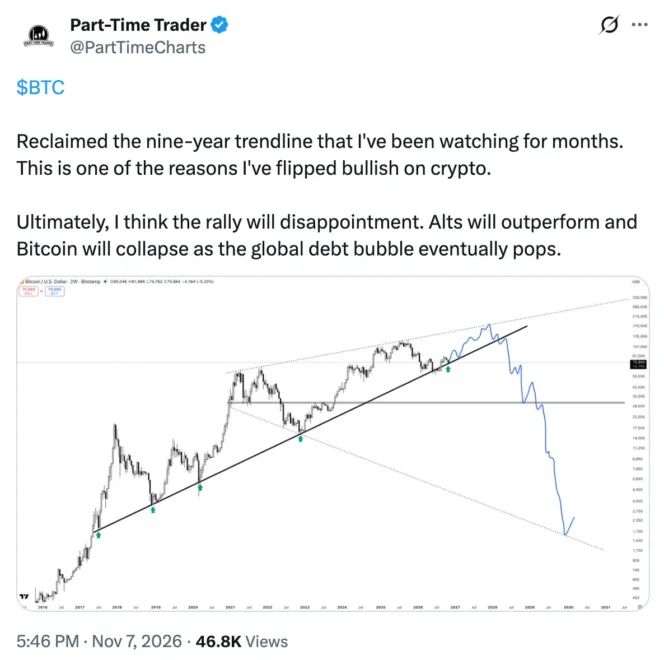
That trendline connects Bitcoin’s major cycle lows, including the 2018-2019 bottom, the March 2020 crash and the late-2022 bear market low. Every time BTC has bounced off it, a major rally has followed.
The analyst’s chart projects a fresh leg higher from here, with Bitcoin pushing toward new all-time highs. However, he was clear that he does not see it lasting forever. He expects the rally to ultimately disappoint, with altcoins outperforming and Bitcoin eventually collapsing when the global debt bubble pops.
For now, though, holding above this long-term support line keeps the bullish structure intact.
Bitcoin Technical Analysis Across Timeframes
The signals change depending on how far you zoom out. Short-term charts have turned bullish, while the daily chart still reflects last week’s damage.
| Timeframe | Signal |
|---|---|
| 30 minutes | Strong Buy |
| Hourly | Buy |
| 5 hours | Strong Sell |
| Daily | Strong Sell |
| Weekly | Neutral |
| Monthly | Neutral |
On the hourly chart, the RSI sits at 49.4, right in neutral territory, leaving plenty of room to run in either direction. The CCI at 109 and the Williams %R at -28 both flash buy signals.
The Stochastic RSI has climbed to 80.4, which is overbought, and the MACD is still slightly negative at -32. The ADX at 21 confirms there is no strong trend in place yet, while the ATR at 153 points to low volatility. Compressed volatility like this usually comes before a big move.
Bitcoin Price Levels To Watch
BTC is trading right on top of its short-term moving averages. The hourly 5, 10 and 20-period MAs all sit between $75,811 and $75,864, providing immediate support.
The first hurdle overhead is the hourly 50-period EMA near $76,108. Above that, the 100 and 200-period MAs between $76,647 and $77,410 form the key resistance zone. A clean break above $77,400 would confirm Cheds’ checkmate setup and open the door toward $78,500 and the $80,000 to $82,000 range.
On the downside, the classic pivot supports sit at $75,859, $75,756 and $75,696. A break below $75,000 would expose the $74,000 liquidity zone and put the nine-year trendline back in focus.
Bitcoin is still down 25.8% over the past year, and its 52-week range spans from $57,833 to $107,461. But it is also up 16.8% over the past three months, a reminder that the medium-term trend remains intact.
For more market updates, follow the latest Bitcoin price analysis .
What do you think happens next?
Will Bitcoin’s bullish checkmate setup trigger a breakout above $77,400, or does BTC need to retest $74,000 first?