

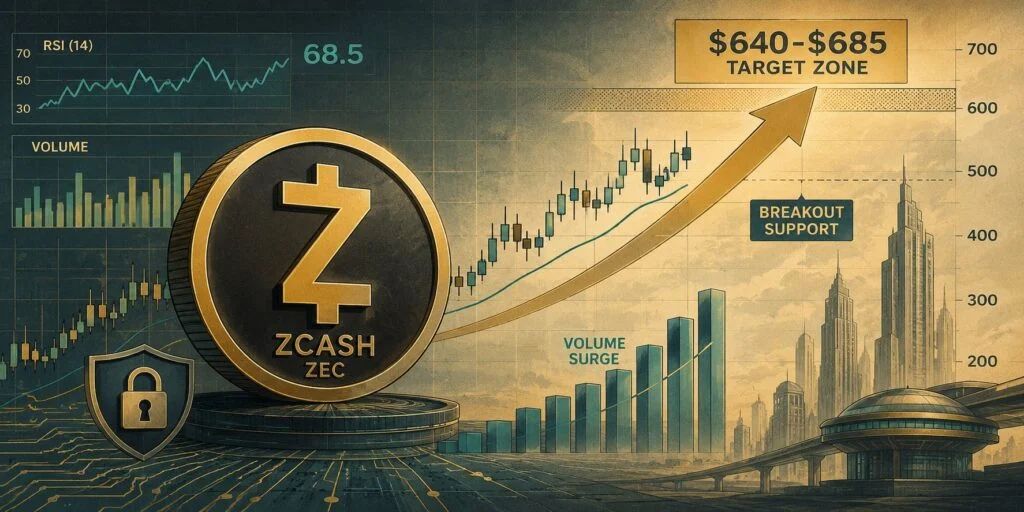
The privacy-focused cryptocurrency has reclaimed several key resistance levels in recent weeks, while improving trading volume and strengthening momentum indicators have shifted Zcash price sentiment toward a more constructive outlook.
Multiple independent technical analyses now identify the $640-$685 region as the next major resistance area, provided ZEC maintains support above recently reclaimed breakout levels.
Zcash Breakout Signals Improving Market Structure
ZEC has gained more than 21% over the past week and over 9% during the last month, according to TradingView market data. The token has also advanced roughly 37% over the past six months and more than 1,190% over the last year, reflecting sustained long-term strength following its recovery from earlier 2026 lows.
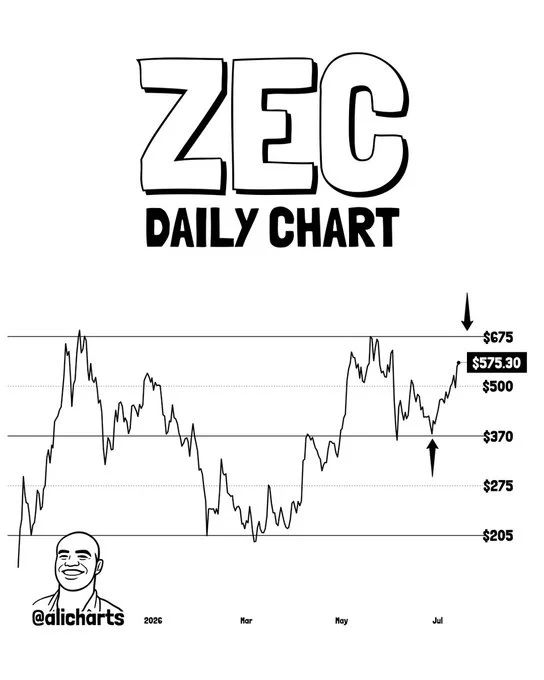
Zcash ($ZEC) continues to trend higher on the daily chart, with the next major resistance projected at the channel's upper boundary around $675–$680 as price trades near $575. Source: Ali Martinez via X
At the time of analysis, ZEC was trading between approximately $566 and $579, giving the cryptocurrency a market capitalization near $9.5-$9.7 billion. Daily trading volume has remained above $600 million, highlighting continued market participation during the latest advance.
Crypto analyst Ali Martinez (@ali_charts) noted that ZEC continues climbing within an ascending channel on the daily chart. According to the analyst, the next significant resistance sits near the upper boundary of the channel around $675-$680.
Martinez's earlier analysis, published on July 5, highlighted a successful rebound from the channel's mid-range support between $370 and $463, a move that has since developed into the current rally toward the upper end of the trading range.
RSI and Volume Support Bullish Momentum
Recent chart analysis suggests ZEC has completed an important technical breakout after moving above a descending trendline that capped price action for several weeks.
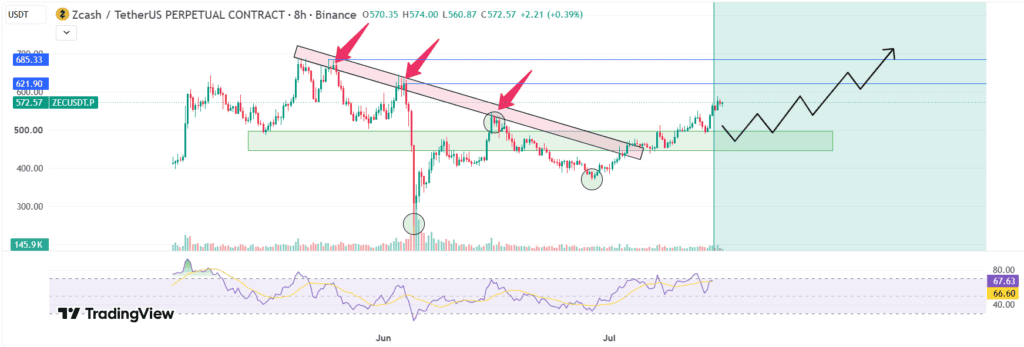
Zcash ($ZEC) has broken above its descending trendline, signaling a bullish trend shift, with $495–$445 remaining the key support zone. Source: Leo524 on TradingView
According to TradingView analyst Leo524 , buyers have successfully defended the breakout zone, signaling what the analyst described as "an important shift in market structure." The analysis adds that RSI remains above the neutral 50 level and continues strengthening, while trading volume has improved during the breakout phase.
However, the analyst also noted that stronger buying volume would provide additional confirmation of trend continuation. "I won't chase green candles after a strong move. The highest probability setup comes from either a healthy pullback into support with a strong bullish reaction or a clean breakout above the recent swing high followed by a successful retest," the analyst wrote.
The analysis identifies the $495-$445 region as the primary support zone. As long as ZEC holds above that area and RSI remains above 50, the bullish structure remains intact. A confirmed breakout above the recent swing high could expose resistance levels near $620 and eventually $685.
Wave Analysis Targets $674 Resistance
Another TradingView wave analysis points to additional upside after ZEC broke above the $528.75 resistance level, which also aligned with the 61.8% Fibonacci retracement of the previous corrective decline.
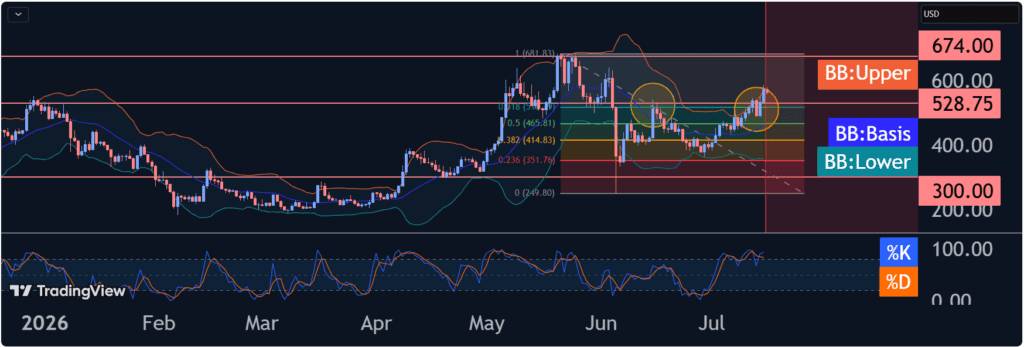
Zcash ($ZEC) has broken above the $528.75 resistance, accelerating bullish momentum and opening the way for a potential move toward $674. Source: 3Commas on TradingView
According to the analyst, the breakout accelerated an ongoing impulse wave 3, increasing the probability of a move toward the next major resistance around $674, a level that acted as strong resistance during May.
Meanwhile, another market observer highlighted a broader recovery pattern following ZEC's sharp decline from nearly $685 to around $250 earlier this year. Since then, the cryptocurrency has rebuilt support above $400 before rallying back toward the mid-$500s.
The analyst noted that RSI has climbed toward 65, indicating strengthening momentum without necessarily entering extreme overbought territory. The report also identifies $480 as an important support level, while $600 represents the next key breakout trigger. A sustained move above that level could strengthen the case for an advance toward $640.
TradingView Indicators Continue to Favor Buyers
TradingView's overall technical summary currently reflects a Strong Buy rating, supported primarily by moving averages. Market data indicates that the majority of major moving averages remain aligned in a bullish configuration, with price trading comfortably above the 50-day moving average near $532-$533.
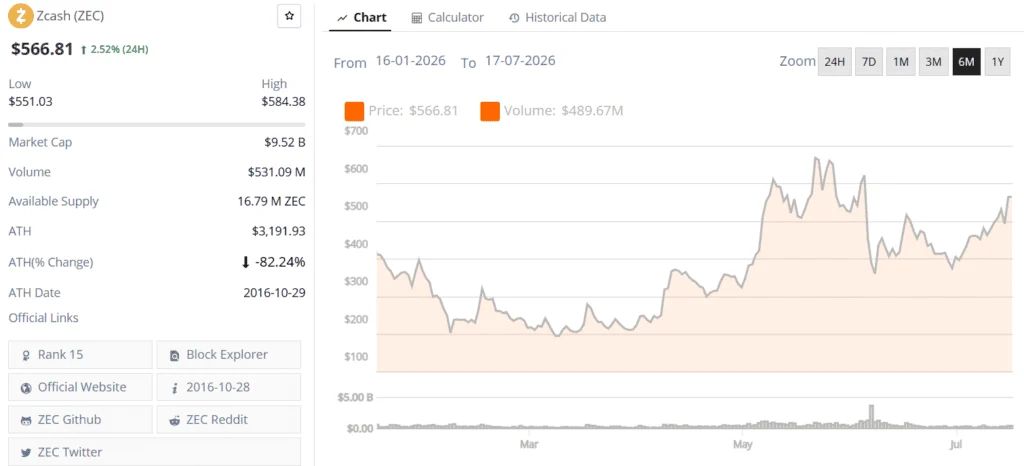
Zcash (ZEC) price chart. Source: Brave New Coin
Oscillator readings remain comparatively balanced. While TradingView's visible oscillator panel currently appears neutral, its broader technical summary continues to indicate a Buy signal, suggesting momentum remains supportive without clearly reaching overbought conditions.
The technical picture is further supported by ZEC's successful break above the $528-$550 resistance area, which has now become an important support region. Holding above this zone could keep the broader uptrend intact, while a loss of the $540-$550 area may encourage a deeper pullback toward lower support levels .
Beyond chart patterns, traders are also monitoring the upcoming Ironwood network upgrade scheduled for late July, which introduces enhancements to Zcash's shielded pool infrastructure. Although technical indicators currently favor buyers, continued momentum will likely depend on sustained trading volume, broader cryptocurrency market conditions, and Bitcoin's price direction .