


The setup has created a split technical picture: the prevailing BNB price trend remains weak, but several momentum indicators are showing conditions that could allow for short-term stabilization.
Recent analysis cited by TradingView shows BNB trading around the mid-$560s to $570 area, with the latest available TradingView data placing BNB/USDT near $569.56. The pair has also remained below its short-, medium-, and long-term moving averages, keeping the broader BNB price prediction tilted cautiously bearish.
The immediate question for traders is whether the daily channel support can hold. A sustained defense of that area could give buyers an opportunity to push BNB back toward the middle of the range. A decisive breakdown, however, would strengthen the case for a move toward the psychologically important $500 level.
BNB Price Prediction Faces Lower-High Structure
One of the clearest bearish signals in the current BNB price action is the sequence of lower highs visible on the daily chart. Technical analyst AnhbaCong described the pattern as a continuation of a "sequential lower-high structure," arguing that the latest peak remains below previous swing highs.
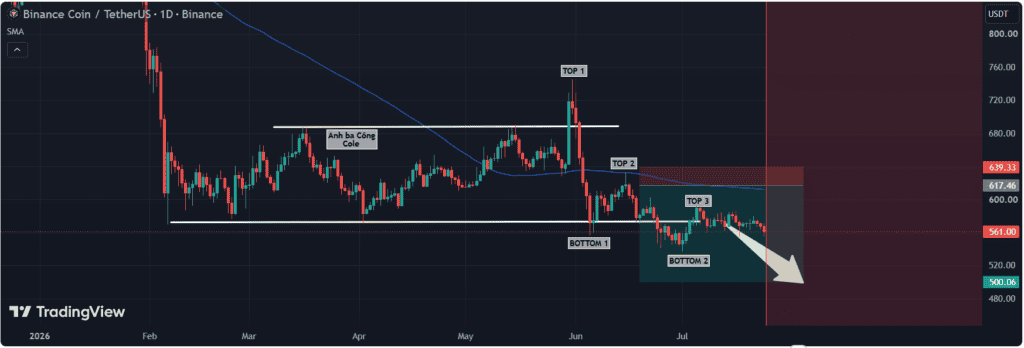
BNB has formed another lower high, reinforcing the broader weakening trend and continued bearish price structure. Source: AnhbaCong on TradingView
This pattern is important because repeated lower highs generally indicate that sellers are gaining control of rallies. Instead of sustaining upward momentum, each recovery is being met with renewed selling pressure at progressively lower levels.
The analysis also notes that BNB has remained below its dynamic moving-average baseline. That behavior suggests that buyers have so far been unable to establish sustained control above key trend indicators.
However, the structure does not automatically guarantee another sharp decline. The latest TradingView technical data shows that BNB's oscillators are considerably less bearish than its moving averages, leaving room for consolidation or a relief bounce before the next major directional move.
Daily Channel Support Puts BNB Bulls to the Test
Another technical view focuses on BNB's position near the lower boundary of a parallel channel on the daily timeframe. Analyst UROSCRYPTOSERB described this area as a level that has previously acted as dynamic support.
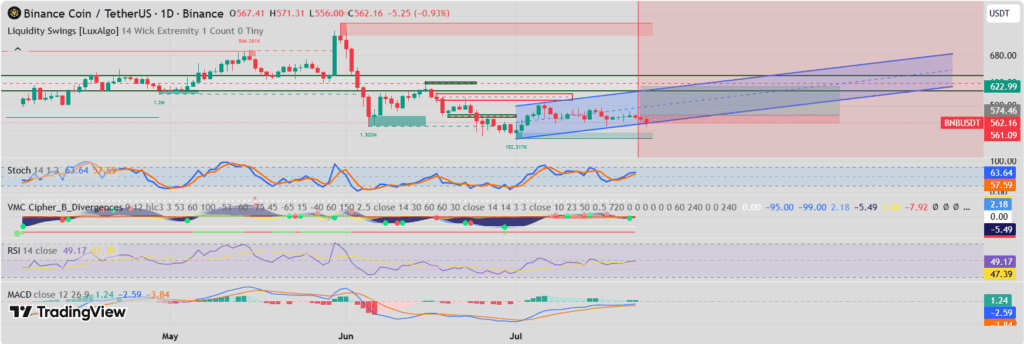
BNB has reached the lower boundary of a well-defined daily parallel channel, a key support level that has historically triggered rebounds. Source: UROSCRYPTOSERB on TradingView
The analyst wrote that a successful defense of the channel could produce a move toward its midline or potentially the upper boundary. At the same time, the setup remains conditional on confirmation from buyers.
"A daily close below the channel would invalidate this setup," the analysis stated.
That distinction is important for the BNB price prediction . A temporary intraday move below support would not necessarily confirm a structural breakdown. A sustained daily close beneath the channel, followed by continued selling, would provide stronger evidence that the support structure has failed.
For now, the lower channel boundary represents the main battleground between buyers attempting to stabilize the market and sellers seeking to extend the prevailing downtrend.
BNB Technical Analysis Shows Bearish Moving Average Alignment
TradingView's technical data presents a significant contrast between momentum oscillators and moving averages.
The moving-average section showed 14 Sell signals, one Neutral signal, and no Buy signals in the cited analysis. Short-term 10- to 30-period moving averages were clustered around $569-$575, while the 50- to 100-period averages extended from approximately $578 to $611.
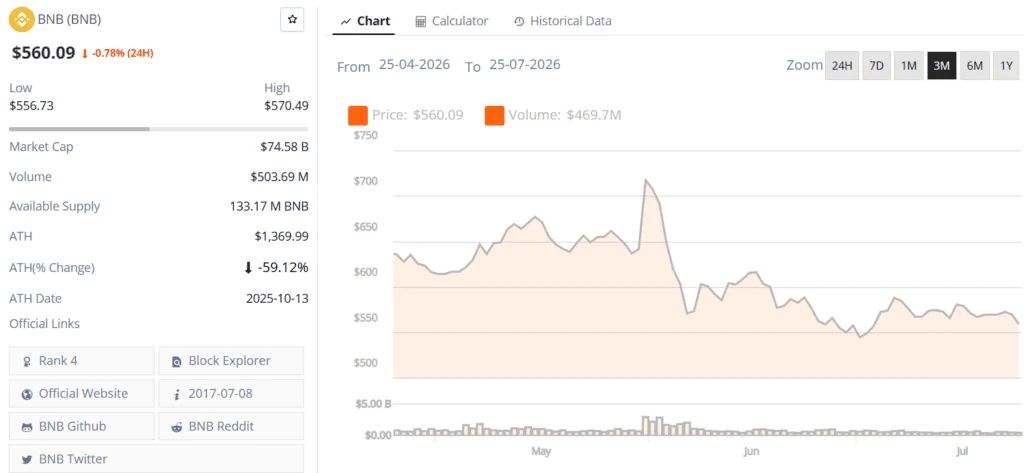
BNB price chart. Source: Brave New Coin
The longer-term 200-period moving average was positioned near $656-$657, considerably above the current market. This creates a wide gap between BNB's present price and its longer-term trend benchmark.
Other technical references were also weak. The 20-period VWMA stood near $574.63, while the 9-period Hull Moving Average was around $566.75, both classified as Sell signals in the cited data. The Ichimoku Base Line at $565.36 was the exception, carrying a Neutral reading.
Taken together, these readings indicate that BNB remains below several important trend thresholds. A sustained recovery above the $570-$580 region would therefore be an early sign that short-term momentum is improving.
Momentum Indicators Leave Room for a Relief Bounce
While the moving averages remain firmly bearish, BNB's oscillators suggest that selling pressure may not be accelerating at the same pace.
The cited technical readings showed RSI (14) at 40.16, below the neutral 50 level but still above the conventional oversold threshold of 30. This points to weakening momentum without confirming an extreme oversold condition.
The Stochastic %K was 34.90, while the Stochastic RSI Fast stood at 12.22. Both readings were classified as Neutral, although the latter was approaching a level where a short-term rebound could become possible if buyers return.
The CCI (20) was -153.50, indicating that BNB was trading well below its recent cyclical average. Meanwhile, the ADX (14) reading of 22.01 suggested moderate trend strength rather than an exceptionally powerful directional move.
Other momentum readings remained negative. The Awesome Oscillator was -0.52, Momentum (10) was -21.87, and MACD (12,26) was -3.79, with each registering a Sell signal in the cited analysis.
The overall oscillator breakdown consisted of three Sell signals, eight Neutral signals, and zero Buy signals, producing a Neutral composite rating. This combination suggests that the market is weak but potentially approaching a stabilization phase rather than displaying an unequivocal momentum collapse.
Could BNB Slide Toward $500?
The $500 level has emerged as the central downside target in several independent technical scenarios.
Analyst MadWhale outlined the possibility of a decline of at least 10% toward $500, pointing to a well-defined parallel trading range that has developed over recent weeks. The analysis also raised the possibility that the range could evolve into a descending channel.
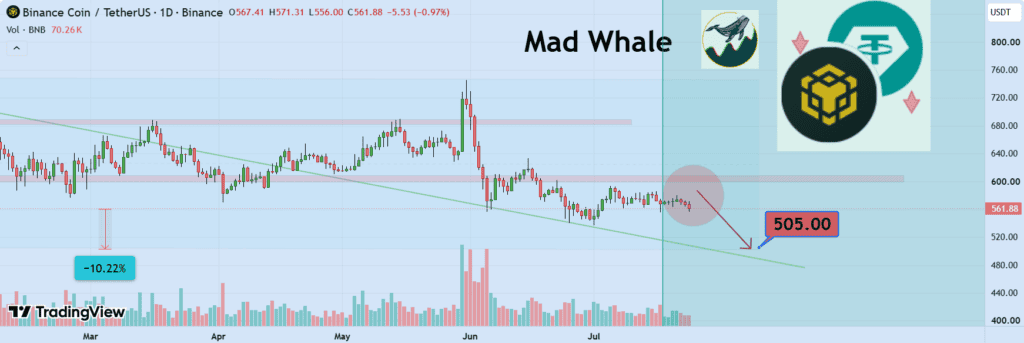
BNB could face a short-term decline of around 10%, potentially pushing its price toward the $500 level amid broader market weakness. Source: MadWhale on TradingView
A move from the mid-$560s toward $500 would represent a decline of roughly 12%, making the target technically significant rather than an immediate extension of only a few percentage points.
The $500 area also carries psychological importance as a round-number support zone. If price approaches that level, traders may look for evidence of renewed demand, particularly if momentum indicators begin to diverge positively from price.
Still, the $500 target should be viewed as a potential technical scenario rather than a confirmed destination. The current chart structure must first lose its nearby support levels before such a move becomes more probable.
Key BNB Support and Resistance Levels to Watch
The immediate support area appears to be concentrated around the recent $540-$560 region, according to the cited technical assessment. This zone is particularly important because it sits close to the current trading range and could determine whether BNB stabilizes or resumes its decline.
Above the market, the $570-$580 area is the first zone bulls need to reclaim. A move through this region would place BNB back above several short-term moving averages and could improve the near-term technical picture.
The next resistance area extends toward $580-$600, where multiple medium-term moving averages converge. A sustained move above that zone would provide stronger evidence that the lower-high sequence is losing momentum.
The classic pivot levels cited in the analysis place the main pivot near $605.56, with R1 at approximately $670.53. On the downside, the calculated S1 sits near $481.56, although these pivot levels appear unusually wide and may be less relevant to immediate price action than the more recent $540-$560 support region.
BNB Price Prediction: Bulls Need Confirmation
The current BNB price prediction remains balanced between a potential technical rebound and the risk of a deeper correction.
The bearish case is supported by the sequence of lower highs, BNB's position beneath most major moving averages, and negative readings from MACD, Momentum, and the Awesome Oscillator. The broader TradingView data also continues to show a Sell rating for the current technical picture and the one-week timeframe, while the one-month rating is Neutral.
The bullish case, meanwhile, rests on the possibility that the daily channel support will hold. RSI at 40.16 and Stochastic RSI Fast at 12.22 indicate that the market is not far from levels where a relief move could develop, although neither indicator alone confirms a trend reversal.
For bulls, the first objective is to defend the channel and reclaim the $570-$580 resistance zone . A stronger recovery above $600-$605 would improve the technical structure further.
Conversely, a confirmed breakdown of channel support followed by a loss of the $540-$560 area could increase the probability of a deeper move. In that scenario, the $500 psychological support level would become a more prominent focus for the BNB price prediction .
At present, the technical evidence points to a market that remains under pressure but is not yet showing a decisive acceleration lower. The next major signal is therefore likely to come from the interaction between BNB's daily channel support and the $570-$580 resistance band. A confirmed breakout or breakdown from that range could provide greater clarity on whether BNB is preparing for a recovery or extending its broader correction.