


The XRP price was recently trading around $1.10-$1.11, according to the market data and chart observations provided in the source material. At that level, XRP remains below several important resistance zones, leaving the market caught between signs of weakening selling pressure and a lack of confirmed bullish momentum.
The setup has gained attention because XRP has formed a series of higher lows while buyers have continued to defend lower support. However, the pattern alone does not guarantee a breakout. Volume, resistance levels, and broader market conditions will likely determine whether the XRP price prediction turns bullish in the near term.
XRP Price Today: Symmetrical Triangle Puts Bulls to the Test
A daily chart analysis shared by @cryptowithgopal identifies a symmetrical triangle developing on the XRP chart. The pattern has emerged following a prolonged decline from XRP's 2025 highs above $3.50.
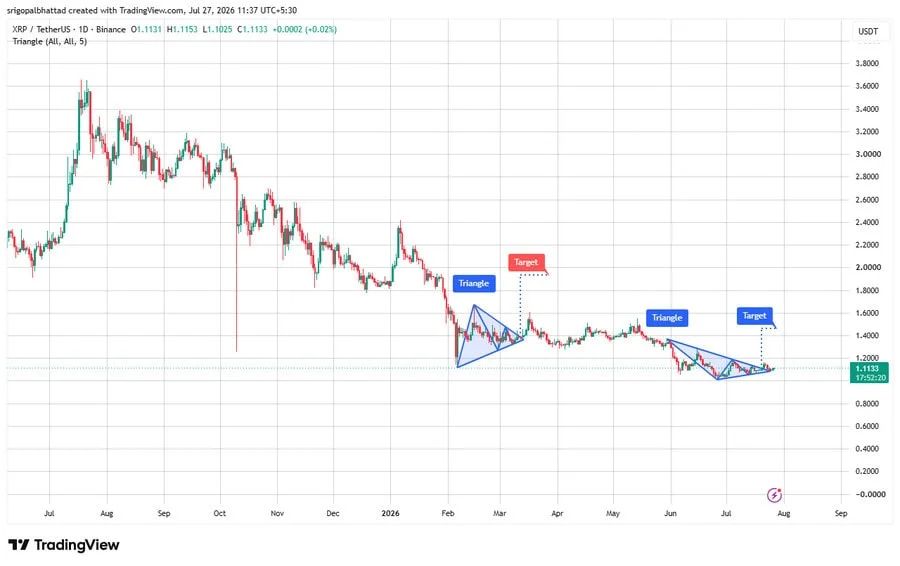
XRP’s daily chart shows a bullish symmetrical triangle, with higher lows, weakening selling pressure, and firm buyer support pointing to tightening volatility ahead of a potential breakout. Source: @cryptowithgopal via X
The formation is characterized by converging trendlines, with sellers becoming less aggressive on declines and buyers defending progressively higher lows. This points to a period of tightening volatility.
A breakout above the triangle's upper boundary could strengthen the recovery case, particularly if the move is accompanied by expanding trading volume. Conversely, a breakdown through the lower trendline would weaken the bullish structure and raise the risk of another period of consolidation.
The technical setup therefore offers a potential roadmap rather than a definitive forecast. XRP must first overcome nearby resistance before the $1.35 target becomes technically relevant.
Key Resistance Levels for XRP
The first major hurdle is the 50-day exponential moving average, which stands near $1.14 in the supplied analysis . This level has repeatedly limited upside attempts and remains an immediate test for buyers.
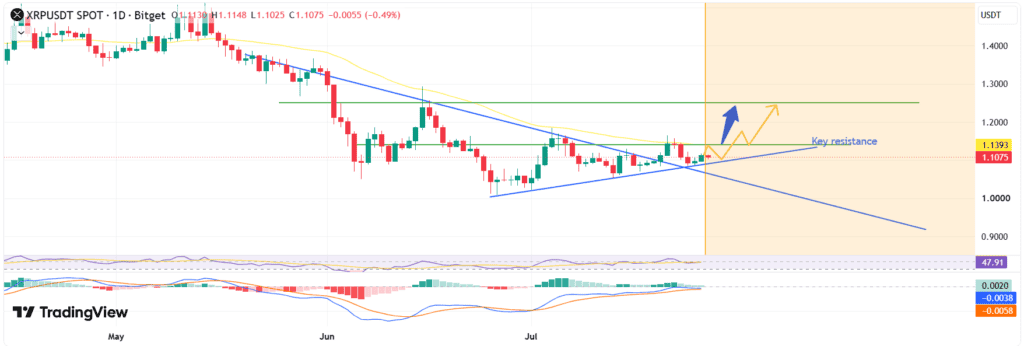
The 50-day EMA at $1.14 remains a key resistance level, with further hurdles at $1.25 and the 50-week EMA near $1.60, which would need to be cleared to strengthen the case for a long-term trend reversal. Source: duydaocoin on TradingView
Above it, XRP faces resistance around $1.25. A sustained move through that area would improve the short-term structure and bring the $1.35 region into focus.
Another analysis identifies $1.1237-$1.1475 as a critical zone. According to readCrypto , XRP needs to reclaim this range and establish it as support to strengthen the case for a new bullish wave.
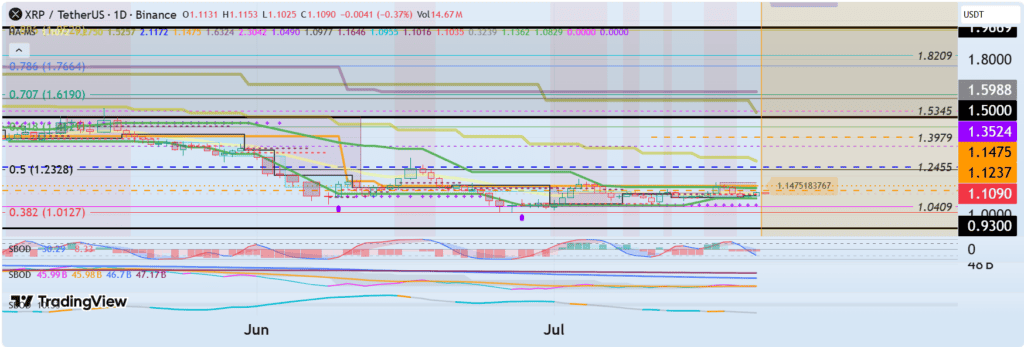
XRP’s bullish outlook could strengthen if it reclaims $1.1237–$1.1475 as support, opening the path toward $1.3524. Source: readCrypto on TradingView
The analysis also highlights $1.3524 as a more important confirmation level. In that framework, a move above $1.35 would represent more than a routine rebound. It would provide stronger evidence that the broader downtrend is beginning to reverse.
However, the longer-term technical picture remains challenging. XRP would still face a major volume-profile resistance area between $1.50 and $1.9669. The 50-week EMA, meanwhile, is identified near $1.60, creating another significant barrier for a sustained recovery.
Momentum Signals Remain Mixed
Momentum indicators currently offer a cautious picture for the current XRP price.
The Relative Strength Index (RSI) is around 47.85, just below the neutral 50 threshold. This suggests that neither buyers nor sellers have established clear dominance. A move above 50 could indicate improving momentum, although it would not by itself confirm a trend reversal.
The MACD also remains mixed. The MACD line is at approximately -0.00333, compared with -0.00618 for the signal line. While the histogram has turned positive, suggesting that selling momentum may be easing, a confirmed bullish crossover has yet to occur.
This combination points to a market that may still need additional confirmation before a sustained advance can be established.
$1.08-$1.10 Support Remains Crucial
On the downside, the $1.08-$1.10 region represents an important demand area for XRP. Holding this zone would allow the triangle structure to remain intact and give buyers more time to challenge resistance.
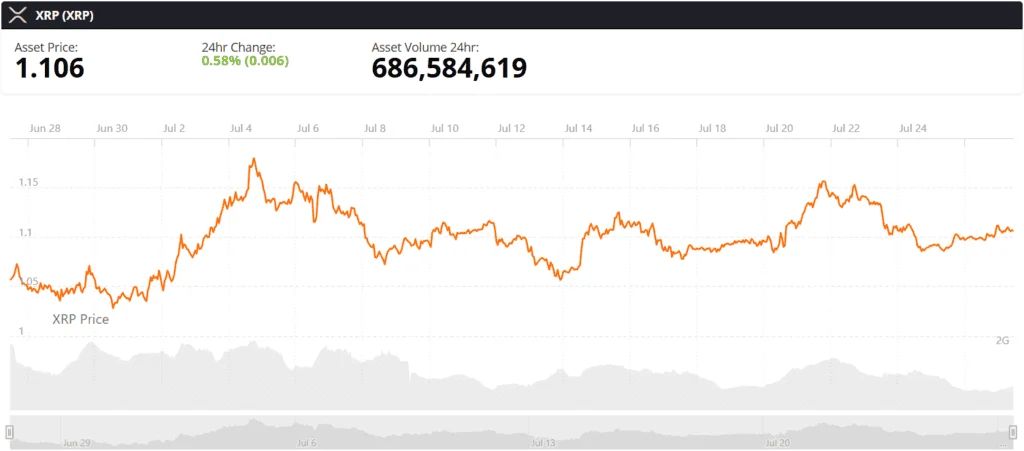
XRP price chart. Source: Brave New Coin
The alternative technical framework places greater emphasis on $0.93 as a mid-to-long-term support level. A decisive break below that threshold could increase the likelihood of an extended consolidation phase and delay any meaningful trend reversal.
The same analysis notes that XRP's On-Balance Volume (OBV) has fallen below its Low Line. This makes a volume-backed recovery particularly important. Without stronger participation, a price rebound could struggle to develop into a durable trend.
XRP Price Forecast 2026: What Could Trigger a Breakout?
For the XRP price forecast 2026 , the immediate question is whether buyers can convert the current consolidation into a confirmed breakout.
A bullish scenario would involve XRP reclaiming the $1.1237-$1.1475 region, holding it as support and then advancing toward $1.25. A move above $1.3524 would provide stronger technical evidence of a trend reversal and could shift attention toward the $1.50-$1.60 resistance area.
The bearish scenario would emerge if XRP repeatedly fails to reclaim the $1.1237-$1.1475 zone. In that case, the token could remain range-bound or develop another lower-high structure. A deeper decline below $0.93 would further weaken the medium-term outlook.
This distinction is important because, as the analysis notes, "a simple bounce is not the same as a trend reversal." Confirmation above key resistance remains necessary.
Final Thoughts: A Breakout Needs Confirmation
The current XRP price prediction remains conditional. The symmetrical triangle offers a potentially bullish structure, but the market has yet to confirm an upside resolution.
For bulls, the first objective is to reclaim and hold $1.1237-$1.1475, followed by a sustained move through $1.25. A breakout above $1.3524 would represent a more meaningful technical development and could open the way toward the $1.50-$1.60 region.
Until those levels are cleared with convincing momentum and volume, XRP remains in a confirmation phase. The $1.08-$1.10 area is the immediate support to watch, while $0.93 represents a more significant downside threshold.
As a result, the potential move toward $1.35 is technically plausible if the triangle breaks higher, but the chart currently points to a level-by-level recovery rather than a confirmed bullish reversal.