

The warning comes as the Zcash price remains firmly above its major moving averages, leaving the market caught between strong longer-term momentum and increasingly stretched short-term conditions. Recent price data shows how quickly the trend has accelerated, with ZEC closing at $1,227.60 on September 6 after gaining nearly 20% in one session and reaching $1,294.36 on September 9.
TD9 Signal Raises Pullback Risk
A TD Sequential count of 9 has appeared on Zcash's three-day chart around the $1,222 level, according to analysis shared by @alicharts. The signal follows an unusually strong advance from below $400, placing the current price substantially above the levels where the latest rally began.
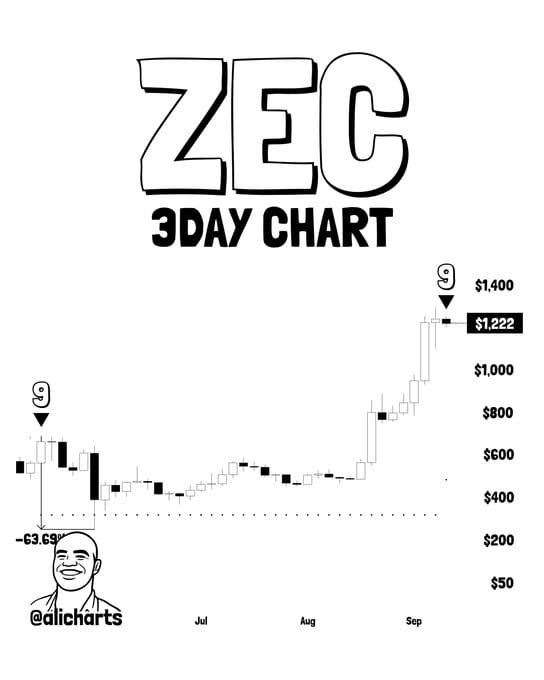
Zcash’s three-day chart has flashed a TD Sequential sell signal, with the previous May 19 setup followed by a 64% correction. Ali Martinez via X
The TD Sequential indicator is designed to identify potential exhaustion in established price moves. A completed sell setup does not guarantee that a decline will follow, but it can become more significant when it appears after an extended advance and alongside other weakening momentum signals.
The historical comparison highlighted by the analysis is particularly notable. A similar TD Sequential setup appeared on May 19 and was followed by a decline of approximately 64%, with the referenced chart marking a 63.69% drop. That historical move does not establish a fixed pattern for the current market, but it provides context for why traders may be monitoring the present TD9 signal closely.
ZEC's recent price action supports the argument that volatility has increased considerably. Binance data shows the token moved from a September 2 close near $815 to more than $1,227 by September 6, while September 9 saw a daily high of roughly $1,294.
Bearish Divergence Adds a Second Warning
The TD Sequential signal is not the only technical concern. A separate TradingView analysis by Cryptoraclero identifies a bearish divergence on the four-hour chart, accompanied by a strong sell signal.
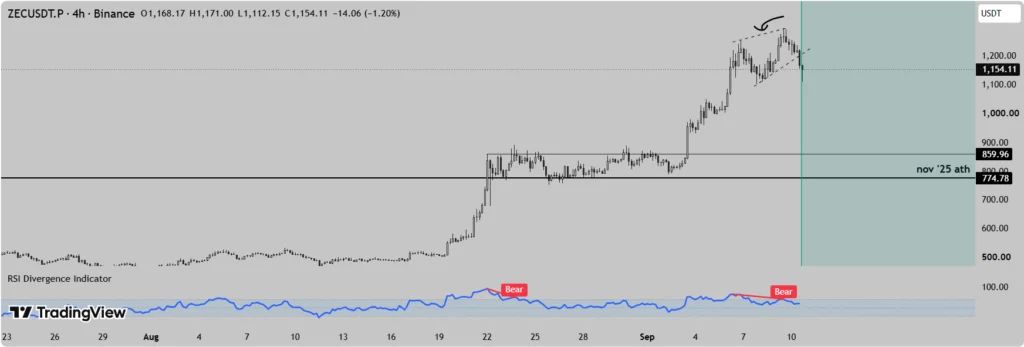
A four-hour bearish divergence has emerged on ZEC alongside a strong sell signal, with a confirmed break and close below the uptrend line needed to strengthen the bearish setup. Source: Cryptoraclero on TradingView
The analyst wrote that the setup had previously been associated with declines of around 9% and 20%. The analysis also identifies the rising trendline as an important confirmation level, arguing that a break below the trendline followed by a close beneath it would strengthen the bearish case.
Bearish divergence generally occurs when price continues to establish higher highs while an underlying momentum indicator fails to confirm those highs. It can indicate that buying momentum is weakening even though the broader price structure remains positive.
For ZEC , that distinction is important. A bearish divergence by itself does not establish that the longer-term trend has reversed. Instead, it suggests that the pace of the recent advance may be difficult to sustain without a period of consolidation or a deeper retracement.
ZEC Technical Indicators Remain Mixed
TradingView's technical readings present a divided picture. ZEC was recently quoted around $1,218.65 on Coinbase in the supplied analysis, while current market data has kept the token above $1,200 despite substantial intraday volatility.
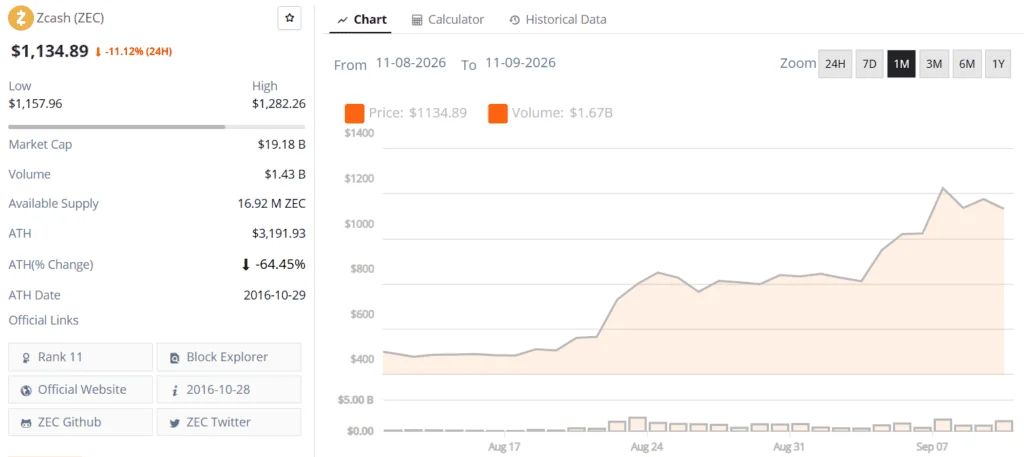
Zcash (ZEC) price chart. Source: Brave New Coin
The oscillator group is tilted toward caution. The Relative Strength Index (RSI) stood at 75.84, above the conventional 70 threshold generally associated with overbought conditions. The Commodity Channel Index (CCI) was 135.08, while Momentum stood at 370.90 and Williams %R at -15.26. All four were producing sell readings in the referenced TradingView snapshot.
At the same time, the MACD remained constructive at 155.89 and was classified as a buy signal. Other indicators, including Stochastic %K at 86.46, ADX at 59.51, Awesome Oscillator at 426.22, Stochastic RSI Fast at 51.31, Bull Bear Power at 368.42, and Ultimate Oscillator at 62.67, were classified as neutral.
That combination explains why the broader technical gauge remained neutral rather than decisively bearish. Short-term oscillators are signaling that ZEC has become stretched, while trend-following indicators continue to reflect the strength of the underlying advance.
Moving Averages Keep the Broader Trend Bullish
The moving-average structure provides a stronger counterweight to the bearish signals.
The 10-day EMA was positioned at $1,090.97, while the 20-day EMA stood at $961.50. The 30-day EMA was $873.55 and the 50-day EMA was $765.56. Longer-term averages were substantially lower, with the 100-day EMA at $638.90 and the 200-day EMA at $526.24.
The corresponding simple moving averages also remained below the market. The SMA 20 was $943.05, SMA 50 was $679.55, SMA 100 was $573.67, and SMA 200 was $468.59. The 20-day VWMA was $951.25.
These readings indicate that ZEC is still trading well above its trend averages. The separation is evidence of the scale of the recent rally, but it also means the market has become increasingly extended relative to its previous trading range.
The Ichimoku Base Line at $890.70 remained neutral, while the Hull Moving Average at $1,267.17 generated a sell signal. With 13 moving-average readings classified as buy signals against one sell and one neutral reading, the moving-average structure continues to favor the broader uptrend.
Bull Flag Could Keep Zcash Price Prediction Bullish
Not all technical evidence points toward a correction. TradingView analyst VincePrince argues that Zcash has completed a large descending-triangle formation and subsequently produced a strong bullish breakout.
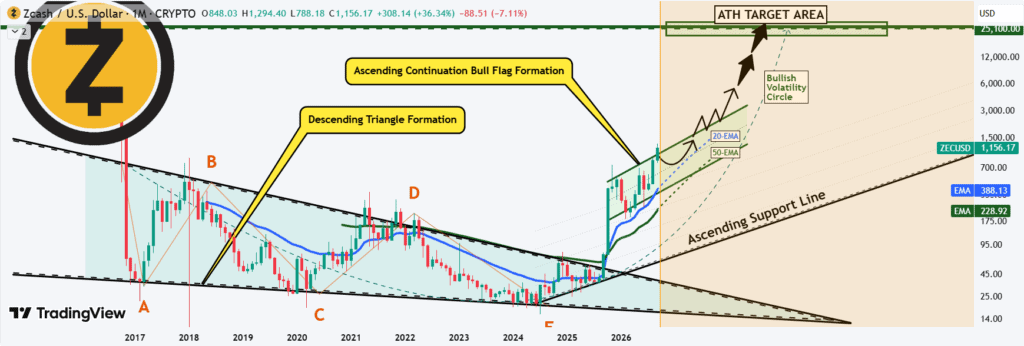
A four-hour bearish divergence has emerged on ZEC alongside a strong sell signal, with a confirmed break and close below the uptrend line needed to strengthen the bearish setup. Source: VincePrince on TradingView
According to the analysis , Zcash has moved above its exponential moving averages and is now developing a bull-flag structure. The analyst described the broader setup as having “continuation potential,” with a further breakout above the upper boundary of the flag potentially opening the way toward higher target zones.
This creates an important technical distinction. A pullback from current levels would not automatically invalidate the broader bullish structure. If ZEC remains above important moving averages and holds the breakout area, a correction could instead represent consolidation within a larger uptrend.
Market data illustrates how strong that trend has been. Zcash price closed around $829.82 on September 1 and reached approximately $1,245.71 by September 10 in Binance-based data, representing a gain of roughly 50% over that period.
Zcash Price Levels to Watch
Pivot calculations provide several reference points for assessing whether a pullback remains contained or develops into a deeper correction.
The classic central pivot in the supplied TradingView analysis is $730.90. Resistance levels are positioned at $1,004.42, $1,161.51 and $1,592.12, while support levels are located at $573.81 and $300.29.
Fibonacci pivot calculations place resistance around $895.40, $997.02, and $1,161.51. Several Camarilla, Woodie, and DeMark levels cluster between roughly $886 and $1,082 on the upside and $631-$807 on the downside.
Because ZEC has moved above many of these traditional resistance levels, former resistance areas could become relevant support zones if the market retraces. The $1,161 area is particularly notable because it appears in both the classic and Fibonacci pivot calculations.
A sustained move below the nearby support cluster would provide more evidence that the market is entering a broader correction. Conversely, a recovery above the recent highs would weaken the immediate bearish argument and keep the breakout structure intact.
ZEC Outlook Remains Divided
The technical picture is therefore not a straightforward bearish reversal. The TD9 sell signal and four-hour bearish divergence indicate that momentum could be losing strength near $1,200-$1,300. Elevated RSI and CCI readings reinforce short-term caution.
However, the broader trend remains constructive. ZEC is trading substantially above its short-, medium-, and long-term moving averages, while recent price data shows the cryptocurrency continuing to hold well above the levels recorded at the start of September.
Zcash also retains its distinctive position as a privacy-focused cryptocurrency. The Zcash protocol supports both transparent and shielded transactions, with shielded transactions designed to keep addresses, transaction amounts, and memo information private.
The network has a maximum supply of 21 million ZEC, according to Zcash's official documentation.
For the current Zcash price prediction , the key issue is whether the emerging reversal signals develop into confirmed price weakness or simply accompany a period of consolidation following an unusually fast rally. A break below the relevant uptrend structure would strengthen the bearish case, while sustained trading above recent breakout levels would preserve the broader bullish setup.
The technical indicators alone do not establish a guaranteed price direction. Instead, they show a market in which strong trend conditions are increasingly being accompanied by signs of short-term exhaustion, making the $1,200-$1,300 region an important area for ZEC price discovery .