


The latest Zcash price rally has kept attention on whether the recent bullish pennant breakout can support another advance toward $1,800.
ZEC traded around $1,492 on September 22, down roughly 0.18% over 24 hours, after reaching an intraday high near $1,569. The token was still up more than 70% over the previous 30 days, according to ZecStats data, highlighting the scale of the recent move.
Zcash Price Holds Above Key Breakout Levels
The recent advance follows a powerful September rally. ZEC closed near $953 on September 3 and subsequently moved above $1,000 before accelerating toward $1,250 and then beyond $1,500. CoinGecko data shows Zcash closing at $1,336.55 on September 16 and $1,562.22 on September 18, illustrating how quickly momentum strengthened during the second half of the month.
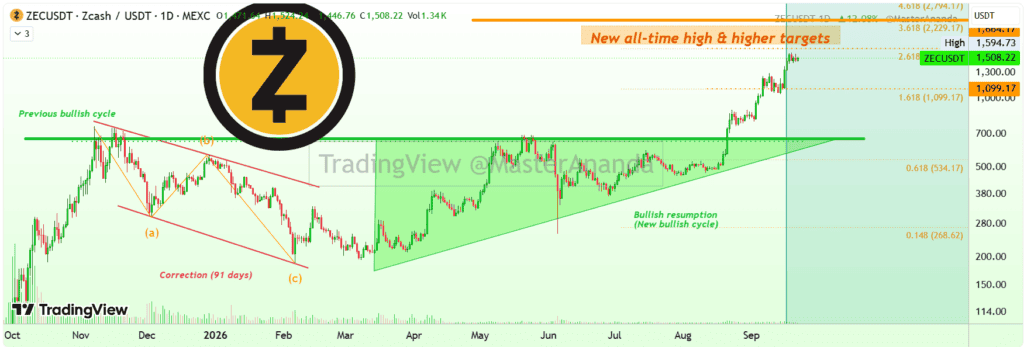
ZEC remains in price discovery, with the next target just below $1,700 and a mid-term target around $2,200. Source: MasterAnanda on TradingView
Earlier analysis identified the move above $1,000 as a breakout from a bullish pennant formation. Crypto.news reported in early September that the pattern had already produced an initial $1,000 objective, with analysts subsequently watching $1,500 as the next technical target.
The latest price action has extended well beyond those initial levels. However, the retreat from the recent high means traders now have to assess whether the market is consolidating after an extended rally or beginning a deeper correction.
A TradingView analysis by MasterAnanda highlighted the $1,100 area as an important Fibonacci level. The analysis identified it as the 1.618 extension and noted that Zcash had previously found support around that zone following its advance.
The analyst wrote that, as long as ZEC remains above $1,000, the broader setup remains bullish. That level is important because it also represents the region where the earlier breakout gained traction.
Bullish Pennant Breakout Targets $1,800
The bullish pennant remains central to the Zcash price prediction because the formation preceded the latest acceleration. A sustained move above the recent resistance structure could extend the measured move from the pattern.
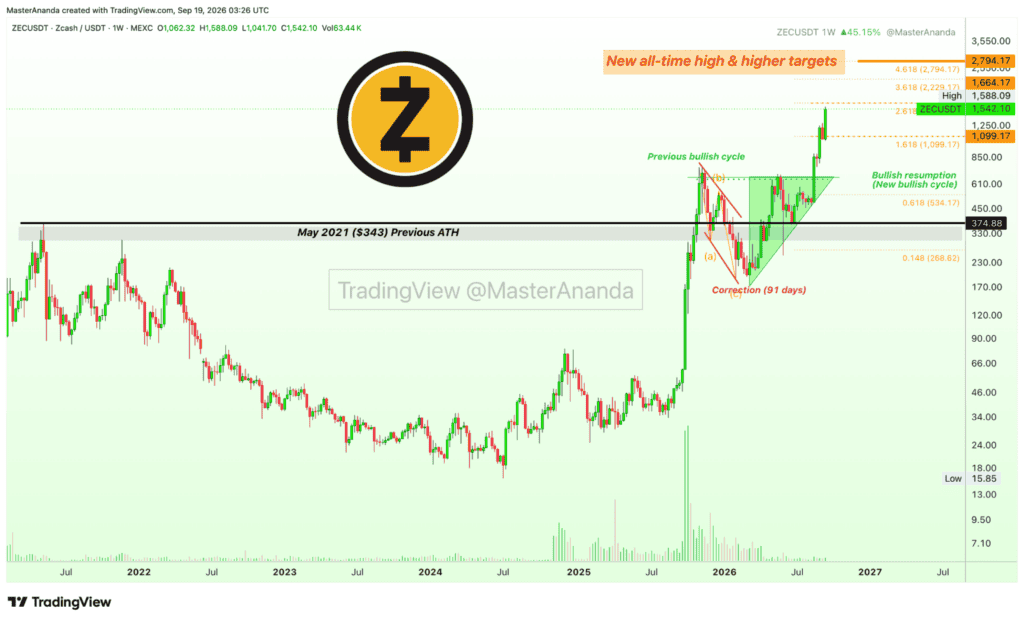
On the weekly chart, ZEC found support at its May 2021 all-time high before resuming its bullish trend and reaching a new all-time high. Source: MasterAnanda on TradingView
More recent technical levels place immediate resistance around $1,560-$1,585. The zone combines the recent swing highs with the upper boundary of the daily Bollinger Bands described in the supplied analysis.
A daily close above approximately $1,582 would strengthen the technical case for another leg higher. Beyond that level, the next areas discussed by recent market analysis extend toward $1,700-$1,850.
That puts $1,800 within the broader technical range rather than treating it as a guaranteed price target.
The distinction is important after such a rapid rally. Zcash has already moved substantially above its short-, medium-, and long-term moving averages, meaning another breakout would need to overcome both resistance and the risk of profit-taking.
Zcash Price Prediction: $1,585 Resistance in Focus
The $1,560-$1,585 region is currently one of the most important areas on the ZEC/USD chart.
ZEC reached approximately $1,592-$1,595 on September 19 across market data sources before retreating. It then recovered toward $1,534 on September 20 and briefly reached around $1,570 on September 21. The repeated tests of this area indicate that sellers remain active around the recent highs.
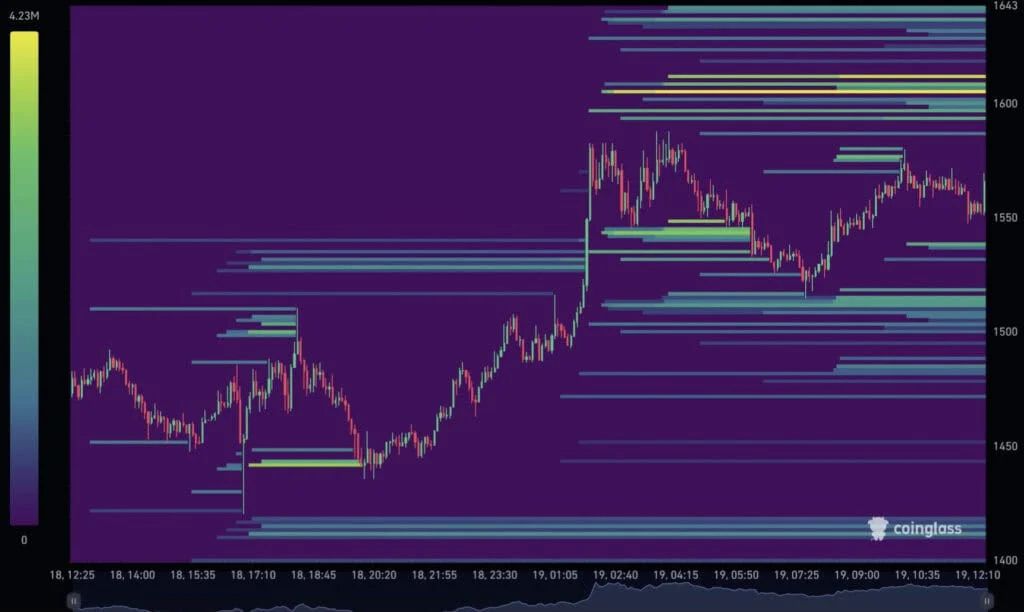
The Coinglass liquidation heatmap shows peak short liquidity stacked at $1,605-1,610 as the brightest resistance zone. Source: @dxttools via X
The next resistance area sits around $1,600-$1,615. Crypto analyst @dxttools previously highlighted $1,605-$1,610 as the brightest short-liquidation zone on the Coinglass heatmap, with additional liquidity around $1,625 and $1,643.
Those levels could become relevant if Zcash moves back above $1,600. A sustained break would place the market into a less-tested price area, potentially leaving $1,700 and $1,800 as the next technical zones to monitor.
However, a move into these levels would also occur after a substantial rally, so the amount of leverage in the market could influence the pace and volatility of any breakout.
Technical Indicators Remain Constructive
The broader daily technical structure remains positive.
The supplied analysis shows ZEC trading significantly above its major moving averages. The 10-day SMA and EMA are positioned around $1,360-$1,387, while the 20-day averages sit near $1,230-$1,250. Longer-term averages remain considerably lower, including the 50-day, 100-day, and 200-day measures.
This configuration indicates that the recent advance is not limited to a single short-term price spike. ZEC has established a substantial distance above its longer-term trend indicators.
Momentum indicators also remain supportive. The daily MACD is positive, while the Average Directional Index is around 57 in the cited analysis. An elevated ADX generally indicates a strong trend, although it does not determine whether the next move will be higher or lower.
The Ichimoku structure and SuperTrend are also described as supportive, with the SuperTrend level around $1,158 providing a potential dynamic support reference.
At the same time, short-term momentum has become stretched.
Overbought Signals Raise Pullback Risk
Several daily oscillators are showing elevated readings after Zcash's rapid advance.
The RSI is around 67-70, approaching the overbought threshold without reaching an extreme reading. The Stochastic oscillator is already above 80, while the Commodity Channel Index is above +100. Williams %R is also positioned near the upper end of its recent range.
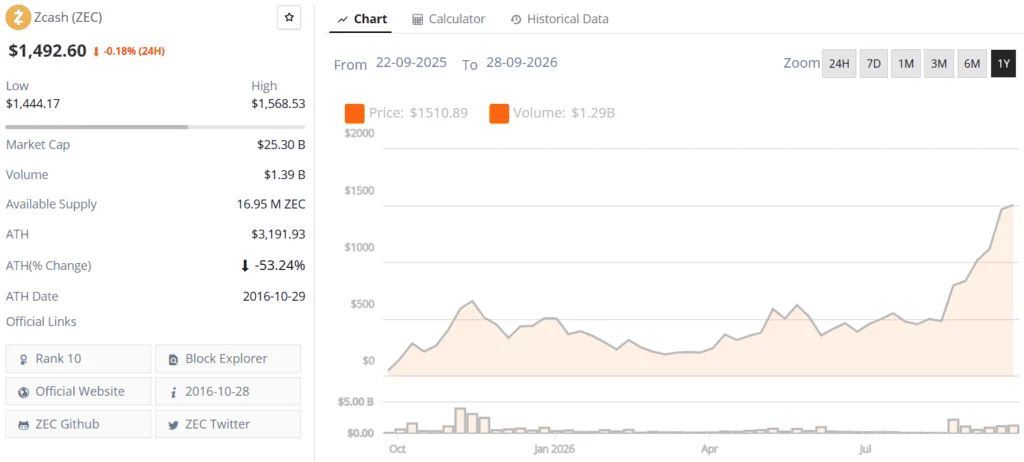
Zcash (ZEC) price chart. Source: Brave New Coin
These readings do not automatically indicate that the Zcash rally has ended. Instead, they show that the token has moved quickly and that consolidation or a pullback could occur before another sustained advance.
The recent price history illustrates that volatility clearly. Zcash price closed at $1,562.22 on September 18, fell 5.8% the following day, recovered 2.5% on September 20, and then declined another 2.5% on September 21, according to Investing.com data.
Such swings are significant when assessing a potential move toward $1,800. A breakout accompanied by strong spot demand could produce another advance, while a failure at resistance could instead result in a deeper consolidation.
ZEC Support Levels to Watch
The first important support zone is around $1,430-$1,450.
ZEC recently found buyers near this region, with the September 21 low around $1,444 across several market data sources. The area therefore represents an immediate test if selling pressure continues.
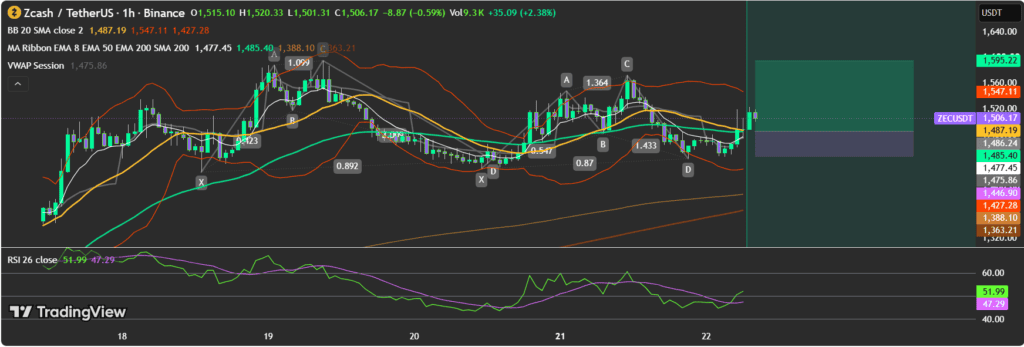
ZEC maintains the overall bullish momentum following the $1,500 breakout. Source: EldenLordX3773 on TradingView
A break below approximately $1,434 would weaken the immediate bullish structure and expose the $1,230-$1,250 region, where the 20-day moving averages are located.
Further down, the $1,050-$1,100 area carries greater structural significance. The zone previously acted as a breakout and consolidation area and also overlaps with the Fibonacci level highlighted in the TradingView analysis.
That creates a clear distinction between short-term and broader trend support. Holding $1,430-$1,450 would preserve the current consolidation structure, while a deeper move toward $1,100 would represent a much larger retracement from the recent highs.
Can ZEC Reach $1,800?
The technical setup provides a potential route toward $1,800, but several conditions would need to align.
First, ZEC would need to reclaim the $1,560-$1,585 resistance zone. A sustained daily close above that region would provide stronger evidence that the recent consolidation is resolving higher.
The next hurdle would be the $1,600-$1,615 area highlighted by the liquidation data. Above it, $1,700 becomes an important intermediate level before the broader $1,800-$1,850 region.
The bullish pennant breakout therefore remains relevant to the Zcash price prediction , but the pattern alone does not establish that ZEC will reach $1,800. Price confirmation, trading volume, and the behavior of leveraged positions would provide additional evidence.
Conversely, a rejection around $1,560-$1,615 followed by a break below $1,430 would weaken the immediate bullish structure. A move below $1,250 would signal a more substantial deterioration in the short-term setup.
For now, ZEC remains substantially above its major moving averages and has posted one of the strongest multi-week advances in the crypto market. ZecStats data showed Zcash up about 71% over 30 days as of September 22, compared with much smaller gains for Bitcoin and Ethereum over the same period.
The $1,800 level therefore sits within the current technical upside framework, but the market must first clear the $1,585 and $1,615 resistance areas. Meanwhile, $1,430-$1,450 remains the first support zone to watch if the latest pullback develops into a broader correction.