


The supply reduction supports BNB’s long-term deflationary design, but the price must overcome resistance to strengthen the bullish outlook.
BNB traded around $730–$745 in late October 2026 after briefly testing the $750 area. Technical analysts are watching whether the token can break above the upper boundary of its multi-month range or retreat toward lower support levels. The recent burn adds a fundamental development to that chart-based debate, although it does not guarantee an immediate price increase.
BNB’s $1.2 Billion Token Burn Reduces Supply
BNB Chain completed its 37th quarterly auto-burn on October 19, permanently removing 1,646,196.44 BNB valued at approximately $1.197 billion at the time of the announcement. The BNB Foundation reported that the remaining total supply stood at 131,512,085 tokens.
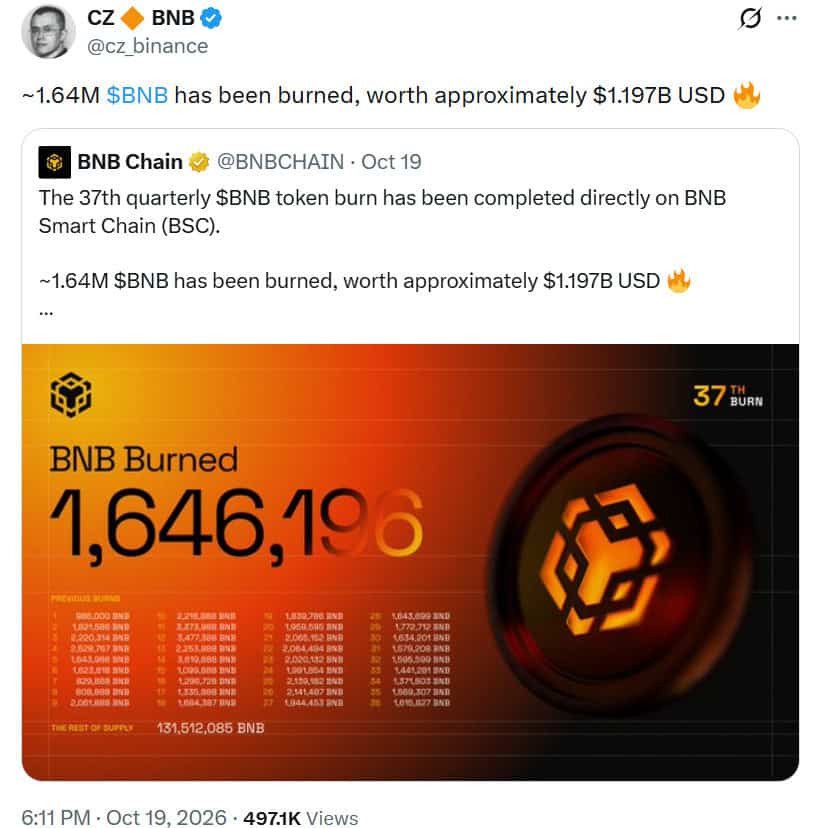
CZ reposted BNB Chain's announcement of the 37th quarterly auto-burn, confirming 1,646,196 BNB tokens valued at approximately $1.197 billion were permanently removed from circulation. Source: @cz_binance via X
The burn is part of BNB’s long-term plan to reduce its total supply to 100 million tokens. The Auto-Burn mechanism calculates the amount removed using factors that include BNB’s price and block production on BNB Smart Chain. The tokens are sent to an inaccessible burn address, taking them out of circulation.
However, the $1.2 billion valuation does not represent fresh buying or money spent on a market buyback. The dollar figure reflects the estimated value of the tokens at the time of the burn. CryptoSlate reported that the number of tokens removed increased by approximately 1.9% compared with the July burn, while the reported dollar value rose by 28.5%, largely reflecting the higher implied value per token.
The reduction in supply supports BNB’s deflationary design, but its effect on market price depends on demand, trading activity, and selling pressure. The burn alone does not establish that buyers are entering the market or that BNB will break through resistance.
$750 Resistance Becomes the Key BNB Price Level
Market analyst Alex Marzell has identified the $750 area as a critical level for BNB, describing it as a potential “make or break zone” near the top of the token’s multi-month trading range.
A sustained move above this area could strengthen the case for a recovery toward previous highs and potentially new all-time highs. Such a move would need confirmation from continued buying pressure and follow-through rather than a brief intraday spike.
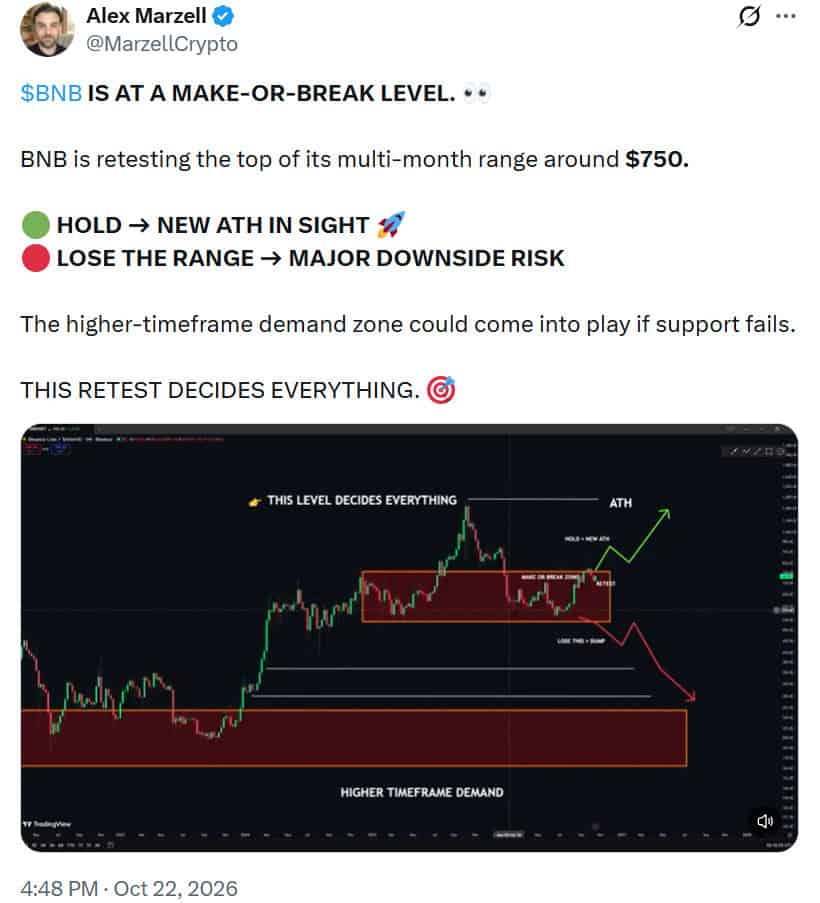
BNB is retesting key resistance near $750, with a hold potentially paving the way to new all-time highs, while a breakdown could trigger a decline toward a higher-timeframe demand zone. Source: @MarzellCrypto via X
Recent market data reinforces the importance of this threshold. On October 22, technical analysis placed immediate resistance near $752.78, with support around $722.52. The daily relative strength index (RSI) was approximately 45, indicating that momentum remained below the neutral 50 level rather than showing strong bullish conviction.
For the bullish scenario to gain traction, the price would need to reclaim the $750–$753 region and sustain trading above it. A confirmed breakout could open the way toward the next resistance areas, although the price would still face potential selling pressure as it approaches higher levels.
Failure to clear resistance would leave BNB vulnerable to another pullback within its broader range. The token’s reaction around $750 is therefore more important than the burn’s headline valuation when assessing its immediate technical direction.
BNB Price Forecast: Can the $680–$695 Demand Zone Hold?
Analyst TokenTalk3x has highlighted the $680–$695 region as a potential demand zone if BNB retreats from current levels. The area is being monitored as a possible location for buyers to return, rather than a confirmed price floor.
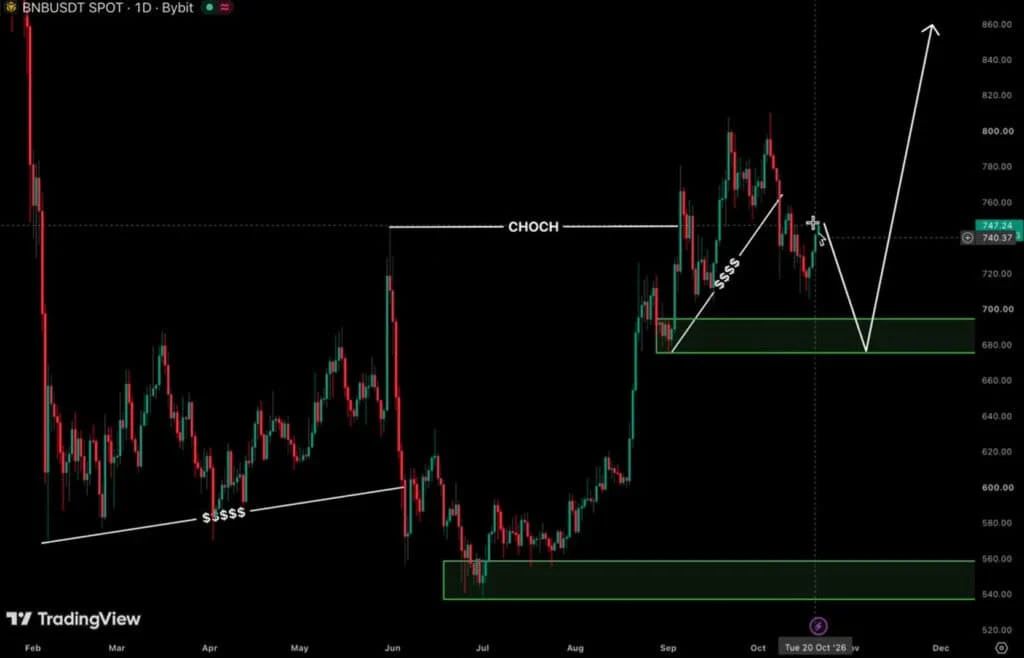
BNB’s $680–$695 demand zone could offer an accumulation opportunity during pullbacks, despite traders’ tendency to favor rallies over dips. Source: @TokenTalk3x via X
The analysis identifies a Change of Character (CHoCH), a technical term used to describe a possible shift in market structure. If the price pulls back into the highlighted zone and rebounds with stronger buying activity, the chart setup points to a possible recovery toward $850.
That target remains conditional. Traders would need to see evidence that buyers are defending the zone, such as a clear price reaction and improving momentum. A decline through the area could instead expose lower support levels.
The setup also highlights a common difference between trading a breakout and buying a pullback. Chasing a sharp upward move can leave traders entering close to resistance, while waiting for a retracement may offer a clearer level for evaluating risk. Neither approach guarantees a profitable outcome.
Head-and-Shoulders Pattern Raises Risk of a Deeper BNB Correction
A separate daily-chart analysis by TradingView contributor AnhbaCong_ presents a more bearish interpretation. The analyst suggests BNB may be forming a head-and-shoulders reversal pattern, with the head near $815 and the neckline around $700.
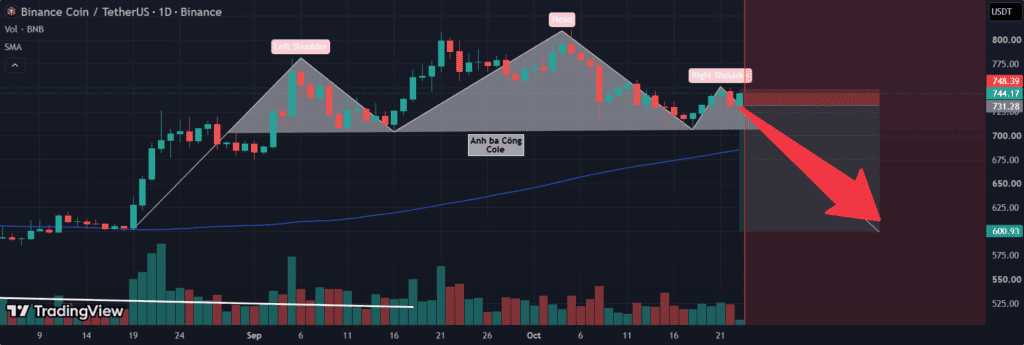
BNB is nearing completion of a daily head-and-shoulders reversal pattern, with the right shoulder forming around $745–$750 after a decline from the $815 peak toward the $700 neckline. Source: AnhbaCong_ on TradingView
In this formation, the right shoulder has developed near $745–$750. The analysis points to rejection around $748 and a subsequent retreat toward $730 as evidence that sellers remain active near resistance. It also identifies declining volume during the right-shoulder formation as a potential sign of weakening buying participation.
The bearish scenario would gain credibility if the price breaks below the $700 neckline with sustained selling pressure. The analyst identifies $600 as a potential downside objective if the pattern is confirmed. However, the formation is not complete simply because the price has retreated from resistance, and a move above the right shoulder could weaken the bearish interpretation.
The analysis also outlines an early short setup with a stop-loss above $748.39. That is the contributor’s trading strategy, not an established market outcome. Attempting to anticipate a breakdown before confirmation carries additional risk if BNB instead recovers above resistance.
The contrasting projections illustrate why the $700 and $750 levels matter. A breakout above resistance would weaken the immediate bearish case, while a confirmed neckline breakdown would increase the risk of a more substantial correction.
BNB Price Outlook: What Comes Next?
BNB’s outlook rests on the interaction between supply reduction and price action. The October burn permanently removed more than 1.64 million tokens, but the market has yet to demonstrate that this development will be enough to push the price above its immediate resistance zone.
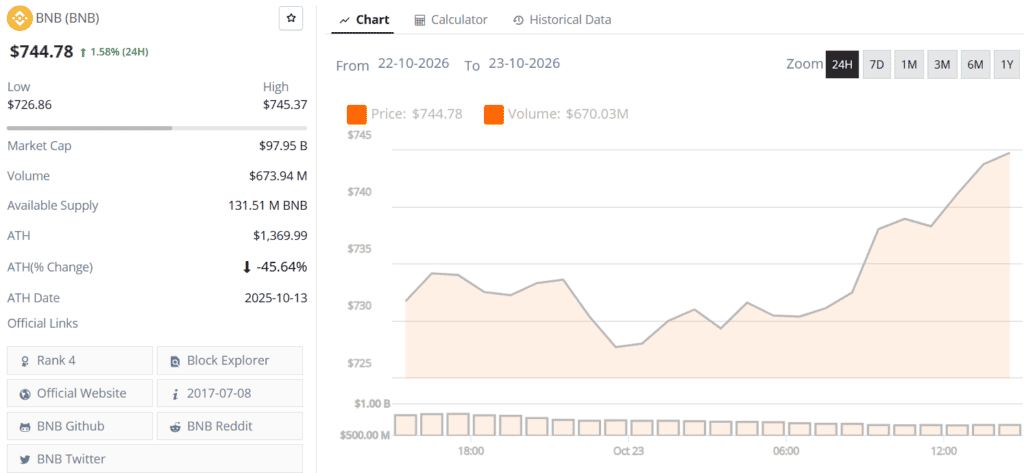
BNB price chart. Source: Brave New Coin
The bullish scenario requires a sustained break above $750–$753, which could bring higher resistance levels and the $850 target identified in one technical analysis into focus. The bearish scenario involves rejection near resistance followed by a break below $700, potentially strengthening the case for a deeper retracement.
Between those levels, the $680–$695 demand zone remains an area to watch for evidence of renewed buying. RSI readings near neutral territory and conflicting chart patterns suggest that a decisive move has yet to be established.
For now, the $1.2 billion BNB burn provides a long-term supply narrative, while resistance near $750 remains the immediate technical test. A confirmed breakout or breakdown would offer stronger evidence of the n ext directional move than the burn announcement alone.