

Darden Restaurants, Inc. DRI reported first-quarter fiscal 2027 results, with earnings and revenues missing the Zacks Consensus Estimate. However, the top and bottom lines increased on a year-over-year basis.
The quarter benefited from a blended same-restaurant sales increase of 3.1% on a fiscal-calendar basis, with all four segments delivering positive same-restaurant sales. The company ended the quarter with 2,218 company-owned restaurants in continuing operations.
Following the results, the stock inched down 5% in today's pre-market trading session, likely reflecting the earnings and revenue misses and lower operating income despite the reaffirmed fiscal 2027 outlook.
DRI's Q1 Earnings & Revenues
During the fiscal first quarter, Darden reported adjusted earnings per share (EPS) of $2.05, which missed the Zacks Consensus Estimate of $2.06. In the prior-year quarter, DRI reported adjusted EPS of $1.97.
Darden Restaurants, Inc. Price, Consensus and EPS Surprise
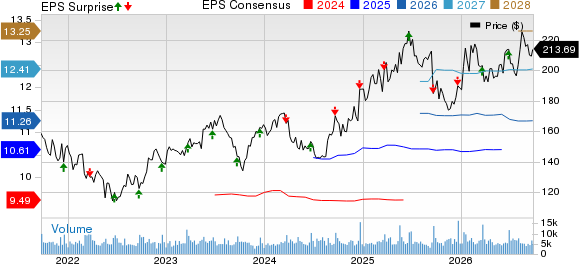
Darden Restaurants, Inc. price-consensus-eps-surprise-chart | Darden Restaurants, Inc. Quote
Total sales during the quarter were $3.20 billion, missing the consensus mark of $3.21 billion. Sales increased 5.1% from the prior-year quarter's level of $3.04 billion.
DRI's Sales by Segments
Darden reports business under four segments — Olive Garden, LongHorn Steakhouse, Fine Dining and Other Business. Due to the transition from a 53-week to a 52-week fiscal year, year-over-year fiscal-period comparisons are offset by one week. Consolidated same-restaurant sales increased 3.2% on a comparable-calendar basis.
During the fiscal first quarter, sales at Olive Garden increased 2.2% year over year to $1.33 billion. Our estimate for the metric was $1.38 billion. Same-restaurant sales in the segment increased 1.1% on a fiscal-calendar basis and 1% on a comparable-calendar basis.
At LongHorn Steakhouse, sales were up 10.9% year over year to $860.9 million. Our estimate for the metric was $844.5 million. Same-restaurant sales in the segment rose 6.2% on a fiscal-calendar basis and 6.8% on a comparable-calendar basis.
Sales in Fine Dining increased 6.2% year over year to $304.2 million. Our estimate for the metric was $300.6 million. Same-restaurant sales in the segment rose 1.6% on a fiscal-calendar basis and 1% on a comparable-calendar basis.
Sales in Other Business increased 3.6% year over year to $705.4 million. Our estimate for the metric was $672.7 million. Same-restaurant sales in the segment rose 3.8% on a fiscal-calendar basis and 4.5% on a comparable-calendar basis.
DRI's Q1 Operating Highlights
In the fiscal first quarter, total operating costs and expenses increased 6.5% year over year to $2.88 billion. This increase was primarily due to higher food and beverage costs, restaurant labor expenses, restaurant expenses, marketing expenses, pre-opening costs and depreciation and amortization.
Operating income decreased to $319.3 million from $339.2 million reported in the prior-year quarter. The year-ago period included a $42 million gain on the Olive Garden Canada sale. Adjusted earnings per share from continuing operations increased 4.1% year over year to $2.05.
Darden's Balance Sheet
As of Aug. 30, 2026, cash and cash equivalents were $220.5 million compared with $219.5 million as of May 31, 2026.
Inventories were $321 million compared with $326.3 million at the end of fiscal 2026. Long-term debt was $1.64 billion, largely unchanged from the level of May 31, 2026.
During the quarter, the company repurchased approximately 1.1 million shares for $222.3 million. Darden had $1.3 billion remaining under its $1.5 billion share repurchase authorization. The company also declared a quarterly cash dividend of $1.62 per share.
Darden's Fiscal 2027 Outlook
For fiscal 2027, the company reaffirmed its full-year financial outlook. Darden expects total sales in the range of $13.60-$13.75 billion. Same-restaurant sales growth is anticipated to be between 2.5% and 3.5%.
Darden expects to open 75-80 new restaurants and incur total capital spending of approximately $875 million. The company projects earnings per share from continuing operations between $11.10 and $11.35, EBITDA in the range of $2.26-$2.29 billion, an effective tax rate of approximately 13.5% and about 114 million weighted average shares outstanding.
DRI’s Zacks Rank & Key Picks
Darden currently carries a Zacks Rank #3 (Hold).
Some better-ranked stocks in the Zacks Retail-Wholesale sector have been discussed below.
The Cheesecake Factory CAKE currently sports a Zacks Rank #1 (Strong Buy). You can see the complete list of today’s Zacks Rank #1 stocks here.
The Cheesecake Factory has a trailing four-quarter earnings surprise of 10.1%, on average. The Zacks Consensus Estimate for CAKE’s fiscal 2026 sales and EPS indicates growth of 7% and 20.2%, respectively, from the year-ago period’s levels.
Cracker Barrel Old Country Store CBRL presently flaunts a Zacks Rank of 1. Cracker Barrel has a trailing four-quarter earnings surprise of 228.6%, on average.
The consensus estimate for CBRL’s fiscal 2026 EPS indicates growth of 60%, from the year-ago period’s levels.
Brinker International EAT currently holds a Zacks Rank of 2 (Buy). Brinker has a trailing four-quarter average earnings surprise of 6.2%.
The Zacks Consensus Estimate for EAT’s fiscal 2027 sales and EPS indicates growth of 8.1% and 22.7%, respectively, from the year-ago period’s levels.
7 Best Stocks for the Next 30 Days
Just released: Experts distill 7 elite stocks from the current list of 220 Zacks Rank #1 Strong Buys. They deem these tickers "Most Likely for Early Price Pops."
Since 1988, the full list has beaten the market more than 2X over with an average gain of +23.9% per year. So be sure to give these hand picked 7 your immediate attention.
See them now >>Want the latest recommendations from Zacks Investment Research? Today, you can download 7 Best Stocks for the Next 30 Days. Click to get this free report
Darden Restaurants, Inc. (DRI): Free Stock Analysis Report
Cracker Barrel Old Country Store, Inc. (CBRL): Free Stock Analysis Report
The Cheesecake Factory Incorporated (CAKE): Free Stock Analysis Report
Brinker International, Inc. (EAT): Free Stock Analysis Report
This article originally published on Zacks Investment Research (zacks.com).