
TITLE:NASDAQ M15 Intraday Forward Test
ID:strateric
Telegram:
https://t.me/+heKA7IE8Z4M0ZjBl
Charts & Ideen
XAUUSD (Gold) Weekly Linear Regression Channel (Length 100) #2
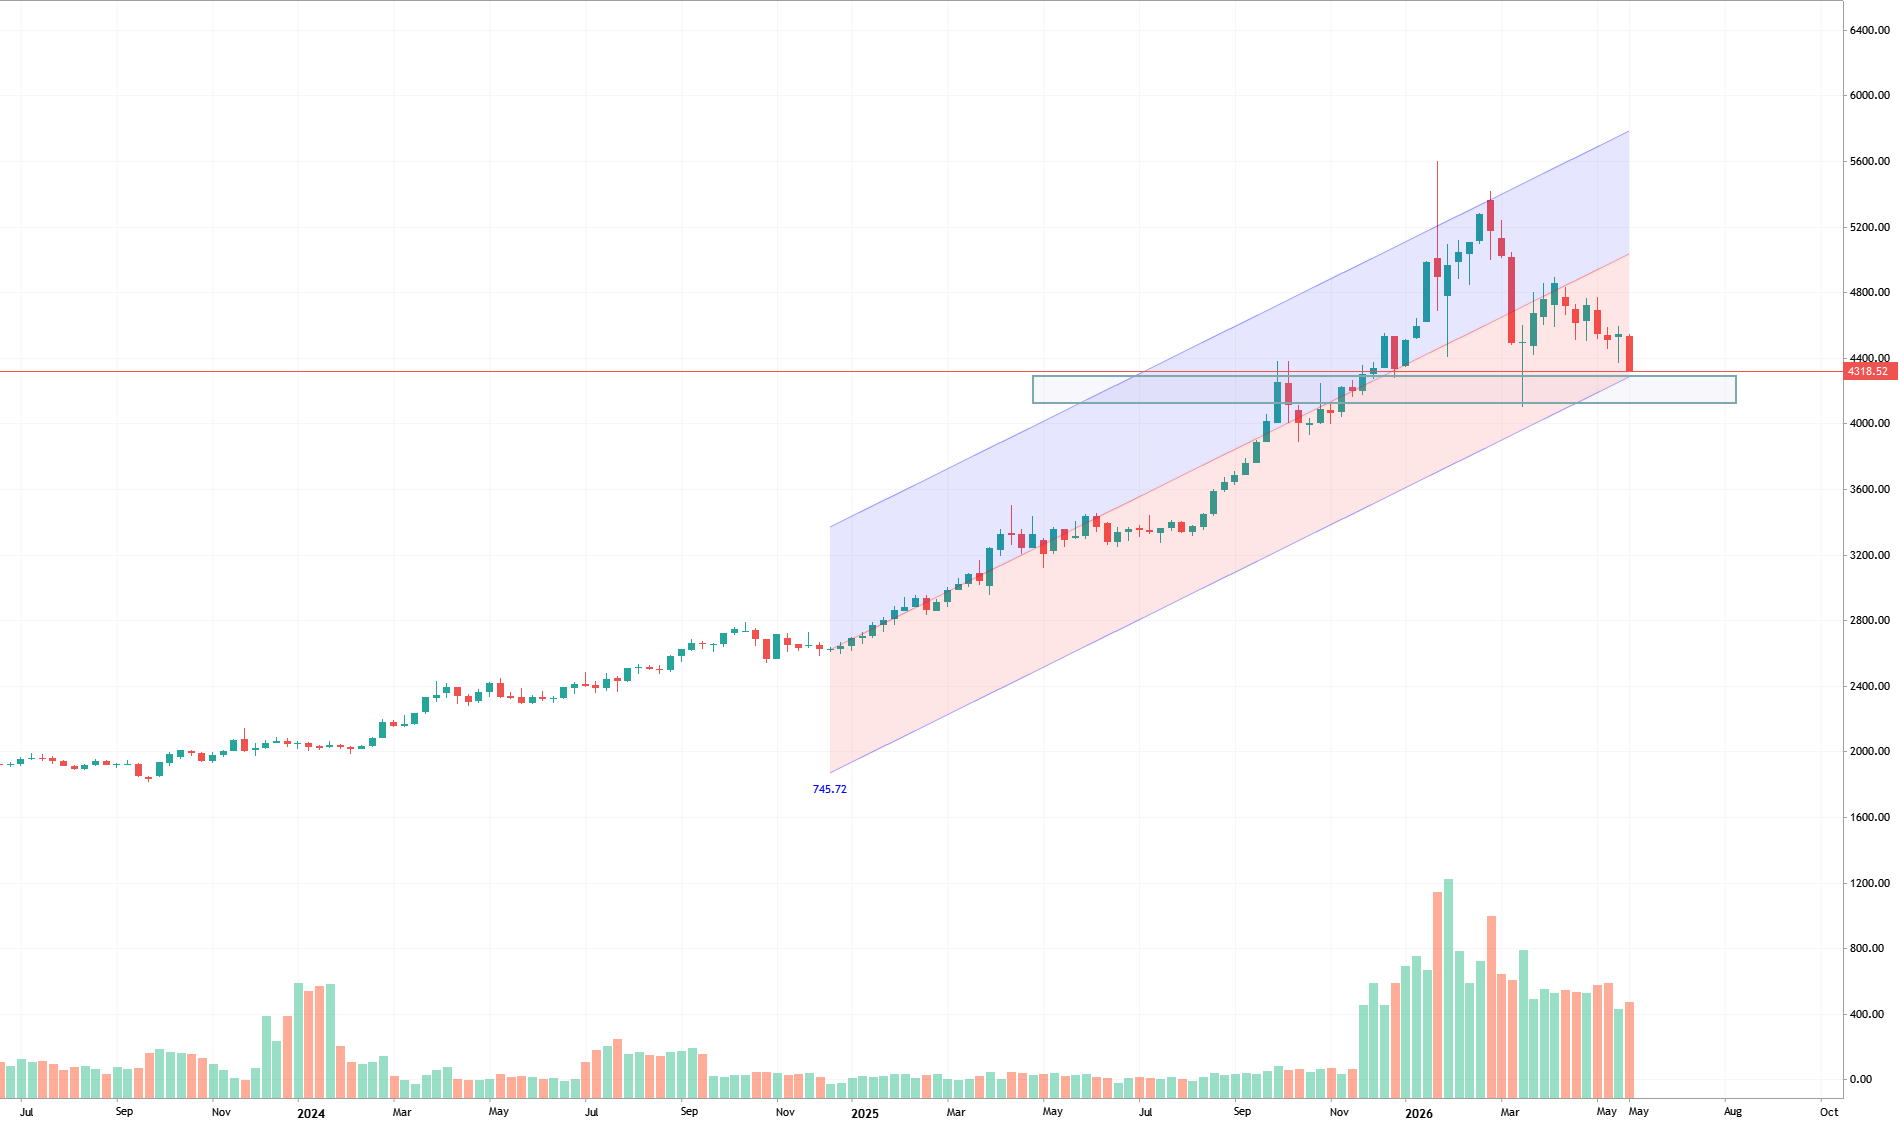
In the previous analysis, the XAUUSD weekly chart was evaluated using a Linear Regression Channel structure. At the time, bullish momentum already appeared relatively weak, and the market subsequently generated a strong bearish structural signal attempting to break below the lower boundary of the Linear Regression Channel 100. From the current structural perspective, the probability of further downside movement toward the boxed price zone marked on the chart has increased. Although short-term technical rebounds may still occur, the broader directional structure continues to favor bearish pressure for now. As a result, temporary rebound phases may continue to provide more favorable conditions for conservative short-side positioning rather than aggressive long exposure. From a long-position
2026.06.06 15:20 0 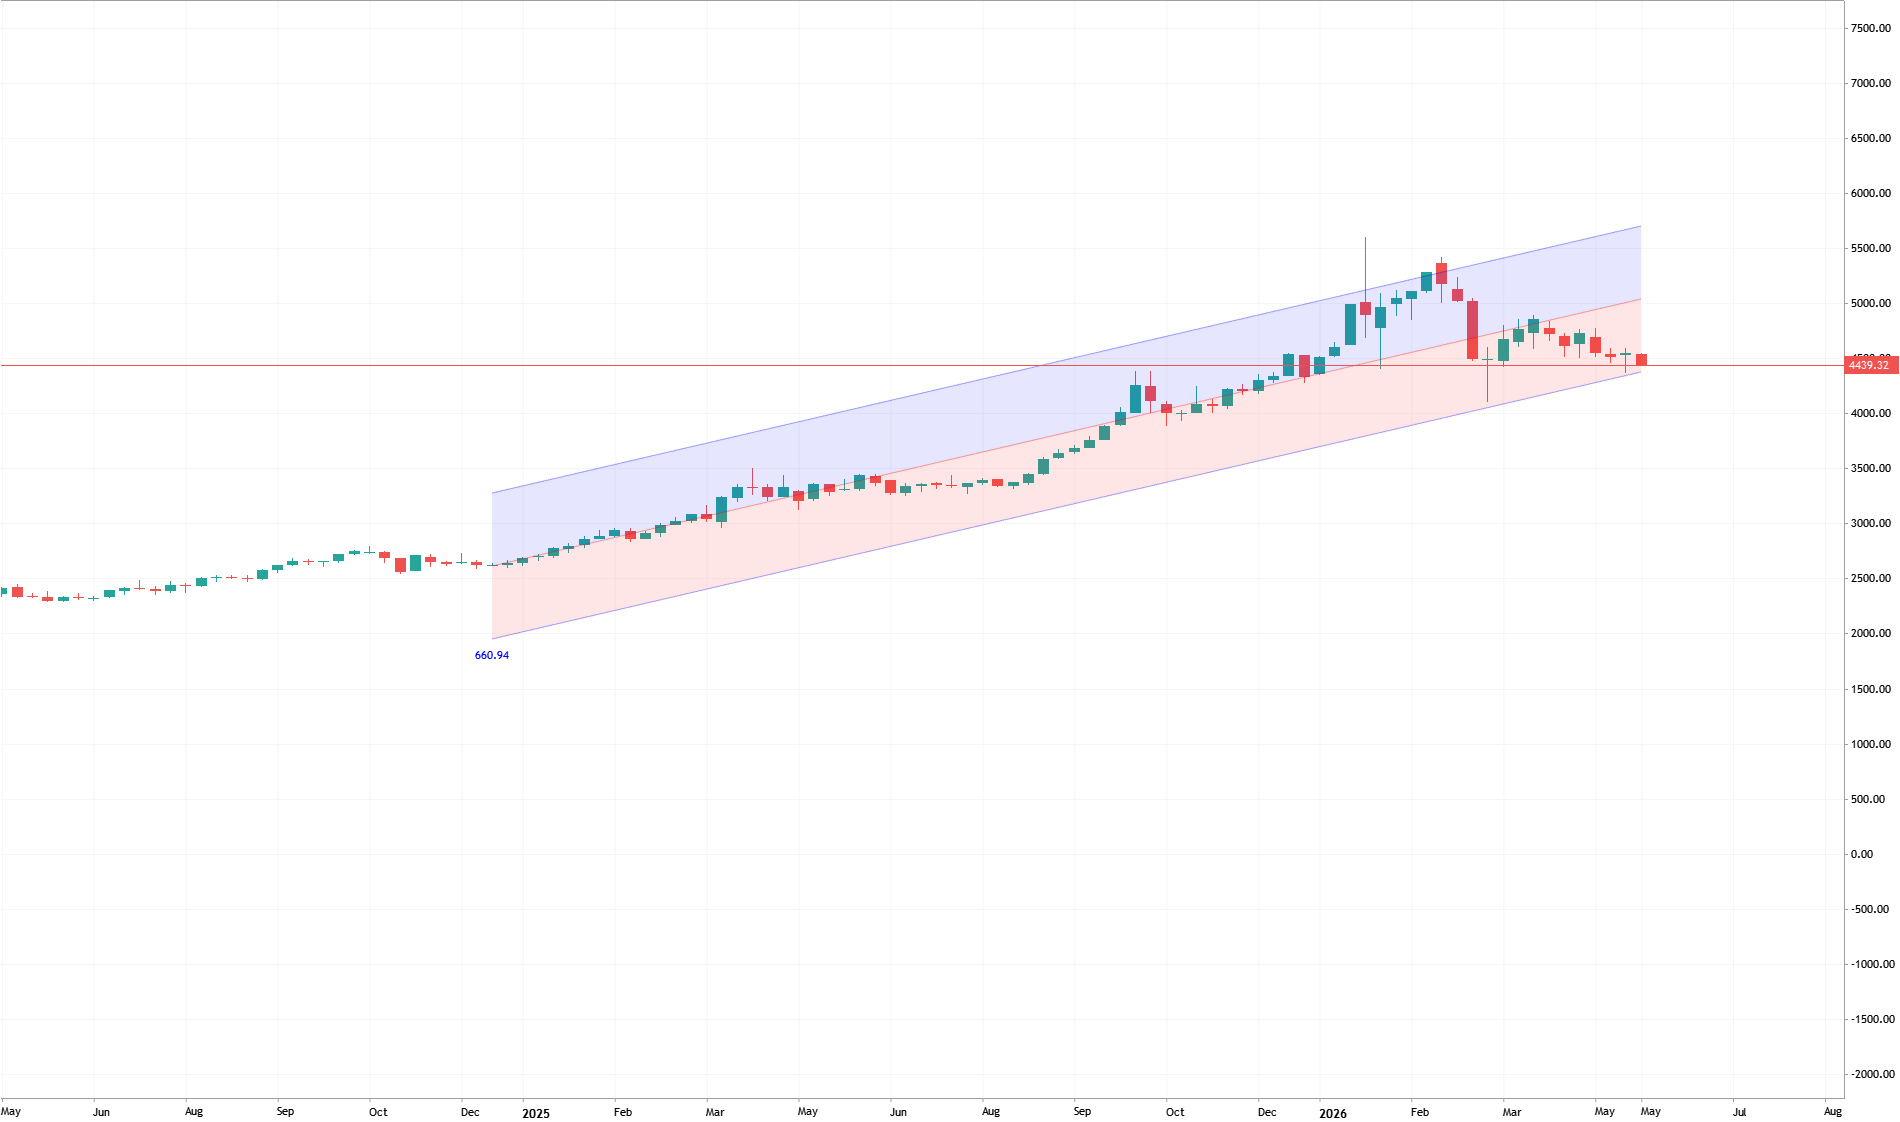
XAUUSD (Gold) Weekly Linear Regression Channel (Length 100)
1. Multi-Timeframe Diagnosis Weekly (Length 100): Price is testing the lower channel boundary (-2SD) . This is a critical macro support level determining the 2-year trend. Daily / Intraday: Strictly bearish (lower highs and lower lows). No buying pressure is observed despite hitting the weekly floor. 2. Market Outlook High Breakdown Probability: Since lower timeframes maintain strong bearish momentum, the weekly support is highly vulnerable. Expected Move: A sharp downward price extension is likely as macro support fails and triggers stop-losses. 3. Tactical Strategy No Blind Buying: Avoid catching a falling knife just because the price seems low. Short Strategy: Follow the trend and short if the price decisively closes below the weekly -2SD line. Long Strategy: Wait for confirmation. Only
2026.06.03 17:56 0 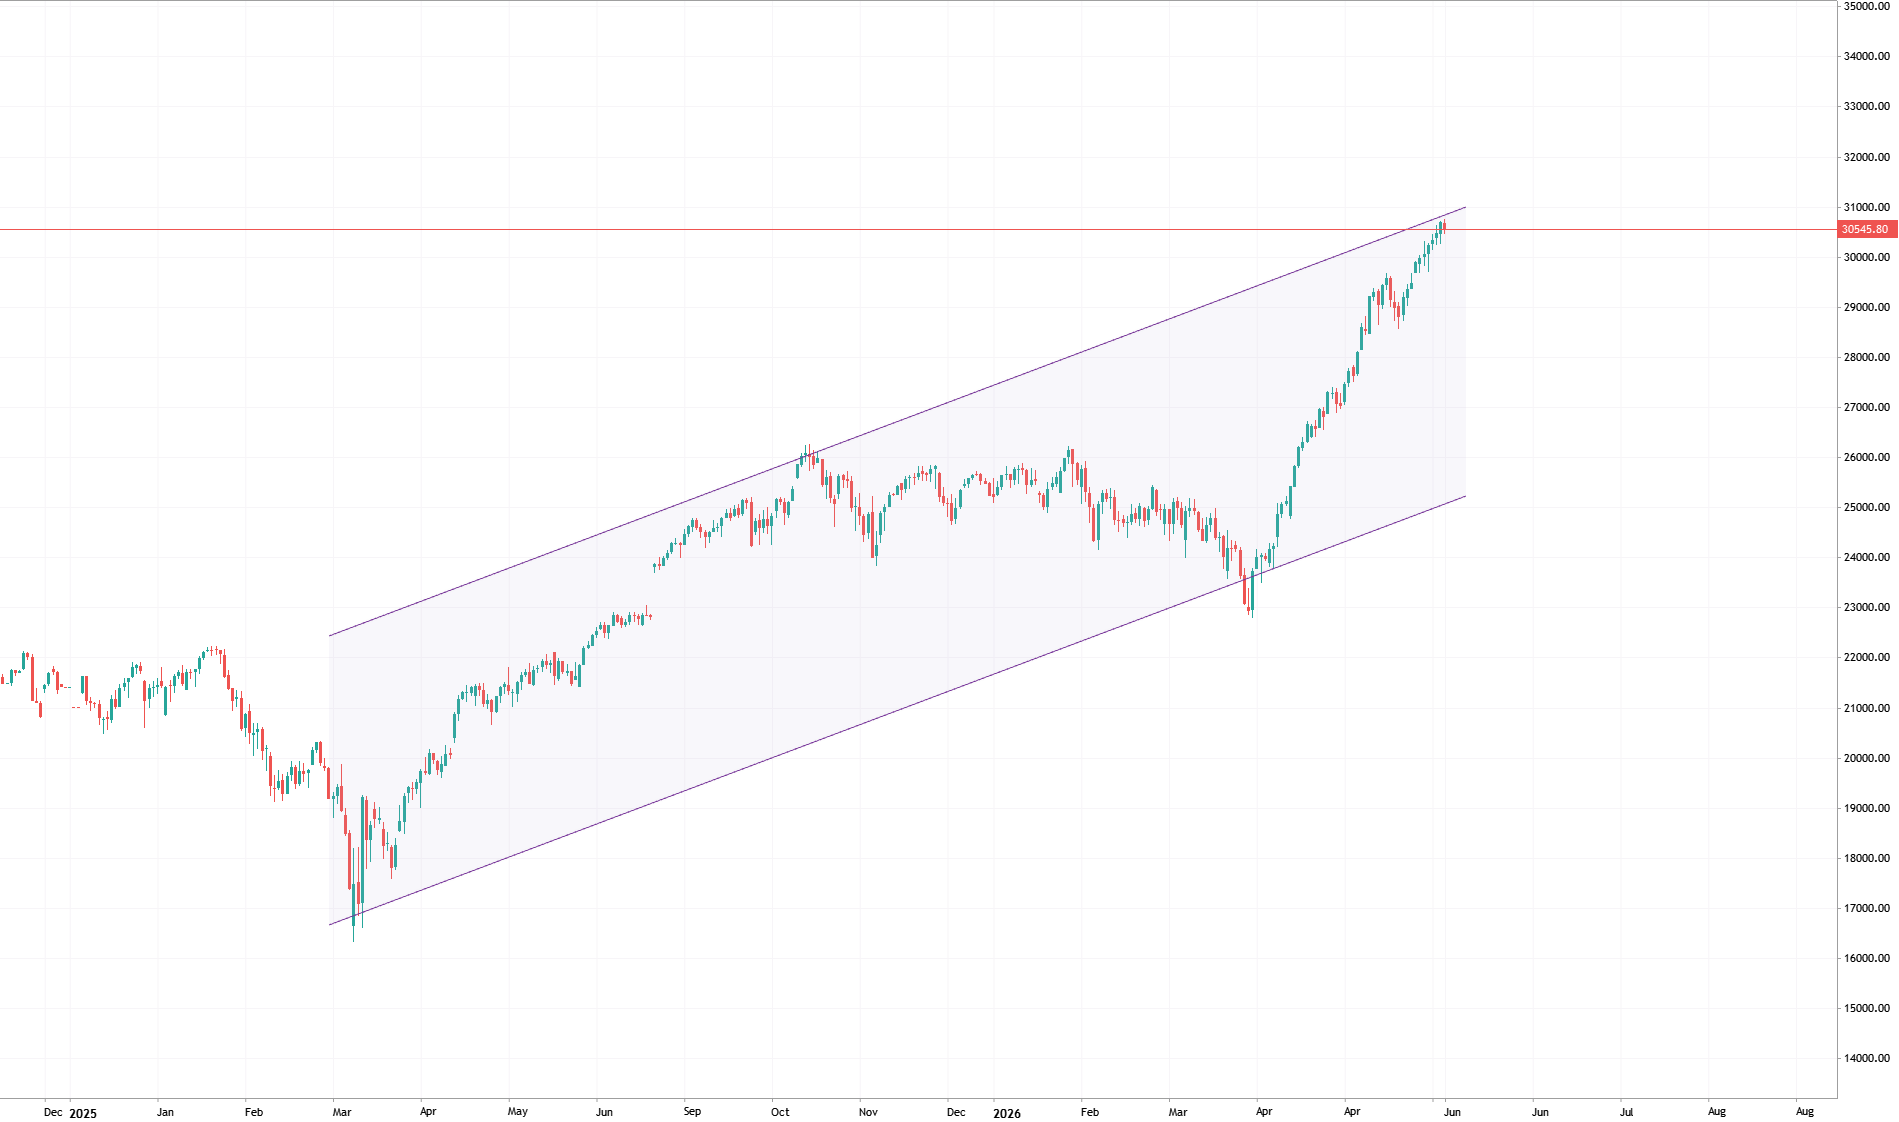
Nasdaq 100 Linear Regression Channel Analysis
**[Nasdaq 100 Linear Regression Channel Analysis Summary]** --- ### 1. Review of the Late March Buy Signal * **Event:** Price broke below the lower channel boundary (-2SD) and then re-entered ➔ **BUY Signal Confirmed**. * **Result:** Mean reversion triggered at the statistical bottom, fueling a powerful 2-month uptrend. ### 2. Current Upper Breakout & Why No Signal Has Appeared * **Event:** Price is surging past the upper channel line (+2SD), yet no sell arrow has printed. * **Reason:** The system triggers a sell signal only when the price **breaks back down inside** the upper boundary, not simply when it touches or exceeds it. * **Interpretation:** The absence of a signal means the market is in a state of **extreme bullish momentum (trend extension)**, rising faster than the channel's
2026.06.03 17:39 0