

 MQL5-Profil öffnen
Sharing technical analysis and market insights
Focused on price action & smart money concepts
For educational purposes only
Charts & Ideen

EURUSD H4 ANALYSIS
EUR/USD (H4) Analysis 📊
🟢 Price is testing a strong resistance zone after a sharp bullish breakout.
📈 As long as price remains below 1.1560, sellers may step in.
🔻 A rejection from current levels could trigger a pullback toward the 1.1450–1.1420 support area.
⚠️ A clean breakout above 1.1560 would invalidate the bearish outlook and open the door for further upside.
Bias: Bearish Pullback 📉 | Wait for confirmation before entering.
BTCUSD H4 ANALYSIS
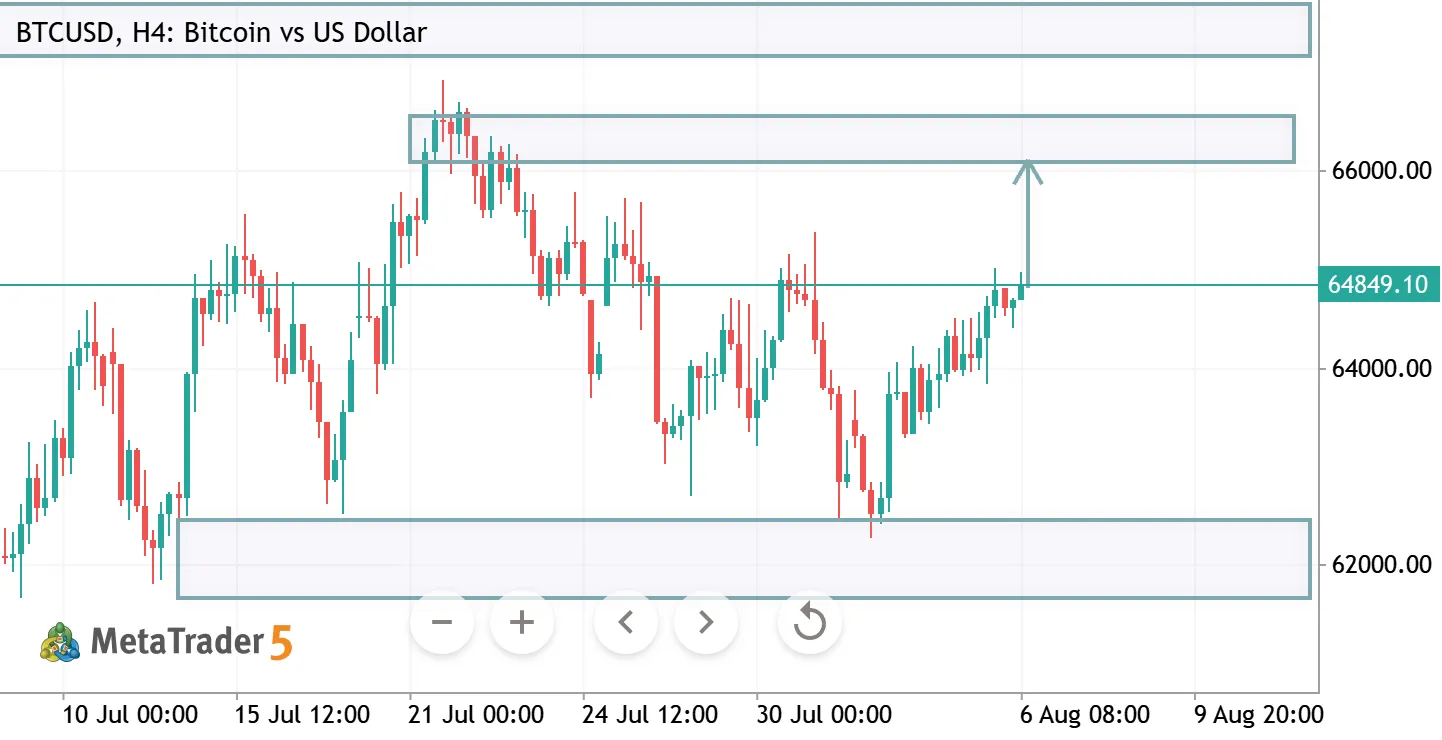
📊 BTCUSD H4 Analysis
Bitcoin is approaching a major resistance zone after a steady bullish recovery. Price is testing the 64.8K–66K supply area, where a breakout could trigger the next leg higher.
🔹 Bias: Bullish 🟢 🔹 Resistance: 65,500 – 66,000 🔹 Support: 62,000 – 61,000 🔹 Outlook: A confirmed breakout above resistance may open the path toward new highs, while rejection could lead to a healthy pullback before continuation.
Wait for confirmation and always trade with proper risk management. 📈

XAUUSD H4 ANALYSIS
📊 XAUUSD H4 Analysis
Gold has broken above the consolidation range with strong bullish momentum and is now retesting the breakout zone. If buyers defend this level, the next move could extend toward the 4380–4400 resistance area.
🔹 Bias: Bullish 🟢 🔹 Support: 4160–4200 🔹 Resistance: 4380–4400 🔹 Strategy: Wait for a confirmed retest before looking for long opportunities. A rejection from resistance may trigger a short-term pullback.
Trade with proper risk management and wait for price confirmation.
BTCUSD H4 ANALYSIS
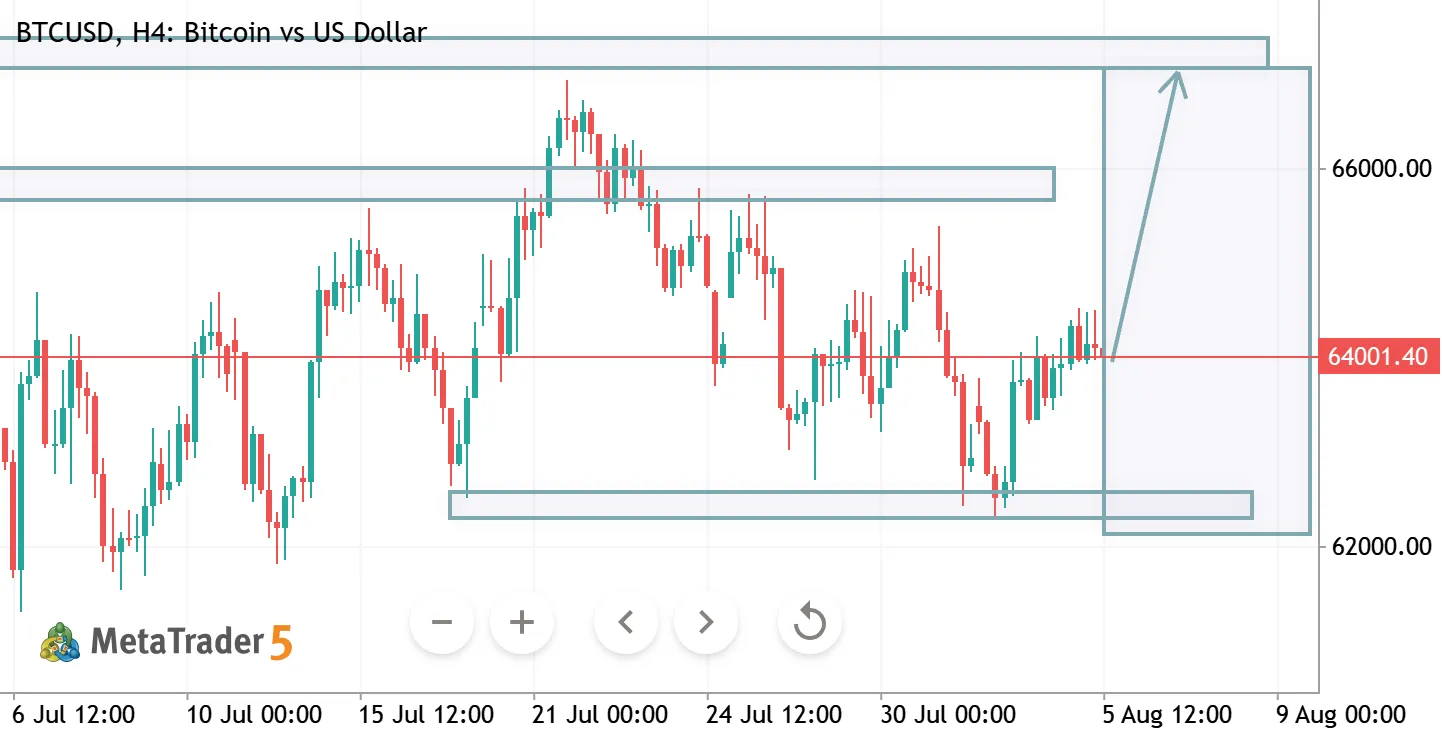
BTCUSD H4 Analysis
BTCUSD is trading inside a well-defined range and holding above a key demand zone. Buyers are defending support, increasing the probability of a breakout toward the upper resistance if bullish momentum continues.
Bias: Bullish Key Support: 62,000 – 62,300 Key Resistance: 65,500 – 66,800
Watch for a confirmed breakout above resistance for continuation. Manage risk and wait for price confirmation before entering.

XAUUSD H1 ANALYSIS
📉 XAUUSD | SELL SIGNAL
🔴 Entry: 4162 – 4166 🛑 Stop Loss: 4174
🎯 Target 1: 4155 🎯 Target 2: 4148 🎯 Target 3: 4140
📊 Market Context: Price is testing a strong resistance zone after a sharp bullish rally. A bearish rejection from this area may trigger a healthy pullback toward the next support levels.
📝 Trading Plan:
Wait for bearish confirmation (rejection candle or bearish engulfing).
Enter only after confirmation.
Move Stop Loss to breakeven after Target 1 is hit.
Manage risk with proper position sizing.
⚠️ Disclaimer: This analysis is for educational purposes only and is not financial advice. Always use proper risk management before taking any trade.

XBRUSD M15 ANALYSIS
XBRUSD Oil | m15 Analysis
Price is consolidating above a key demand zone while respecting Fibonacci support. A bullish breakout above 85.00 could open the path toward 86.90–88.40. If support fails, expect a retest of the 82.00 area before the next directional move.
Wait for breakout confirmation and manage risk accordingly. 📈

XAGUSD H1 ANALYSIS
XAGUSD | H1 Analysis
Price is holding above a key Fibonacci support zone, keeping the short-term bullish structure intact. A sustained move above 58.70 could trigger further upside toward the 59.40–60.00 resistance area. However, losing the current support may lead to a deeper pullback before buyers regain control.
Patience is key—wait for confirmation before entering the trade. 📊

XAUUSD H4 ANALYSIS
XAUUSD | H4 Analysis
Gold is consolidating above a key support zone after rejecting lower prices. As long as price holds above support, buyers may target the 4,170–4,220 resistance area. A clean breakout above resistance could extend the bullish momentum, while a break below support would invalidate the setup and increase bearish pressure.
Trade smart — wait for confirmation before entering. 📊
BTCUSD H1 ANALYSIS
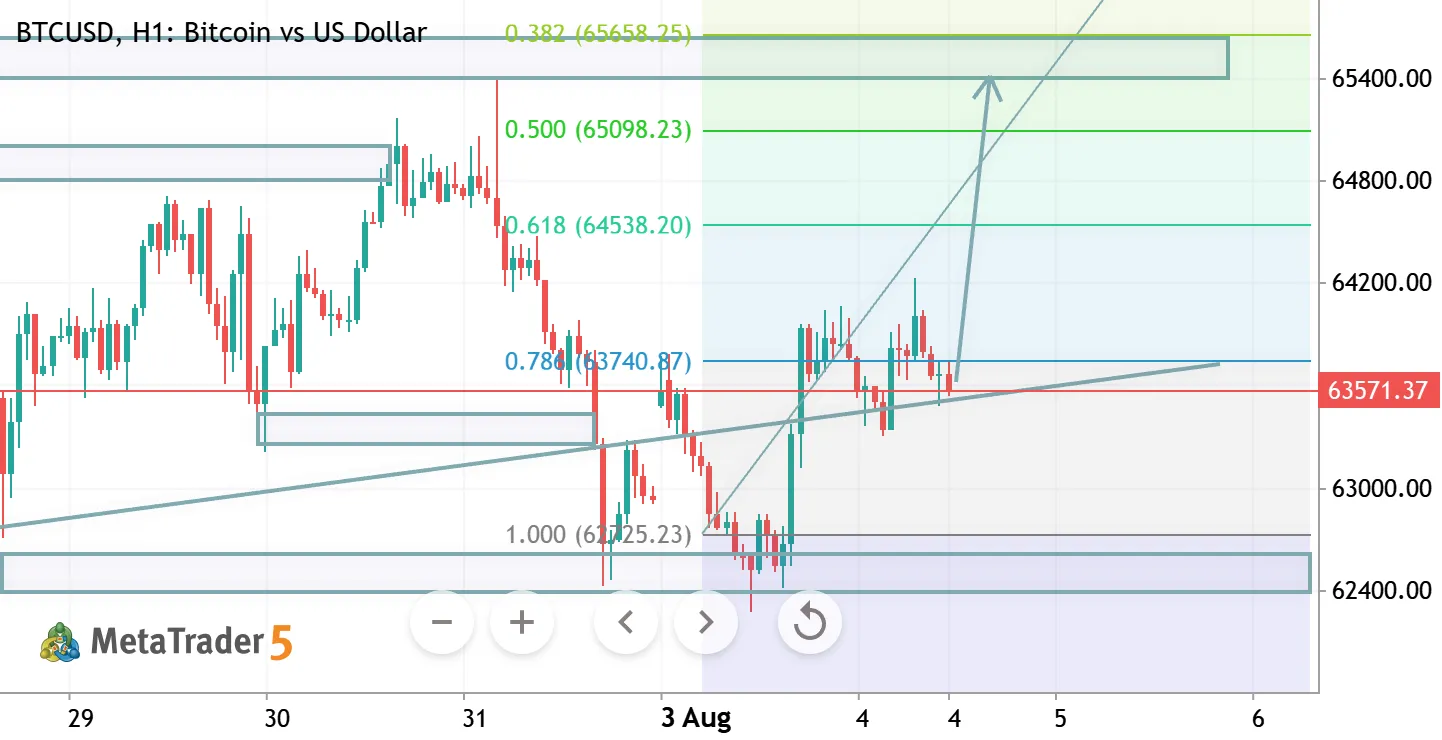
BTCUSD H1 Analysis
BTCUSD is holding above a key demand zone after a strong rebound from recent lows. Price is attempting to break higher, with the 64.8k–65.1k resistance area acting as the next major target. A sustained move above this zone could accelerate bullish momentum.
Bias: Bullish Key Support: 63,200 – 63,000 Key Resistance: 64,800 – 65,100
Wait for confirmation before entry and always use proper risk management.

GBPUSD H4 ANALYSIS
GBP/USD – Technical Outlook (H4)
Price is reacting around the 0.382 Fibonacci retracement, showing hesitation after a strong bullish recovery. A sustained break above 1.3480–1.3510 could confirm bullish continuation toward higher resistance. However, rejection from the current zone may trigger a pullback to 1.3380 and 1.3330 support before the next move.
Bias: Neutral to Bullish Key Levels: Resistance: 1.3480 / 1.3510 | Support: 1.3380 / 1.3330
Trade with proper risk management and wait for confirmation before entering.

EURUSD H4 ANALYSIS
EURUSD Technical Analysis (H4)
EURUSD remains in an overall bullish structure after a strong impulse move. Price is currently retesting the Fibonacci support zone, where buyers may regain control.
📈 Bullish Scenario: Holding above the 0.618–0.786 retracement could trigger another push toward the 1.1550–1.1600 resistance area.
📉 Bearish Scenario: A confirmed break below the support zone may lead to a deeper correction before the next bullish leg.
Trade Smart: Wait for price confirmation before entering. Risk management is essential.
#EURUSD #Forex #TechnicalAnalysis #PriceAction #MQL5
BTCUSD H4 ANALYSIS
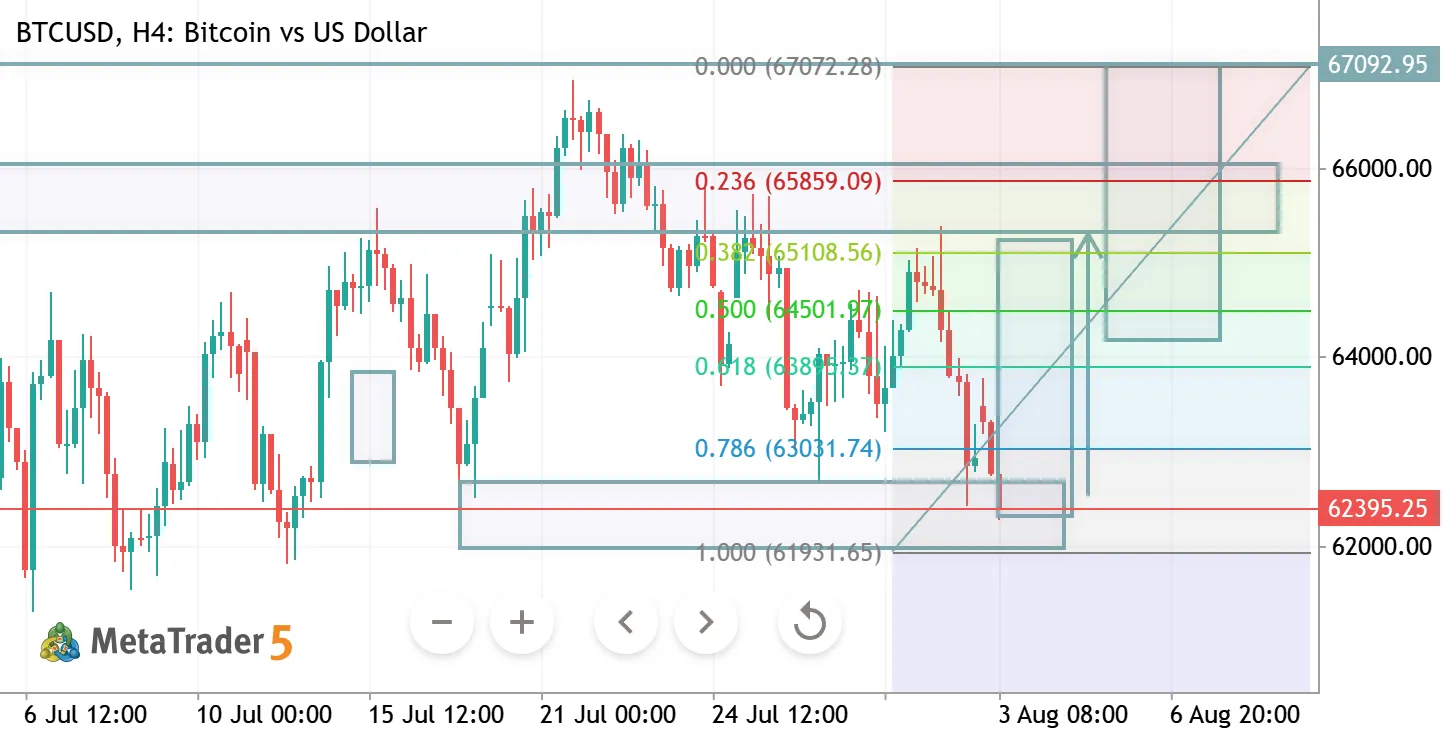
BTCUSD H4 Analysis Bitcoin is reacting from a major demand zone after testing deep Fibonacci support. Buyers are attempting to regain control, and a sustained move above the 64,500–65,000 resistance area could confirm a bullish reversal toward higher liquidity. 📈 Bias: Bullish Recovery 🎯 Targets: 65,800 → 67,000 ⚠️ Key Support: 62,900–62,300 Wait for a confirmed breakout above resistance or a clean retest of support before entering. Always use proper risk management.