SMMA Cross + Breakout Confirmation Strategy
Trading Idea
Market Analysis
The market is currently transitioning from consolidation into a potential trend phase. This setup combines SMMA crossover signals with range breakout confirmation to identify higher-probability trading opportunities.
Bullish Scenario
- Fast SMMA crosses above Slow SMMA.
- Price consolidates within a defined range.
- A candle closes above resistance.
- Volume and momentum support the breakout.
Key Levels
- Range Resistance: Breakout Trigger
- Range Support: Invalidation Level
- Previous Swing High: Target Area
Invalidation
- Price closes back inside the range.
- Fast SMMA crosses below Slow SMMA.
Bearish Scenario
- Fast SMMA crosses below Slow SMMA.
- Price consolidates before breaking support.
- Downside breakout confirms bearish momentum.
Key Levels
- Range Support: Breakout Trigger
- Range Resistance: Invalidation Level
- Previous Swing Low: Target Area
Invalidation
- Price closes back above support.
- Fast SMMA crosses above Slow SMMA.
Education Idea
Strategy Concept
This method combines trend confirmation and market structure analysis.
Indicator Used
- Fast SMMA
- Slow SMMA
Core Principle
Many moving average crossover strategies generate false signals during sideways markets. By waiting for a breakout from a consolidation zone after the crossover, traders can filter out low-quality setups and focus on trades with stronger momentum.
Advantages
- Reduces whipsaw trades.
- Provides clear entry and invalidation points.
- Works across multiple timeframes and markets.
Limitations
- Late entries compared to pure crossover systems.
- False breakouts can still occur during low liquidity periods.
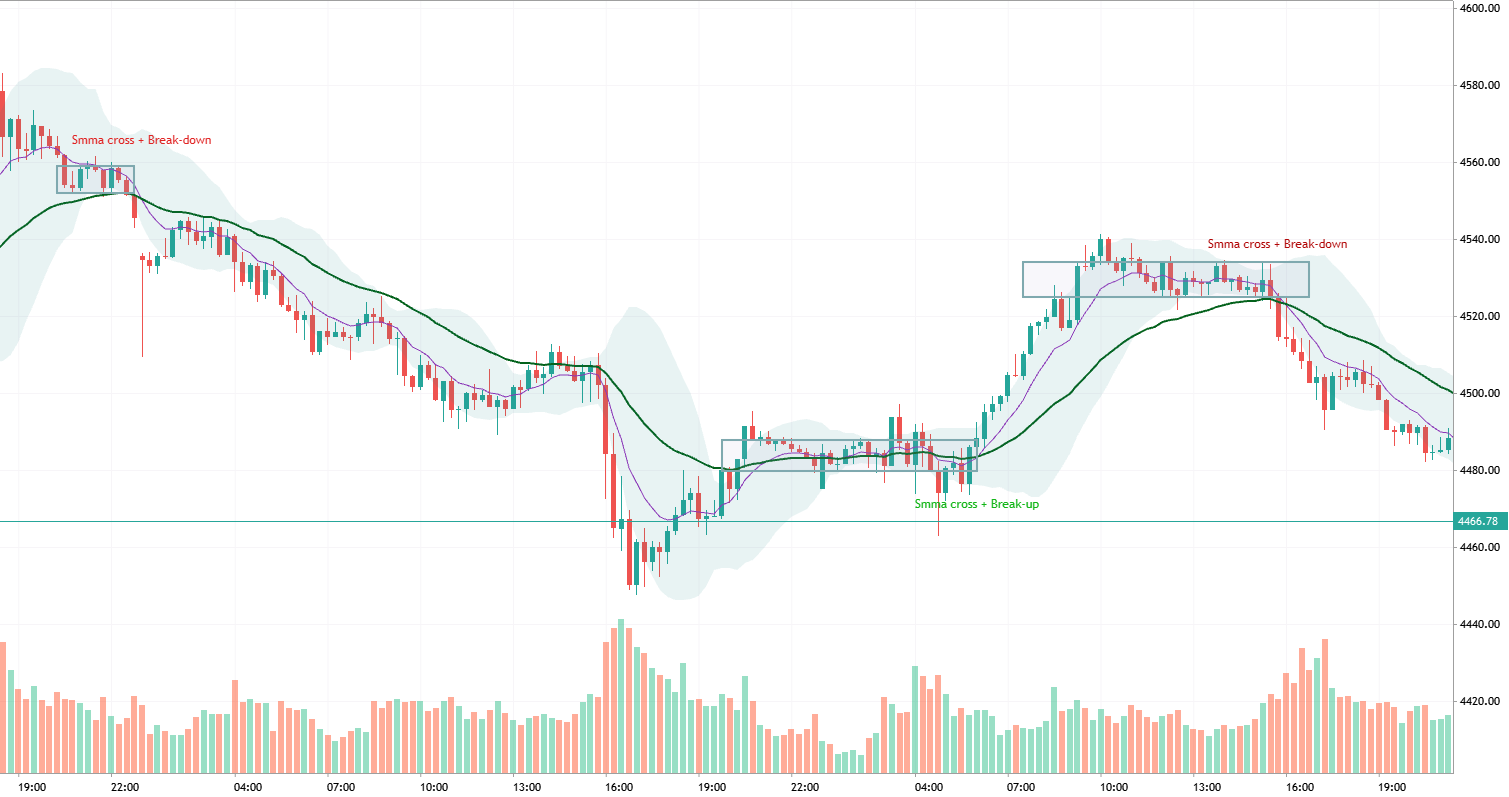
Chart Analysis
Key Chart Features
- Consolidation ranges highlighted with rectangles.
- SMMA crossover points marked on the chart.
- Breakout candles used as trade confirmation.
- Trend continuation examples shown after breakout.
Annotations
- Green Labels: Bullish SMMA Cross + Break-up
- Red Labels: Bearish SMMA Cross + Break-down
- Boxes: Consolidation Zones
- SMMA Fast (Purple): Short-term Trend
- SMMA Slow (Green): Long-term Trend
The chart illustrates how waiting for both crossover and breakout confirmation can significantly improve trade selection compared to using moving average crossovers alone.
Questions for the community:
- Do you prefer breakout entries or retest entries?
- What minimum consolidation period do you require before a breakout?
- Have you tested this strategy with EMA, SMA, or VWAP instead of SMMA?
- Which markets produce the best results with this setup?

New comment
Buy