In today's article we will begin studying the use of SQL in MQL5 code. We will also look at how to create a database. Or, more precisely, how to create a SQLite database file using the features built into MQL5. We will also see how to create a table, and then how to establish a relationship between tables by using primary and foreign keys. All of this, once again, will be done with MQL5. We will see how easy it is to create code that can later be migrated to other SQL implementations by using a class that helps hide the implementation being created. And, most importantly, we will see that at various points we may face the risk that something will go wrong when using SQL. This happens because, in MQL5 code, SQL code will always be placed inside a string.
In today's article, we will look at how to control some object properties in a simple way using code. We will also see how a custom application can place more than one object on the same chart. In addition, we will begin to understand the importance of assigning a short name to any indicator we plan to implement.
In the previous article, we completed the necessary introduction to SQL. And, in my opinion, we properly clarified what we wanted to show and explain about SQL. This was done so that anyone who comes to look at the market replay/simulation system being built can at least get an idea of what may be happening there. The point is that there is no sense in programming things that SQL handles perfectly.
You have probably already heard about pointers when it comes to programming. But did you know that we can use this kind of data here in MQL5? Of course, this must be done in a way that keeps us in control and avoids strange program behavior during execution. Still, because this is a feature with a very specific purpose and aimed at particular kinds of tasks, it is rare to hear anyone discuss what a pointer is and how to use it in MQL5.
In this article, we will see how to visualize a database and, from that, understand how it is structured. This is done by analyzing the database’s internal structure. Although this may seem unnecessary at first, it is fully justified if we really want to become database administrators. After all, some people make a living maintaining and designing databases.
In this article, we will look at how to handle user requests to change the chart plotting mode. This is necessary so that an indicator designed for the current chart plotting mode does not look strange or differ from what a MetaTrader 5 user expects.
The article explains how to develop a tool for analyzing recurring price patterns in financial markets — by day of the month (1-31), day of the week (Monday-Sunday), or hour of the day (0-23). The indicator analyzes historical data, calculates the average return for each period, and displays the results as a histogram with a forecast. It includes customizable parameters: seasonality type, number of bars analyzed, display as percentages or absolute values, chart colors.
Before you give up and decide to abandon learning SQL, allow me to remind you, dear readers, that here we are still using only the most basic elements. We have not yet looked at some of SQL's capabilities. Once you understand them, you will see that SQL is far more practical than it seems. Although, most likely, we will eventually change the direction of what we are building, because the creation process is dynamic. We will show a little more about creating different things in SQL, because this is truly important and useful for you. Simply thinking that you are more capable than an entire community of programmers and developers will only lead to wasted time and opportunities. Do not worry, because what comes next will be even more interesting.
In this article, we will begin looking at how to work with objects directly on the chart. This is done using code specially developed for demonstration purposes. Working with objects is very interesting and can be a lot of fun. Since this will be our first contact with the topic, we will start with something very simple.
Many of you may have far more experience working with databases than I do, and therefore may have a different opinion. Since it was necessary to explain why databases are designed the way they are, and why SQL has the form it does—especially why primary and foreign keys emerged—some things had to remain somewhat abstract.
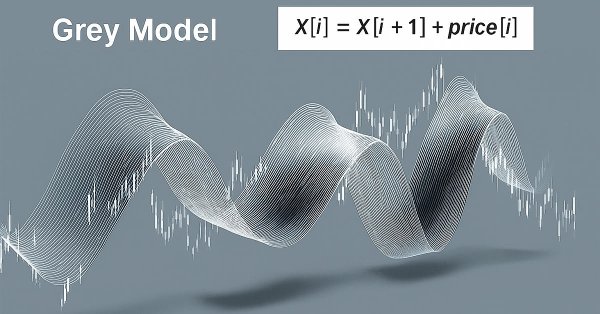
This article explores the grey model, a promising tool that can expand trader's capabilities. We will look at some options for applying this model to technical analysis and building trading strategies.
Building a purchasing power parity (PPP)-based exchange rate analysis system using Python. The author developed an algorithm with 5 methods for calculating fair exchange rates using IMF data. A practical guide to fundamental currency analysis, economic data processing, and integration with trading systems. Full code in open source.
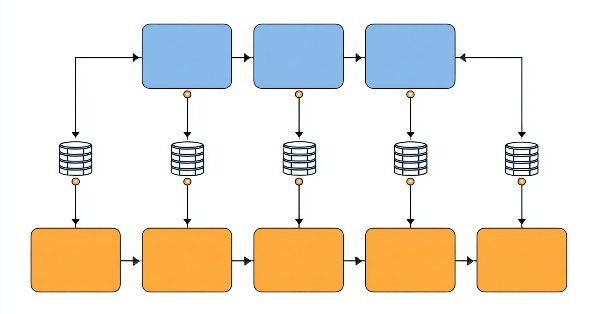
The article is dedicated to the event-driven architecture in MQL5 and describes the transition from the monolithic OnTick model to distributed processing. We will consider predefined and custom events, services and messaging between programs, as well as common architectural errors. A practical example demonstrates how to organize interactions between indicators and an EA to reduce load, improve readability, and simplify maintenance.
The article demonstrates how Python and MetaTrader 5 integration combines research flexibility and trade execution into a single workflow. Python is used for data analysis, feature selection and model training, while MetaTrader 5 is used for testing and trading automation. This approach simplifies the transfer of solutions into practice, increases reproducibility, and makes the development of trading systems faster and more structured.
Mining central bank balance sheet data provides a picture of global liquidity in the Forex market and key currencies. We combine data from the Fed, ECB, BOJ and PBoC into a composite index and use machine learning to uncover hidden patterns. This approach turns raw data into real trading signals by combining fundamental and technical analysis.
We continue to build the algorithms that form the basis of the DADA framework, which is an advanced tool for detecting anomalies in time series. This approach enables effective distinguishing random fluctuations from significant deviations. Unlike classical methods, DADA dynamically adapts to different data types, choosing the optimal compression level in each specific case.
Self-training EA with a neural network based on a state matrix. We combine Markov chains with a multilayer neural network MLP developed using the ALGLIB MQL5 library. How can Markov chains and neural networks be combined for Forex forecasting?
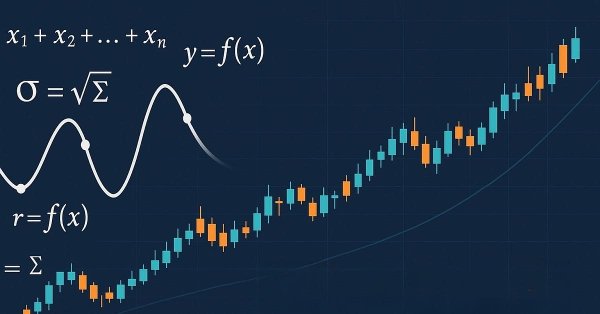
Forecasting the movements of currency pairs is an important factor in trading success. This article explores various price movement models, analyzes their advantages and disadvantages, and explores their practical application in trading strategies. We will consider approaches that allow us to identify hidden patterns and improve the accuracy of forecasts.
Computer vision for trading: how it works and how to develop it step by step. We create an algorithm for recognition of RGB images of price charts using the attention mechanism and a bidirectional LSTM layer. As a result, we obtain a working model for forecasting the EURUSD price with the accuracy of up to 55% in the validation section.
The article contains a detailed description of the cross-rate calculation algorithm, a visualization of the imbalance matrix, and recommendations for optimally setting the MinDiscrepancy and MaxRisk parameters for efficient trading. The system automatically calculates the "fair value" of each currency pair using cross rates, generating buy signals in case of negative deviations and sell signals in case of positive ones.
Although we can perform operations on a database containing about 10 records, the material is absorbed much better when we work with a file that contains more than 15 thousand records. That is, if we tried to create such a database manually, this task would be enormous. However, it is difficult to find such a database, even for educational purposes, that is available for download. But in reality, we don’t need to resort to that — we can use MetaTrader 5 to create a database for ourselves. In today's article, we will look at how to do this.
As we explained in the first article about SQL, there is no point in spending time programming procedures to do what is already built into SQL. However, without knowing the basics, you won’t be able to do anything with SQL or take full advantage of everything this tool offers. Therefore, in this article, we will look at how to perform basic tasks in databases.
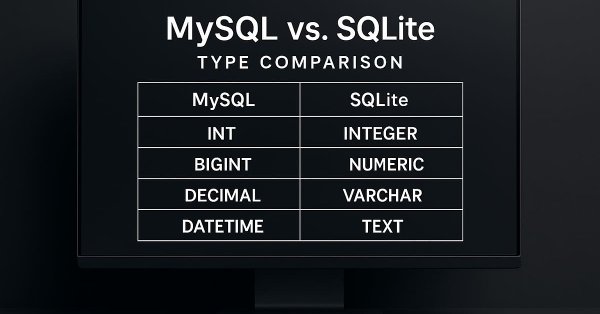
It doesn't matter which SQL program we use: MySQL, SQL Server, SQLite, OpenSQL, or another. They all have something in common, and the common element is the SQL language. Even if we do not intend to use Workbench, we can manipulate or work with the database directly in MetaEditor or through MQL5 to perform actions in MetaTrader 5, but to do so, you will need knowledge of SQL. So here, we will learn at least the basics.
No doubt, this article will require a significant amount of your time to understand how and why the materials described here work. This is because everything that will be shown here is initially oriented toward object-oriented programming, but in fact it is based on the principles of structured programming.
The implementation of the part of the code that will run in MetaTrader 5 does not present any difficulty. However, there are several points that need to be taken into account. This is necessary so that you can make the system work. Remember one important thing: not just one program will be running. In reality, we will have to run three programs simultaneously. It is important to implement and structure each of them in such a way that they can interact and communicate with one another, and that each of them understands what the others are trying or intending to do.
In today's article, we will show how to approach solving problems related to structuring different elements and creating simpler and more attractive solutions. Although the content is oriented toward learning and, therefore, does not constitute production code, it is essential to thoroughly understand the concepts and knowledge that will be covered here. In this way, in the future we will be able to follow the codes we will present.
In this article, we will implement the risk management system developed in previous publications and add the Order Blocks indicator described in other articles. In addition, we will run a backtest so we can compare results with the risk management system enabled and evaluate the impact of dynamic risk.
In this article we are implementing ARIMA forecasting indicator in MQL5. It examines how the ARIMA model generates forecasts, its applicability to the Forex market and the stock market in general. It also explains what AR autoregression is, how autoregressive models are used for forecasting, and how the autoregression mechanism works.
What is angular analysis of financial markets? How to use price action angles and machine learning to make accurate forecasts with 67% accuracy? How to combine a regression and classification model with angular features and obtain a working algorithm? What does Gann have to do with it? Why are price movement angles a good indicator for machine learning?
This article presents a MetaTrader 5–compatible backtesting workflow that scales across symbols and timeframes. We use HistoryManager to parallelize data collection, synchronize bars and ticks from all timeframes, and run symbol‑isolated OnTick handlers in threads. You will learn how modelling modes affect speed/accuracy, when to rely on terminal data, how to reduce I/O with event‑driven updates, and how to assemble a complete multicurrency trading robot.
We determine the overbought and oversold condition of the market according to chaos theory: integrating the principles of chaos theory, fractal geometry and neural networks to forecast financial markets. The study demonstrates the use of the Lyapunov exponent as a measure of market randomness and the dynamic adaptation of trading signals. The methodology includes an algorithm for generating fractal noise, hyperbolic tangent activation, and moment optimization.
The EURUSD forecasting system with the use of computer vision and deep learning. Learn how convolutional neural networks can recognize complex price patterns in the foreign exchange market and predict exchange rate movements with up to 54% accuracy. The article shares the methodology for creating an algorithm that uses artificial intelligence technologies for visual analysis of charts instead of traditional technical indicators. The author demonstrates the process of transforming price data into "images", their processing by a neural network, and a unique opportunity to peer into the "consciousness" of AI through activation maps and attention heatmaps. Practical Python code using the MetaTrader 5 library allows readers to reproduce the system and apply it in their own trading.
In this article, we'll look at what you need to do to start using Excel to manage MetaTrader 5, but in a very interesting way. To do this, we will use an Excel add-in to avoid using built-in VBA. If you don't know what add-in is meant, read this article and learn how to program in Python directly in Excel.
In the article, we will make the table column widths adjustable using the mouse cursor, sort the table by column data, and add a new class to simplify the creation of tables based on any data sets.
In the article, we will create the first version of the TableControl (TableView) control. This will be a simple static table being created based on the input data defined by two arrays — a data array and an array of column headers.
In this article, we will discuss creating a "Container" control that supports scrolling its contents. Within the process, the already implemented classes of graphics library controls will be improved.
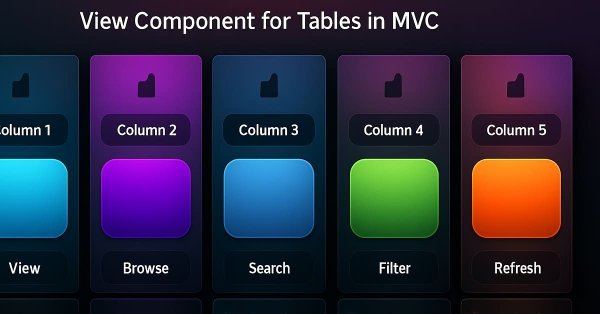
The article covers simple controls as components of more complex graphical elements of the View component within the framework of table implementation in the MVC (Model-View-Controller) paradigm. The basic functionality of the Controller is implemented for interaction of elements with the user and with each other. This is the second article on the View component and the fourth one in a series of articles on creating tables for the MetaTrader 5 client terminal.
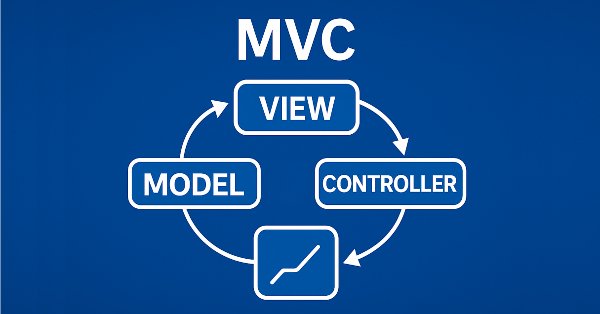
This is the second part of the article devoted to the implementation of the table model in MQL5 using the MVC (Model-View-Controller) architectural paradigm. The article discusses the development of table classes and the table header based on a previously created table model. The developed classes will form the basis for further implementation of View and Controller components, which will be discussed in the following articles.
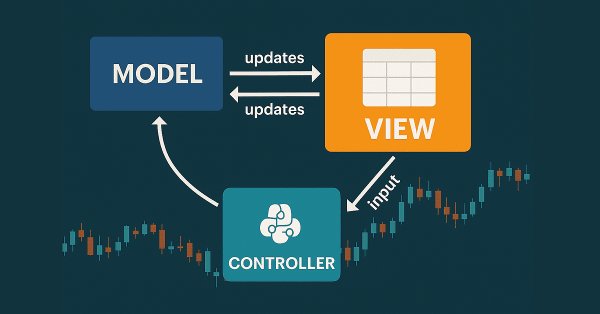
In this article, we look at the process of developing a table model in MQL5 using the MVC (Model-View-Controller) architectural pattern to separate data logic, presentation, and control, enabling structured, flexible, and scalable code. We consider implementation of classes for building a table model, including the use of linked lists for storing data.