Algorithmic Cycle Theory: Exploiting True Opens on USDCHF USDCHF Long US Dollar vs Swiss Franc
Algorithmic Cycle Theory: Exploiting True Opens on USDCHF
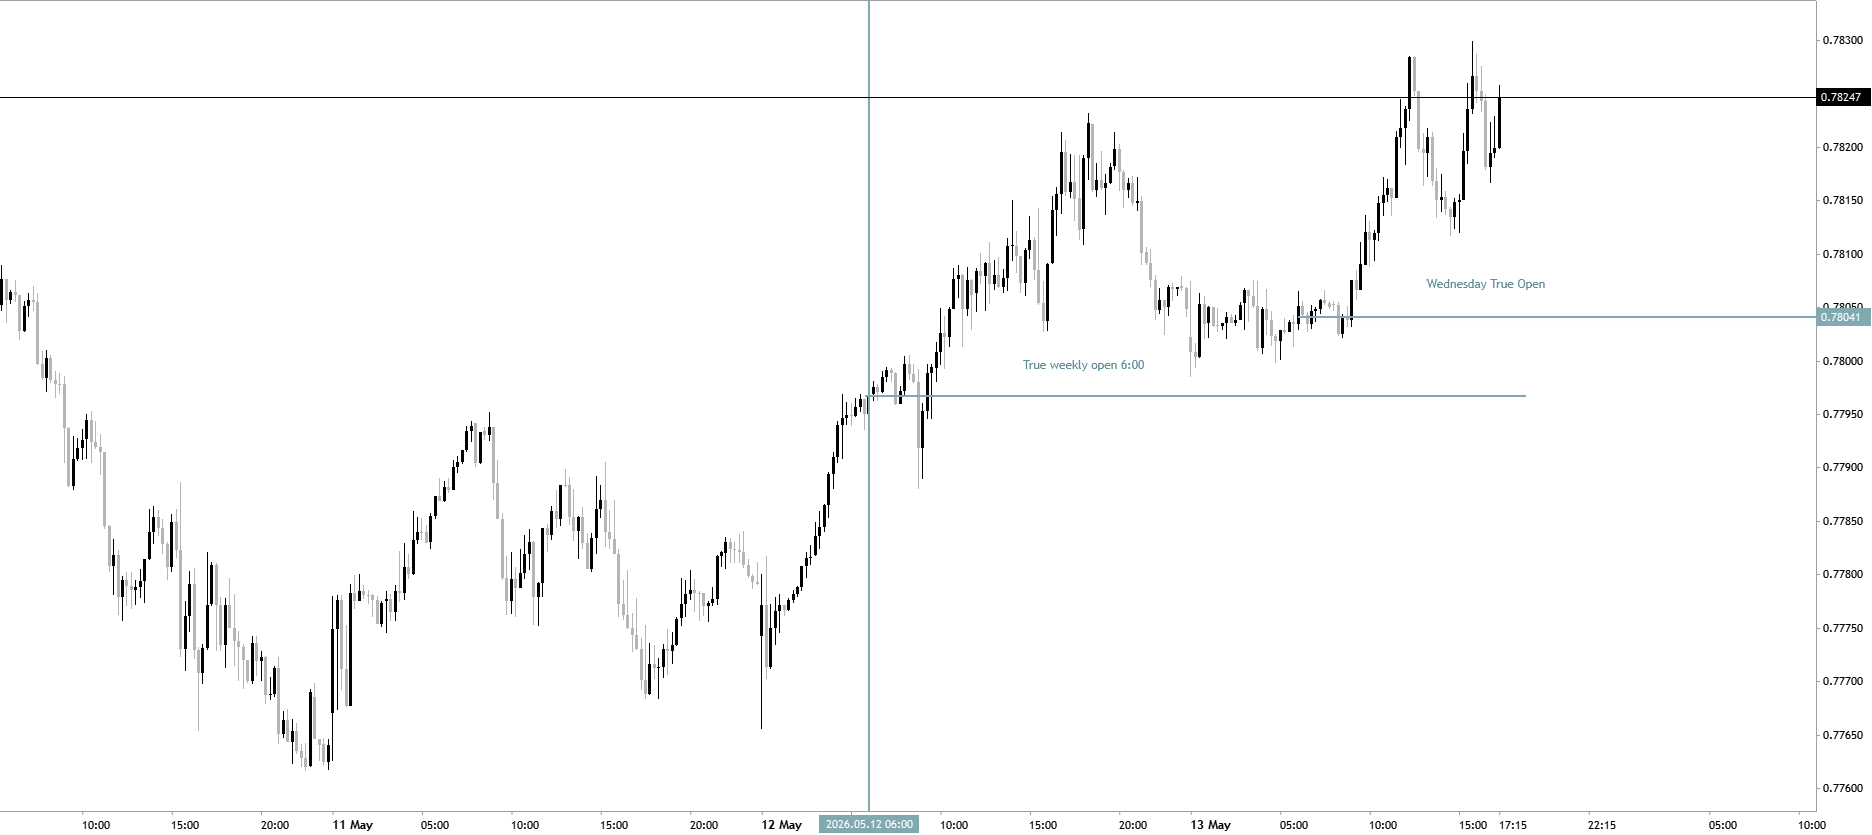
Retail traders chase price using lagging indicators. Institutional algorithms track time and liquidity. In this M15 USDCHF breakdown, I am sharing a core component of the Meridius Quant Cycle Theory: The strict mathematical interaction between the True Weekly Open and the Wednesday True Open . If you look closely at the data delivery: The Genesis (True Weekly Open - 6:00): This is not a random support line; it is the anchor of the weekly algorithmic cycle. Notice how price accumulates and expands aggressively from this precise temporal injection point. The Continuation Pivot (Wednesday True Open): Mid-week, the algorithm temporarily pauses expansion to re-accumulate and balance the book. The Wednesday Open acts as a strict fair-value threshold. Price retraces, perfectly tags this level
0
CharlesFXmillon Carlos Baena Martinez 2026.05.13 14:36
Stochastics - traditional general approach to identify the short-term reversals
S
SMH VanEck Semiconductor ETF
Stochastics - traditional general approach to identify the short-term reversals
Stochastic with 34-5-5 settings is the "fast" version of it, and it is used to identify the possible reversals in short-term situation and/or in lower timeframes for example: overbought/oversold market condition in the current market for example. It is used with the other indicators for trading such as 55 SMA, 100 SMA, "medium"/"slow" version of Stochastic and more.
0
newdigital Sergey Golubev 2026.04.24 08:10
Stochastics - traditional general approach to identify the long-term reversals
F
FBTC Fidelity Wise Origin Bitcoin Fund
Stochastics - traditional general approach to identify the long-term reversals
Stochastic with 100-8-8 settings is "slow" version of it, and it is used to identify the possible reversals in long-term situation and/or in higher timeframes for example. And because of that - the indicator with the parameters are used to estimate the possible overbought/oversold market condition in the long-term to confirm, and it should be used with the other indicators for trading for example.
0
newdigital Sergey Golubev 2026.04.24 07:50
Stochastics - traditional general approach to filter the market noise
D
DJP iPath Bloomberg Commodity Index Total Return ETN due June 12, 2036
Stochastics - traditional general approach to filter the market noise
The Stochastic Oscillator with settings 55-8-8 is used to filter out market noise compared to the standard setting. Besides, when the oscillator rises above 80 so it indicates an overbought market condition, and below 20 is indicating the oversold condition. This 55-8-8 setting is better to be used for trend-following strategies as well as the trade during the market reversal situation for example.
0
newdigital Sergey Golubev 2026.04.24 06:39
Gator Oscillator - traditional general approach XAGUSD Silver vs US Dollar
Gator Oscillator - traditional general approach
Gator Oscillator indicator was developed by Bill Williams to identify the market condition about the trend or ranging. Besides, the oscillator is measuring trend strength and identifies market phases: sleeping, awakening, eating, sated. Sleeping: Both bars are red, indicating no trend. Awakening: One bar is green, the other is red, signalling a new trend. Eating: Both bars are green, suggesting a strengthening trend. Sated: A red bar appears after an eating phase, suggesting the trend is ending. Trading Summary: The indicator is mostly used as a confirmation tool to avoid trading during consolidation.
0
newdigital Sergey Golubev 2026.03.03 17:29
Standard Deviation - traditional general approach EURUSD Euro vs US Dollar
Standard Deviation - traditional general approach
Standard deviation is frequently used to measure the volatility: higher standard deviation indicates greater variability, and lower standard deviation is related the less variability. "Standard deviation is a key tool for traders to quantify the uncertainty and risk in the market. It allows us to better understand the potential variability of returns and make informed decisions to manage our portfolios effectively." – John Bollinger. We can use standard deviation to place stop loss and take profit levels: a wider stop loss with the high standard deviation for example.
0
newdigital Sergey Golubev 2026.02.22 08:34
Accumulation/Distribution - traditional general approach
100
USTECH100M USTECH100mini
Accumulation/Distribution - traditional general approach
Accumulation Distribution uses volume to confirm price trends or warn of weak movements that could result in a price reversal. - Accumulation: Volume is considered to be accumulated when the day's close is higher than the previous day's closing price. Thus the term "accumulation day". - Distribution: Volume is distributed when the day's close is lower than the previous day's closing price. Many traders use the term "distribution day." The main use of the Accumulation Distribution Line is to detect divergences between the price movement and volume movement. Besides, Accumulation Distribution Line is a very effective tool to confirm price action and show warnings of potential price reversals.
0
newdigital Sergey Golubev 2026.02.14 07:53
Bulls Power - traditional general approach AUDUSD Australian Dollar vs US Dollar
Bulls Power - traditional general approach

Bulls Power is used to estimate power of the Bulls (Buyers). Bulls Power estimates the balance of power between the bulls and bears. This indicator aims at identifying if a bullish trend will continue or if the price has reached a point where it might reverse. A buy signal is generated when the Bulls Power oscillator moves above Zero. In an up trend, the HIGH is higher than EMA, so the Bulls Power is above zero and Histogram/Oscillator is located above zero line. Exit Signal: if the HIGH falls under EMA then it means that price are starting to fall, the Bulls Power histogram fall below the zero line.

0
newdigital Sergey Golubev 2026.02.01 06:17
Bears Power - traditional general approach BTCUSD Bitcoin vs US Dollar
Bears Power - traditional general approach
Bears Power is used to estimate power of the Bears (Sellers). Bears Power estimates the balance of power between the bulls and bears. This indicator aims at identifying if a bearish trend will continue or if the price has reached a point where it might reverse. A sell signal is generated when the oscillator moves below Zero. In a down trend, the LOW is lower than EMA, so the Indicator is below zero and Histogram/Oscillator is located below zero line. Exit Signal: if the LOW moves above the EMA then it means that price are starting to rise, the Indicator histogram rises above the zero line.
0
newdigital Sergey Golubev 2026.02.01 06:03
Accelerator oscillator - traditional general approach
P
PHO Invesco Water Resources ETF
Accelerator oscillator - traditional general approach
The Accelerator Oscillator measures the difference between the Awesome Oscillator and the 5-period moving average. The indicator reflects the rate at which the Awesome Oscillator changes to be detected the trend reversals. If the Accelerator Oscillator moves above the zero line so it is considered for the signal to be in upward acceleration to be continuing. Alternatively, if it moves below the zero line so the downward acceleration will continue. Besides, the potential price surge is confirmed by two consecutive green bars with the above the centre line. A potential price decline is confirmed by two consecutive red bars which is below the centre line.
0
newdigital Sergey Golubev 2026.01.31 09:43
Bollinger Bands - traditional general approach EXC Exelon Corporation
Bollinger Bands - traditional general approach
Bollinger bands are very similar to moving averages. The bands are plotted at two standard deviations above or below the moving average. This is typically based off of the simple moving average, but an exponential moving average can be used to increase the sensitivity of the indicator. A 20-day simple moving average is recommended for the center band and 2 standard deviations for the outer bands. Bollinger bands are typically used by traders to detect extreme unsustainable price moves, capture changes in trend, identify support/resistance levels and spot contractions/expansions in volatility. There are a number of ways to interpret Bollinger Bands: when the prices break above or below the upper or lower band, it is an indication that a breakout/breakdown is occurring. Alternatively, some traders use Bollinger Bands as an overbought and oversold indicator.
0
newdigital Sergey Golubev 2026.01.31 09:19
Average True Range - traditional general approach
500
US500 US SPX 500 Index
Average True Range - traditional general approach
The Average True Range (ATR) indicator is a measure of volatility. The ATR indicator measures the range of price movement for a particular price period. The ATR is a directionless indicator and it does not indicate the direction of the trend. ATR measures volatility, and this allows traders to set stops based actual market behavior. Low ATR values indicated extended periods of sideways price movement, such as those found at market tops and consolidation periods. Low ATR values are typical for the periods of sideways movement of long duration which happen at the top of the market and during consolidation. High ATR values indicated market bottoms after a sell off. Besides, the higher the value of the ATR indicator, the higher the probability of a trend change, and the lower the indicator’s value, the weaker the trend movement.
0
newdigital Sergey Golubev 2026.01.24 15:03