**[Nasdaq 100 Linear Regression Channel Analysis Summary]**
---
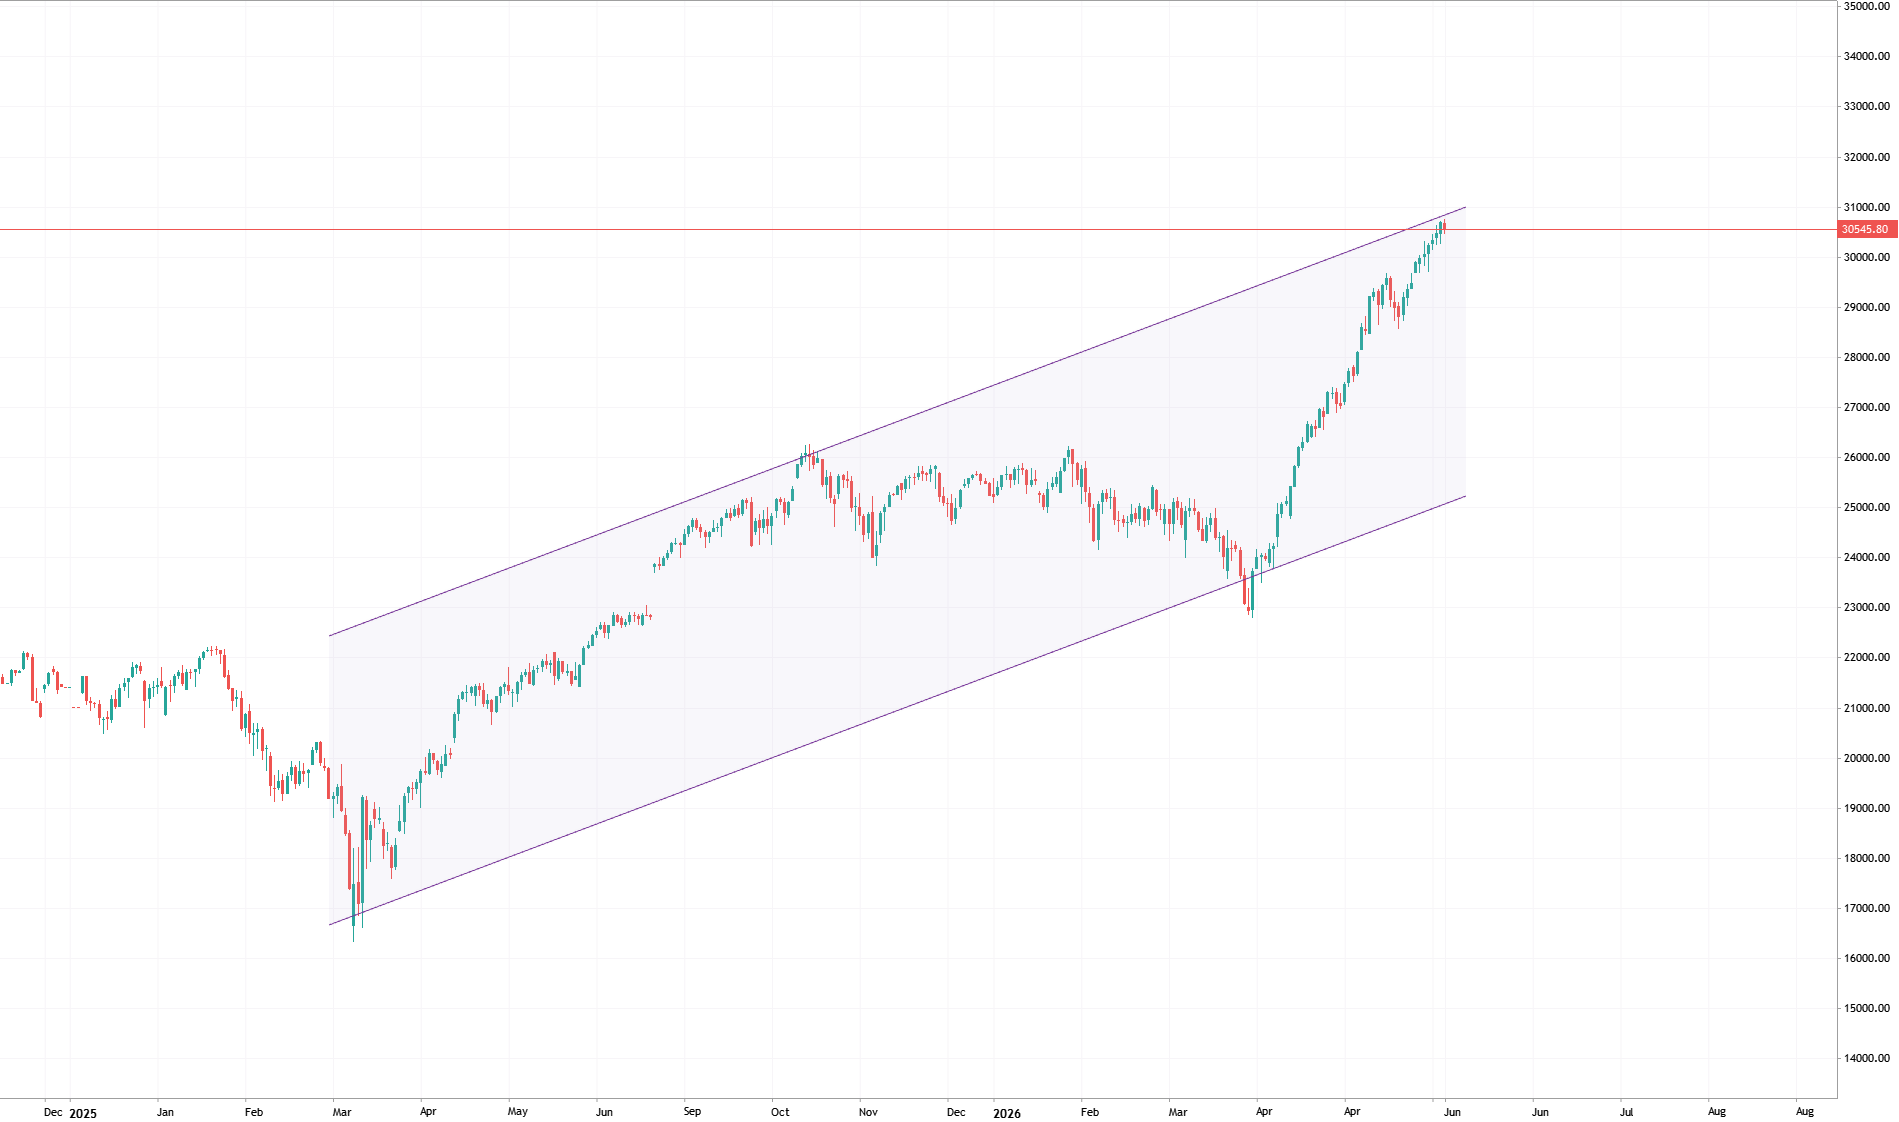
### 1. Review of the Late March Buy Signal
* **Event:** Price broke below the lower channel boundary (-2SD) and then re-entered ➔ **BUY Signal Confirmed**.
* **Result:** Mean reversion triggered at the statistical bottom, fueling a powerful 2-month uptrend.
### 2. Current Upper Breakout & Why No Signal Has Appeared
* **Event:** Price is surging past the upper channel line (+2SD), yet no sell arrow has printed.
* **Reason:** The system triggers a sell signal only when the price **breaks back down inside** the upper boundary, not simply when it touches or exceeds it.
* **Interpretation:** The absence of a signal means the market is in a state of **extreme bullish momentum (trend extension)**, rising faster than the channel's slope. (No signs of slowing down yet).
### 3. Key Strategy & Action Plan
* **Avoid Blind Shorting:** Do not attempt to predict a top just because the price looks expensive. Shorting here is highly risky as the price can continue to "ride" the upper band.
* **Wait for Confirmation:** The statistically safest move is to wait until the price tires out and **closes back inside the upper channel line (confirming the SELL arrow)** before execution.

New comment