

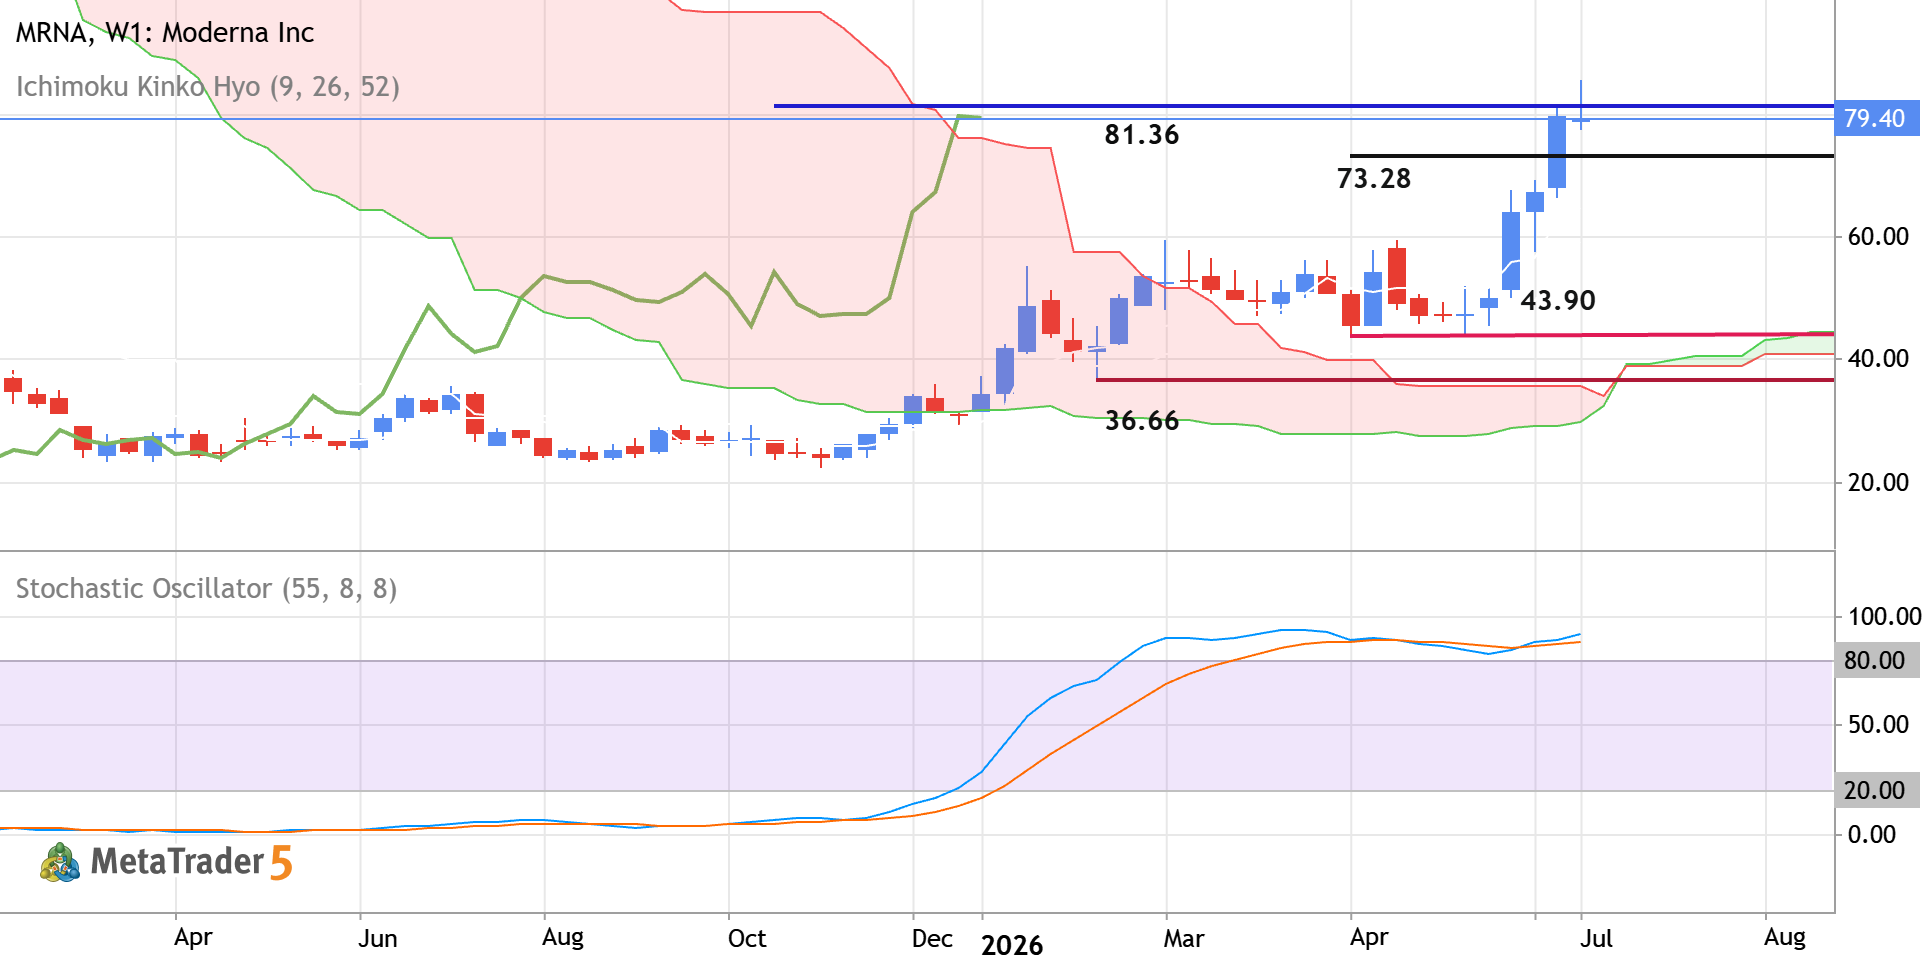
Weekly price is located above Ichimoku cloud in the bullish area of the chart for trying to cross the level at 81.36 to above for the strong bullish trend to be continuing. The price is on strong bullish breakout which is confirmed by Stochastic oscillator and Chinkou Span line.
- If the price breaks the 81.36 level to above on weekly close bar so the strong bullish trend will be continuing.
- If the price crosses the level at 73.28 to below so the secondary correction will be started.
- If the price breaks the support level at 43.90 to 36.66 to be crossed on weekly close bar so we may see the primary bearish reversal to be started on this W1 timeframe for example.
- Alternatively, the price will be on ranging to be near and above Ichimoku cloud waiting for direction.
Trading Summary: bullish breakout; waiting for the continuation or for the correction.

 MQL5 profile
New comment