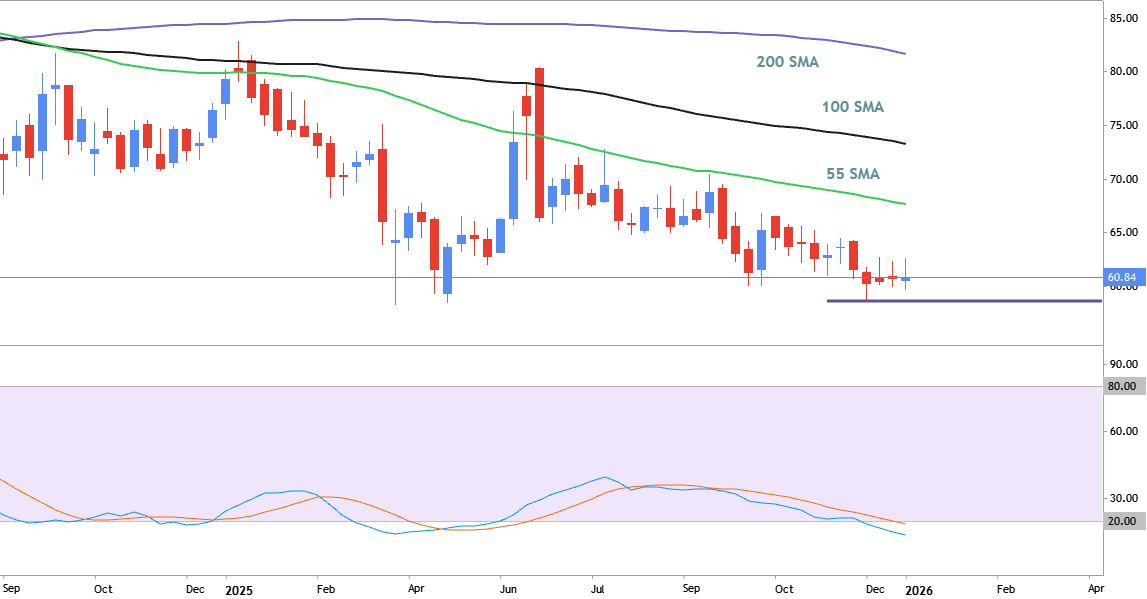
XBRUSD weekly price is below 200 SMA in the bearish area of the chart. The descending triangle pattern was formed to the price for the bearish trend to be continuing. But Stochastics is indicating the oversold market condition so the bearish continuation is possible in case of some fundamental factors for WTI for example. If the price breaks support level at 58.55 to below so the bearish trend will be continuing. Alernatively, we will see the ranging up to the bear market rally (which also depends on the strong fundamental news events for example).
The price was bounced from 119.92 to below for the secondary correction within the primary bullish market condition: price is located near and above 200 SMA for the strong bullish trend to be resumed or for the bearish reversal to be started (otherwise - ranging waiting for direction).
The price is still located above 200 SMA in the bullish area of the chart: price is testing the new resistance level at 119.92 for the bullish trend to be continuing.
The weekly price was bounced from 58.55 support level to above for 200 SMA to be broker with the new resistance level to be formed: 119.92. The Stochastic oscillator is indicating the overbought market condition so the secondary correction is very likely in the near future.
Weekly price is located far above 200 SMA in the bullish area of the chart. The price is testing the resistance level at 115.26 for the bullish trend to be cotinuing, otherwise - the price will be on ranging waiting for direction.
Weekly price broke 200 SMA for the good weekly breakout: the price was stopped by 115.26 resistance line with the ascending triangle pattern to be formed with 73.43/115.26 s/r levels. The Stochastic oscillator is indicating for the strong bullish trend to be continuing. Trading Summary: bullish breakout

New comment
The price was bounced from 119.92 to below for the secondary correction within the primary bullish market condition: price is located near and above 200 SMA for the strong bullish trend to be resumed or for the bearish reversal to be started (otherwise - ranging waiting for direction).
The price is still located above 200 SMA in the bullish area of the chart: price is testing the new resistance level at 119.92 for the bullish trend to be continuing.
The weekly price was bounced from 58.55 support level to above for 200 SMA to be broker with the new resistance level to be formed: 119.92. The Stochastic oscillator is indicating the overbought market condition so the secondary correction is very likely in the near future.
Weekly price is located far above 200 SMA in the bullish area of the chart. The price is testing the resistance level at 115.26 for the bullish trend to be cotinuing, otherwise - the price will be on ranging waiting for direction.
Weekly price broke 200 SMA for the good weekly breakout: the price was stopped by 115.26 resistance line with the ascending triangle pattern to be formed with 73.43/115.26 s/r levels. The Stochastic oscillator is indicating for the strong bullish trend to be continuing.
Trading Summary: bullish breakout
The price was bounced from 58.55 support to above for the bear market rally to be started.