Darden Restaurants, Inc. DRI reported third-quarter fiscal 2026 results, with earnings meeting the Zacks Consensus Estimate and revenues beating the same. The top and bottom lines increased on a year-over-year basis.
DRI’s Q3 Earnings & Revenues
During the fiscal third quarter, Darden reported adjusted earnings per share (EPS) of $2.95, in line with the Zacks Consensus Estimate. In the prior-year quarter, DRI reported an adjusted EPS of $2.80.
Darden Restaurants, Inc. Price, Consensus and EPS Surprise
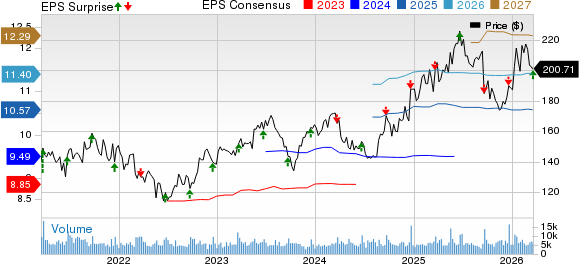
Darden Restaurants, Inc. price-consensus-eps-surprise-chart | Darden Restaurants, Inc. Quote
Total sales during the quarter were $3.35 billion, surpassing the consensus mark of $3.33 billion. Sales increased 5.9% from the prior-year quarter’s level. This upside was backed by a blended same-restaurant sales increase of 4.2%. Also, contributions from 31 net new restaurants added to the positives.
DRI’s Sales by Segments
Darden reports business under four segments — Olive Garden, LongHorn Steakhouse, Fine Dining (including The Capital Grille and Eddie V's) and Other Business.
During the fiscal third quarter, sales at Olive Garden increased 4.7% year over year to $1.39 billion. Our estimate for the metric was $1.36 billion. Comps in the segment increased 3.2% year over year compared with a 4.7% rise reported in the previous quarter.
At LongHorn Steakhouse, sales were up 11.2% year over year to $854.2 million. Our estimate for the metric was $828.6 million. Comps in the segment rose 7.2% year over year compared with 5.9% growth reported in the previous quarter.
Sales in Fine Dining increased 4.3% year over year to $402 million. Our estimate for the metric was $392.3 million. Comps in the segment rose 2.1% year over year compared with 0.8% reported in the previous quarter.
Sales in Other Business increased 3.2% year over year to $696.1 million. Our estimate for the metric was $719.9 million. Comps in the Other Business rose 3.9% year over year compared with a 3.1% rise reported in the previous quarter.
DRI’s Q3 Operating Highlights
In the fiscal third quarter, total operating costs and expenses increased 7.3% year over year to $2.93 billion. The increase was primarily due to higher food and beverage expenses, restaurant expenses, labor costs and marketing expenses. Our estimate for the metric was $2.87 billion.
DRI’s Balance Sheet
As of Feb. 22, 2026, cash and cash equivalents were $240.4 million compared with $240 million as of May 25, 2025.
During the fiscal third quarter, inventories were $345.3 million compared with $354.5 million reported in the previous quarter. As of Feb. 22, 2026, long-term debt was $2.14 billion compared with $2.13 billion as of May 25, 2025.
Darden’s FY26 Outlook
For fiscal 2026, the company expects total sales growth of approximately 9.5% (compared with the prior estimate of 8.5% to 9.3%), including approximately 2% growth related to the 53rd week. Same-restaurant sales growth in fiscal 2026 is anticipated to be approximately 4.5% year over year compared with the earlier estimate of 3.5% to 4.3%. Adjusted diluted EPS from continuing operations continues to be anticipated in the band of $10.57-$10.67 compared with the previous estimate of $10.50-$10.70.
Darden expects to open approximately 70 net new restaurants and a total capital spending of $750-$775 million in fiscal 2026.
DRI’s Zacks Rank & Key Picks
Darden currently carries a Zacks Rank #3 (Hold).
Some top-ranked stocks in the Zacks Retail-Wholesale sector have been discussed below.
Five Below, Inc. FIVE currently sports a Zacks Rank #1 (Strong Buy). You can see the complete list of today’s Zacks Rank #1 stocks here.
FIVE has a trailing four-quarter earnings surprise of 62.1%, on average. The Zacks Consensus Estimate for FIVE’s 2026 sales and EPS indicates growth of 22.4% and 25%, respectively, from the year-ago period’s levels.
Deckers Outdoor Corporation DECK presently flaunts a Zacks Rank of 1. DECK has a trailing four-quarter earnings surprise of 36.9%, on average.
The consensus estimate for DECK’s 2026 sales and EPS indicates growth of 8.9% and 8.5%, respectively, from the year-ago period’s levels.
Victoria's Secret & Co. VSCO currently sports a Zacks Rank of 1. VSCO has a trailing four-quarter earnings surprise of 55.1%, on average.
The Zacks Consensus Estimate for VSCO’s 2027 sales and EPS indicates growth of 6.2% and 15.7%, respectively, from the year-ago period’s levels.
Quantum Computing Stocks Set To Soar
Artificial intelligence has already reshaped the investment landscape, and its convergence with quantum computing could lead to the most significant wealth-building opportunities of our time.
Today, you have a chance to position your portfolio at the forefront of this technological revolution. In our urgent special report, Beyond AI: The Quantum Leap in Computing Power , you'll discover the little-known stocks we believe will win the quantum computing race and deliver massive gains to early investors.
Access the Report Free Now >>Want the latest recommendations from Zacks Investment Research? Today, you can download 7 Best Stocks for the Next 30 Days. Click to get this free report
Darden Restaurants, Inc. (DRI): Free Stock Analysis Report
Deckers Outdoor Corporation (DECK): Free Stock Analysis Report
Five Below, Inc. (FIVE): Free Stock Analysis Report
Victoria's Secret & Co. (VSCO): Free Stock Analysis Report
This article originally published on Zacks Investment Research (zacks.com).