Last week, major U.S. indexes witnessed their worst performance since the start of the conflict in the Middle East. The Nasdaq Composite, the S&P 500, and the Dow Jones Industrial Average fell 4.5%, 3.2%, and 2.3%, respectively, marking the fifth consecutive week of losses. High volatility and a sharp sell-off began as the ceasefire proposal by the United States was rejected by Iran. Market participants are now pricing in a sustained conflict, leading to fears of long-term disruption in the Persian Gulf.
Crude oil prices touched $100 per barrel. This spike has intensified concerns about "stagflation," a period of slowing economic growth paired with high inflation. Economic data painted a picture of a "low hire/low fire" labor market. While initial jobless claims remained steady at 210,000, actual job growth has been sluggish. Productivity for the fourth quarter of 2025 slowed to 1.8%, while unit labor costs jumped to 4.4%, the highest level in a year.
The housing market weakened, with mortgage applications down 10.5% as 30-year rates hit a year-to-date high of 6.43%. Meanwhile, consumer sentiment dropped to 53.3 in March from 56.6 in February, the lowest since last December. Investors remain cautious, weighing the stability of the economy against rising fuel and transportation costs.
Regardless of market conditions, we, here at Zacks, provide investors with unbiased guidance on how to beat the market.
As usual, Zacks Research guided investors over the past three months with its time-tested methodologies. Given the prevailing market uncertainty, you may want to look at our feats to prepare better for your next action.
Here are some of our key achievements:
Sandisk and Equinix Following Zacks Rank Upgrade
Shares of Sandisk Corporation SNDK have gained 30% (versus the S&P 500’s 8% decrease) since it was upgraded to a Zacks Rank #1 (Strong Buy) on Jan. 26.
Another stock, Equinix, Inc. EQIX, which was upgraded to a Zacks Rank #2 (Buy) on Jan. 28, has returned 19% (versus the S&P 500’s 8.8% decrease) since then.
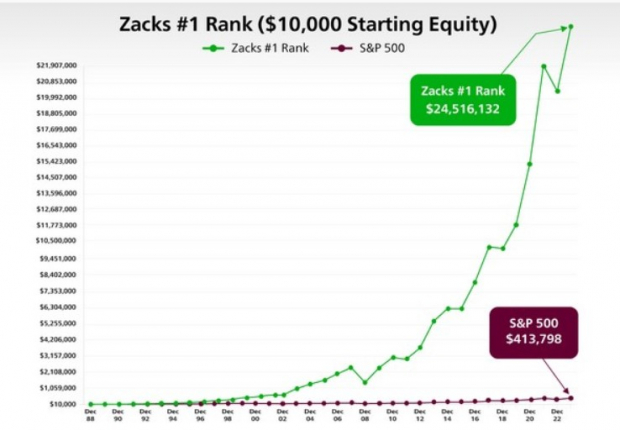
Zacks Rank, our short-term rating system, has earnings estimate revisions at its core. Empirical research shows a strong correlation between trends in earnings estimate revisions and near-term stock price movements.
An equal-weight portfolio of Zacks Rank # 1 stocks outperformed the equal-weight S&P 500 index by 7.7 percentage points in the year-to-date 2026 period (through March 3, 2026); The Zacks Rank #1 stocks returned +6.57% through March 3, while the equal-weight S&P 500 index lost -1.14% of its value.
In 2025, this hypothetical equal-weight portfolio returned +17.81% vs. +10.85% for the index, while performance comparison was +22.4% vs. +13.7% in 2024. Over the preceding 10-year period (2016 through 2025), this portfolio of qual-weight Zacks Rank #1 stocks outperformed the equal-weight S&P 500 index by more than 7 percentage points (+18.55% vs. +11.65%).
You can see the complete list of today’s Zacks Rank #1 stocks here >>>
Check Sandisk’s historical EPS and Sales here>>>
Check Equinix’s historical EPS and Sales here>>>
Image Source: Zacks Investment Research
Zacks Recommendation Upgrades Modine Manufacturing and Archrock
Shares of Modine Manufacturing Company MOD and Archrock, Inc. AROC have advanced 21.1% (versus the S&P 500’s 8.6% decrease) and 20.4% (versus the S&P 500’s 8.8% decrease) since their Zacks Recommendation was upgraded to Outperform on Jan. 30 and Feb. 3, respectively.
While the Zacks Rank is our short-term rating system that is most effective over the one- to three-month holding horizon, the Zacks Recommendation aims to predict performance over the next 6 to 12 months. However, just like the Zacks Rank, the foundation for the Zacks Recommendation is trends in earnings estimate revisions.
The Zacks Recommendation classifies stocks into three groups — Outperform, Neutral and Underperform. While these recommendations are determined quantitatively, our analysts have the flexibility to override them for the 1100+ stocks they closely follow based on their better judgment of factors such as valuation, industry conditions and management effectiveness than the quantitative model.
Zacks Focus List Stocks Cheniere Energy, Virtu Financial Shoot Up
Shares of Cheniere Energy, Inc. LNG, which belongs to the Zacks Focus List, have gained 53.5% over the past 12 weeks. The stock was added to the Focus List on Sept. 6, 2022. Another Focus-List holding, Virtu Financial, Inc. VIRT, which was added to the portfolio on July 31, 2023, has returned 25.2% over the past 12 weeks. The S&P 500 has declined 7.7% over this period.
The 50-stock Focus List portfolio returned +6.65% in 2026 (through February 28) vs. +0.68% for the S&P 500 index and +7.06% for the equal-weight version of the index.
The portfolio returned +22.1% in 2025 vs. +17.9% for the S&P 500 index and +11.4% for the equal-weight version of the index.
The Zacks Focus List portfolio returned +18.41% in 2024 vs. +25.04% for the S&P 500 index and +13% for the equal-weight S&P 500 index. The portfolio had returned +29.54% in 2023 vs. +26.28% for the S&P 500 index and +13.61% for the equal-weight S&P 500 index. In 2022, the portfolio returned -15.2% vs. the S&P 500 index’s -17.96%.
Through February 28, 2026, the portfolio’s rolling returns on a one-year, three-year, five-year, ten-year, and since 2004 have been +29.35% (vs. +17% for the S&P 500 index), +23.13% (vs. +21.81%), +14.15% (vs. +14.19%), +16.79% (vs. +15.50%) and +12.38% vs. (+10.66%), respectively.
Unlock all of our powerful research, tools and analysis, including the Focus List, Zacks #1 Rank List, Equity Research Reports, Zacks Earnings ESP Filter, Premium Screener and more, as part of Zacks Premium. Gain full access now >>
Zacks ECAP Stocks Costco & Church & Dwight Make Significant Gains
Costco Wholesale Corporation COST, a component of our Earnings Certain Admiral Portfolio (ECAP), has jumped 13.7% over the past 12 weeks. Church & Dwight Co., Inc. CHD has followed Costco Wholesale with 12.1% returns.
The Zacks Earnings Certain Admiral Portfolio (ECAP), which consists of 30 concentrated, ultra-defensive, long-term Buy-and-Hold stocks, returned -2.3% in the fourth quarter of 2025 vs. the S&P 500 index’s +2.7% gain (SPY ETF). For 2025 as a whole, the portfolio returned -1.67% vs. +17.9% gain for the S&P 500 index.
For the year 2024, the portfolio returned +16.26% vs. +24.89% for the S&P 500 index (SPY ETF). In 2023, the portfolio returned +12.17% vs. +26.28% for the S&P 500 index. The portfolio returned -4.7% in 2022 vs. the S&P 500 index’s -17.96%.
With little to no turnover and annual rebalance periodicity, ECAP seeks to minimize capital loss by holding shares of companies whose earnings streams exhibit a proven 20+ year track record of surviving recessionary periods with minimal impact on aggregate earnings growth relative to the overall S&P 500.
The ECAP and many other model portfolios are available as part of Zacks Advisor Tools, a cloud-based solution to access Zacks award-winning stock, mutual fund and ETF research. Click here to schedule a demo.
Zacks ECDP Stocks Quest Diagnostics and Fastenal Company Outperform Peers
Quest Diagnostics Incorporated DGX, which is part of our Earnings Certain Dividend Portfolio (ECDP), has returned 11.4% over the past 12 weeks. Another ECDP stock, Fastenal Company FAST, has also climbed 10% over the same time frame. Of course, the inclination of investors toward quality dividend stocks to secure an income stream amid heightened market volatility contributed to this performance.
Check Quest Diagnostics‘s dividend history here>>>
Check Fastenal Company's dividend history here>>>
With an extremely low beta and a history of minimum earnings variability over the last 20+ years, this 25-stock portfolio helps to significantly mitigate risk.
The Zacks Earnings Certain Dividend Portfolio (ECDP) returned -2.1% in 2025 Q4 vs. the S&P 500 index’s +2.7% gain and the Dividend Aristocrats ETF’s (NOBL) +1.6% return. For 2025, the portfolio returned -0.6% vs. +6.8% gain for the Dividend Aristocrat ETF.
For the full year 2024, the portfolio returned +6.95% vs. +24.89% for the S&P 500 index and +6.72% for NOBL.
The portfolio returned -0.9% in 2023 vs. +26.28% for the S&P 500 index and +8.11% for NOBL. The portfolio returned -2.3% in 2022 vs. -17.96% for the S&P 500 index and -8.34% for NOBL.
Click here to access this portfolio on Zacks Advisor Tools.
Zacks Top 10 Stock Carpenter Technology Delivers Solid Returns
Carpenter Technology Corporation CRS, from the Zacks Top 10 Stocks for 2026, has jumped 11.4% since the list was released on Jan. 5, 2026, compared with the S&P 500 index’s 7.2% decrease during this period.
The Top 10 portfolio retuned +10.5% in 2026 (through February 28) vs. +0.5% for the S&P 500 index and +6.3% for the equal-weight version of the index.
The Top 10 portfolio returned +22.6% in 2025 vs. +17.9% for the S&P 500 index and +11.4% for the equal-weight version of the index.
The Top 10 portfolio returned +62.98% in 2024, vs. +25.04% for the S&P 500 index and +13% for the equal-weight version of the index. The portfolio had returned +25.15% in 2023 vs. +26.28% for the S&P 500 index.
Through the end of February 2026, the Top 10 portfolio has produced a cumulative return of +2,761.6% since 2012 vs. +564.8% for the S&P 500 index and +435% for the equal-weight version of the index. The portfolio has produced an average annual return of +26.4% in the period 2012 through February 28, 2026 vs. +13% for the S&P 500 index and +11% for the equal-weight version of the index.
Free Report: Profiting from the 2nd Wave of AI Explosion
The next phase of the AI explosion is poised to create significant wealth for investors, especially those who get in early. It will add literally trillion of dollars to the economy and revolutionize nearly every part of our lives.
Investors who bought shares like Nvidia at the right time have had a shot at huge gains.
But the rocket ride in the "first wave" of AI stocks may soon come to an end. The sharp upward trajectory of these stocks will begin to level off, leaving exponential growth to a new wave of cutting-edge companies.
Zacks' AI Boom 2.0: The Second Wave report reveals 4 under-the-radar companies that may soon be shining stars of AI’s next leap forward.
Access AI Boom 2.0 now, absolutely free >>Want the latest recommendations from Zacks Investment Research? Today, you can download 7 Best Stocks for the Next 30 Days. Click to get this free report
Equinix, Inc. (EQIX): Free Stock Analysis Report
Fastenal Company (FAST): Free Stock Analysis Report
Quest Diagnostics Incorporated (DGX): Free Stock Analysis Report
Sandisk Corporation (SNDK): Free Stock Analysis Report
Costco Wholesale Corporation (COST): Free Stock Analysis Report
Church & Dwight Co., Inc. (CHD): Free Stock Analysis Report
Carpenter Technology Corporation (CRS): Free Stock Analysis Report
Cheniere Energy, Inc. (LNG): Free Stock Analysis Report
Modine Manufacturing Company (MOD): Free Stock Analysis Report
Virtu Financial, Inc. (VIRT): Free Stock Analysis Report
Archrock, Inc. (AROC): Free Stock Analysis Report
ProShares S&P 500 Dividend Aristocrats ETF (NOBL): ETF Research Reports
This article originally published on Zacks Investment Research (zacks.com).