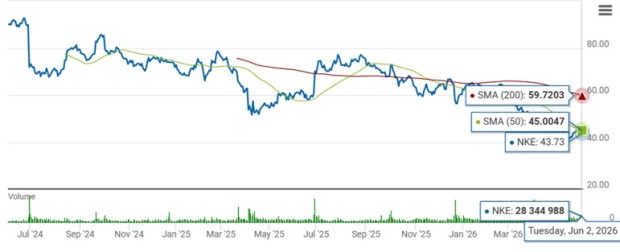
Shares of NIKE Inc. NKE have come under pressure in recent months, losing momentum and slipping below the key industry benchmarks, an indication of weakening technical strength and a growing bearish bias. The stock yesterday breached an important support level, falling below its 50-day simple moving average (SMA). On June 2, 2026, NKE closed at $43.73, notably under its 50-day SMA of $45, reinforcing the negative short-term trend.
A stock’s move below the 50-day SMA is generally viewed as a sign of weakening momentum, often pointing to a shift from short-term bullishness to bearish sentiment. For NKE, the breach underscores fading investor confidence and softer buying interest, particularly after months of underperformance.
The sportswear behemoth moved below its 200-day SMA in January 2026 and continues to trade below the mark since then, indicating a long-term downward trend.
SMA is an essential tool in technical analysis that helps investors evaluate price trends by smoothing out short-term fluctuations. This approach also provides a clearer perspective on a stock's long-term direction.
NKE Stock Trades Below 50 & 200-Day SMAs
Image Source: Zacks Investment Research
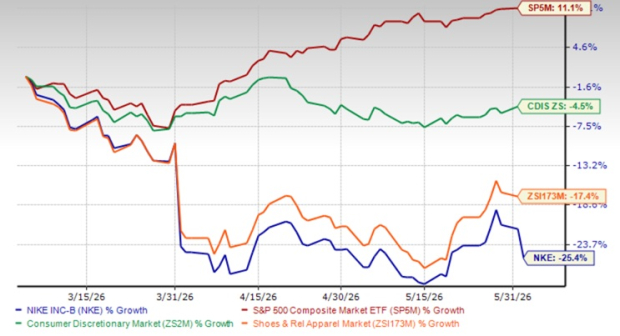
NIKE has delivered a lackluster performance, with its shares declining 25.4% in the past three months, wider than the Zacks Shoes and Retail Apparel industry’s 17.4% fall. The NKE stock has also lagged the broader Zacks Consumer Discretionary sector’s slip of 4.5% and sharply underperformed the S&P 500’s 11.1% rally during the same period.
NKE’s performance is notably weaker than that of its competitors, Carter’s Inc. CRI, adidas AG ADDYY and Caleres Inc. CAL, which have rallied 13%, 17% and 24.7%, respectively, in the past three months.
NIKE’s 3-Month Price Performance
Image Source: Zacks Investment Research
At its current price of $43.73, the NKE stock trades 5.8% above its 52-week low mark of $41.35 and 45.5% below its 52-week high mark of $80.17.
Here’s Why NIKE Stock Is Struggling
Despite showing signs of progress in select categories, NIKE continues to face significant fundamental challenges that are weighing on its stock performance. The company remains in the midst of a broad turnaround effort, with management acknowledging that the recovery is taking longer than anticipated. A key headwind has been the intentional reduction of excess inventory, particularly within its classic footwear franchises, which created an estimated five-percentage-point drag on quarterly results as the company prioritized marketplace health over near-term sales growth.
Another concern is the persistent weakness in NIKE Sportswear, which declined at a low-double-digit rate in the third quarter of fiscal 2026 and continues to offset strength in performance categories, such as running. Management noted that elevated promotions and slower-than-expected sell-through rates across key markets have pressured revenue growth and profitability.
Geographically, Greater China remains a major challenge. Revenues in the region fell 10% in the fiscal third quarter, and NIKE expects further pressure as it intentionally reduces wholesale shipments and clears excess inventory to restore pricing discipline.
Profitability has also been affected by external pressures, including higher tariffs in North America and elevated markdown activity across digital channels. The gross margin contracted 130 basis points in the quarter, while restructuring efforts resulted in a $230-million severance charge. Although management remains confident that its “Win Now” strategy will eventually restore sustainable growth, investors appear concerned about the prolonged recovery timeline, and the continued pressure on sales and margins.
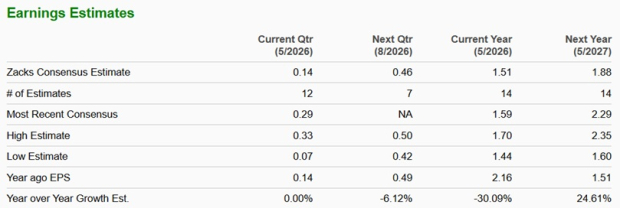
Here’s How Estimates Are Shaping for NKE
The Zacks Consensus Estimate for NIKE’s fiscal 2026 and 2027 EPS was unchanged in the last 30 days. For fiscal 2026, the Zacks Consensus Estimate for NKE’s revenues implies 0.1% year-over-year growth, while the estimate for EPS suggests a 30.1% decline. The consensus mark for fiscal 2027 revenues and earnings indicates 1% and 24.6% year-over-year growth, respectively.
Image Source: Zacks Investment Research
NIKE’s Valuation Picture
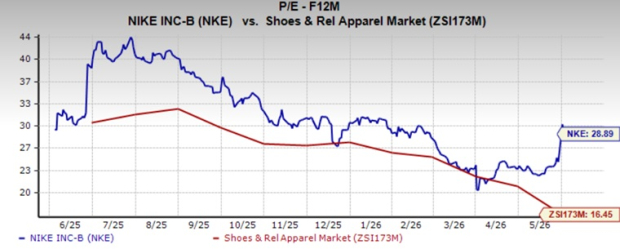
While NIKE remains fundamentally strong, backed by its decisive actions to reposition itself for sustainable and profitable long-term growth, its current forward 12-month price-to-earnings (P/E) multiple of 28.89X raises concerns about whether the stock's valuation is justified. This multiple is higher than the Zacks Shoes and Retail Apparel industry average of 16.45X and the S&P 500’s average of 22.23X, making the stock appear relatively expensive.
At 28.89X P/E, the Swoosh brand owner is trading at a much higher valuation than its competitors. Its peers, such as Carter’s, Caleres and adidas, are delivering solid growth and trade at more reasonable multiples. Carter’s, Caleres and adidas have forward 12-month P/E ratios of 12.62X, 8.21X and 15.98X — all significantly lower than NIKE. At such levels, NKE’s valuation seems out of step with its growth trajectory, especially given the recent decrease in its stock price.
Image Source: Zacks Investment Research
Should You Avoid NIKE Stock?
NIKE remains a strong global brand, but its near-term outlook appears pressured. The stock’s continued move below the 50- and 200-day SMAs signals a sustained downtrend, and reflects weak investor sentiment. Fundamental challenges, including Sportswear weakness, inventory cleanup, Greater China pressure, tariff headwinds and elevated promotions, continue to weigh on sales and margins.
Meanwhile, NKE’s premium forward P/E multiple looks expensive relative to its industry, the S&P 500 and key peers. Given the weak technical setup and stretched valuation, investors may prefer to wait for clearer signs of recovery before considering this Zacks Rank #5 (Strong Sell) stock.
You can see the complete list of today’s Zacks #1 Rank (Strong Buy) stocks here.
7 Best Stocks for the Next 30 Days
Just released: Experts distill 7 elite stocks from the current list of 220 Zacks Rank #1 Strong Buys. They deem these tickers "Most Likely for Early Price Pops."
Since 1988, the full list has beaten the market more than 2X over with an average gain of +23.9% per year. So be sure to give these hand picked 7 your immediate attention.
See them now >>Want the latest recommendations from Zacks Investment Research? Today, you can download 7 Best Stocks for the Next 30 Days. Click to get this free report
NIKE, Inc. (NKE): Free Stock Analysis Report
Adidas AG (ADDYY): Free Stock Analysis Report
Carter's, Inc. (CRI): Free Stock Analysis Report
Caleres, Inc. (CAL): Free Stock Analysis Report
This article originally published on Zacks Investment Research (zacks.com).