
I think a lot about fixed income for three reasons:
The biggest part of my portfolio is a bond ladder. We right now have access to the highest yields in a generation. I am uniquely qualified to educate retail investors on fixed income.Plus, the narrative surrounding fixed income is entirely one-dimensional. Analysts stare at the nominal yields of the 10-Year U.S. Treasury Note or compare standard consumer price index (CPI) prints to project what the Federal Reserve will do with its policy rate.
More Yield, Less Trap: Sign up free to get Barchart’s daily Dividend Investor newsletter straight to your inbox.
But if you want to understand why corporate profit margins are tightening across 90% of the stock market and why long-term bonds are a far riskier asset class than the consensus believes, you have to look past the headlines. You have to understand the interplay between the Atlanta Fed’s Sticky-Price CPI, nominal bond rates, and real mathematical yields.
The market is currently trapped.
This is because nominal yields (those which do not include inflation impacts) look high enough to provide a comfortable income cushion, but underneath the surface, structural inflation is quietly eating bond investors alive. For someone like me that is front and center, even though most of the bonds do not mature for a very long time. So inflation may not be anywhere near the current level. That’s also why I hedge my bond ladder.
What Is Sticky-Price CPI (And Why Does It Matter)?
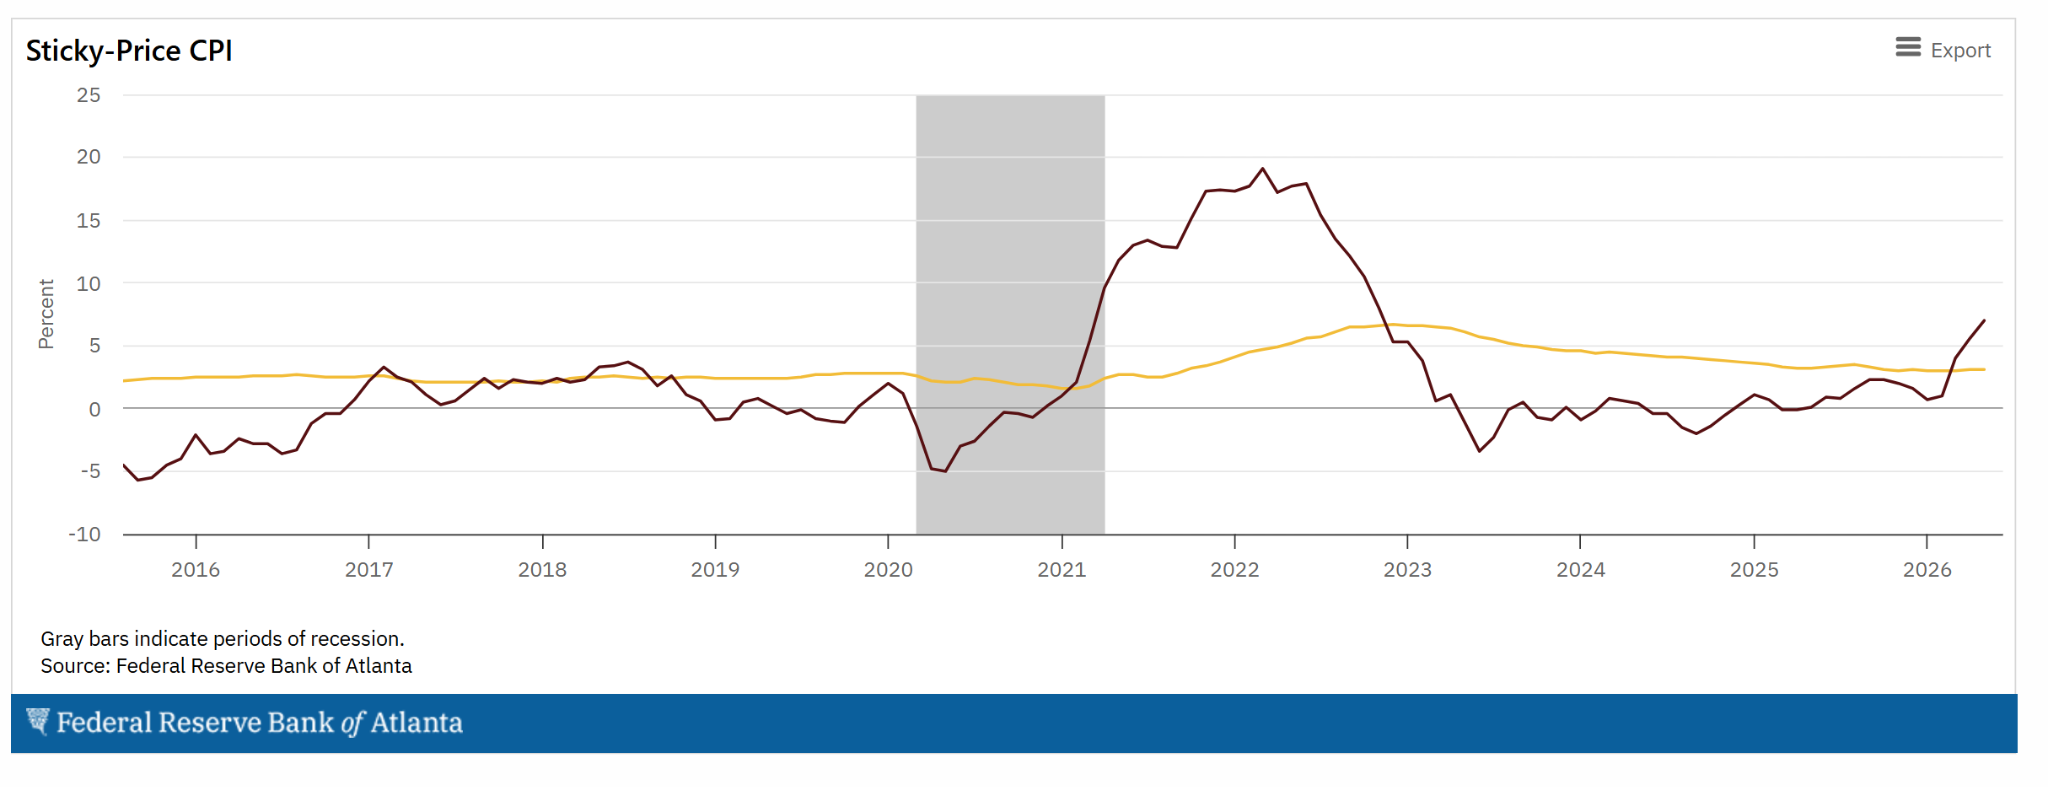
The Federal Reserve Bank of Atlanta divides the components of the Consumer Price Index into two distinct baskets based on how often their prices change: flexible prices and sticky prices.
Flexible-price items (like gasoline, fresh food, and wholesale commodities) change prices frequently—often daily or weekly. They react instantly to short-term geopolitical supply shocks, like maritime bottlenecks or energy flare-ups. Sticky-price items (like rent, medical care services, insurance, and corporate service contracts) are incredibly slow to adjust. On average, these prices take more than four months to change.Because sticky prices take a massive amount of economic momentum to move, once they start tracking upward, they behave like a runaway freight train. They don’t care about short-term interest rate tweaks or performative central bank statements. They represent the deeply embedded, structural cost of doing business and living in the real economy.
When the Atlanta Fed’s Core Sticky-Price CPI remains pinned above 3% year over year and continues to print uncomfortably high annualized monthly numbers, it tells us that the initial wave of transitory inflation has successfully embedded itself into the structural landscape of the economy. Prices are quickly marked up on the way up, but they are notoriously sticky on the way back down.
The “Real” Story Few Understand
This brings us to the bond market’s fundamental mispricing. A bond investor looks at a 10-year Treasury yield and evaluates it purely on a nominal basis. They assume that if they lock in a fixed return while top-line flexible commodity prices fluctuate, they are securing a reliable piece of income.
But your true wealth-compounding power isn’t dictated by nominal rates. It is dictated by real yields (nominal interest rates minus structural inflation).
Real Yield = (Nominal Bond Rate) - (Inflation$$)
When structural inflation, accurately tracked by Sticky-Price CPI, refuses to revert to the Federal Reserve’s arbitrary 2% target, the mathematical reality of fixed-income assets changes completely. If you are holding a fixed nominal bond rate while the underlying, non-negotiable costs of corporate operations, labor, rent, and insurance are rising at a sticky 3.1% clip, your real inflation-adjusted yield is being systematically eroded.
This creates a real challenge for the standard ways so many investors and financial advisors create investment portfolios. Because structural sticky prices refuse to fall, the Federal Reserve has no economic leeway to cut rates. No matter what new Fed Chair Kevin Warsh and President Donald Trump may discuss.
Furthermore, nominal bond yields are forced to remain elevated or move higher to demand a greater risk premium. If you are holding long-duration nominal bonds, a sticky, high-for-longer rate environment means your bond principal faces ongoing capital losses as yields adjust upward. You are absorbing 100% of the downside price volatility of the bond market while your real, inflation-adjusted purchasing power gets slowly ground down to zero.
This is why, although my bond ladder is my financial pride and joy, I keep a close eye on it. Because inflation could threaten to reduce the returns over a longer period of time.
I talked here recently about the Direxion Daily 20 Year Treasury Bear 3X ETF (TMV), an ETF I use to take a leveraged approach to hedging the risk of higher rates to that bond portfolio. Mind you, it is not a risk of not getting my money back at maturity, but a risk of how much “stuff” I can buy with those dollars after inflation has had its way with that capital.
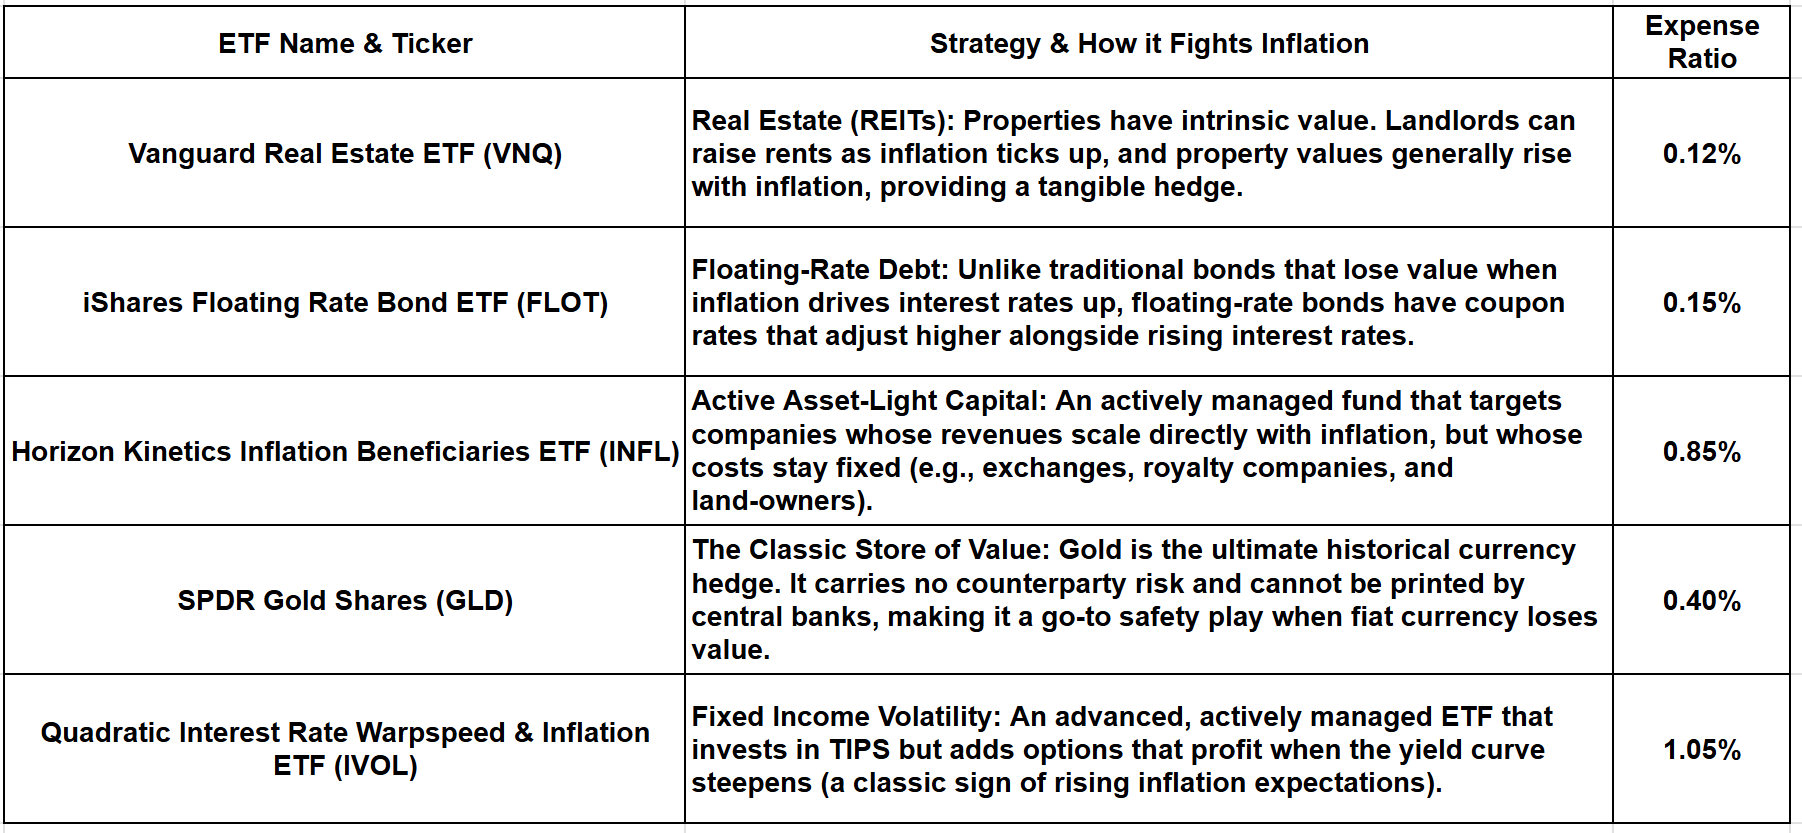
There are some alternatives to the bond ladder approach I’ve chosen for the long run for my family. Here’s a table I put together containing some of the more commonly used ETFs that could play a similar role in your portfolio.
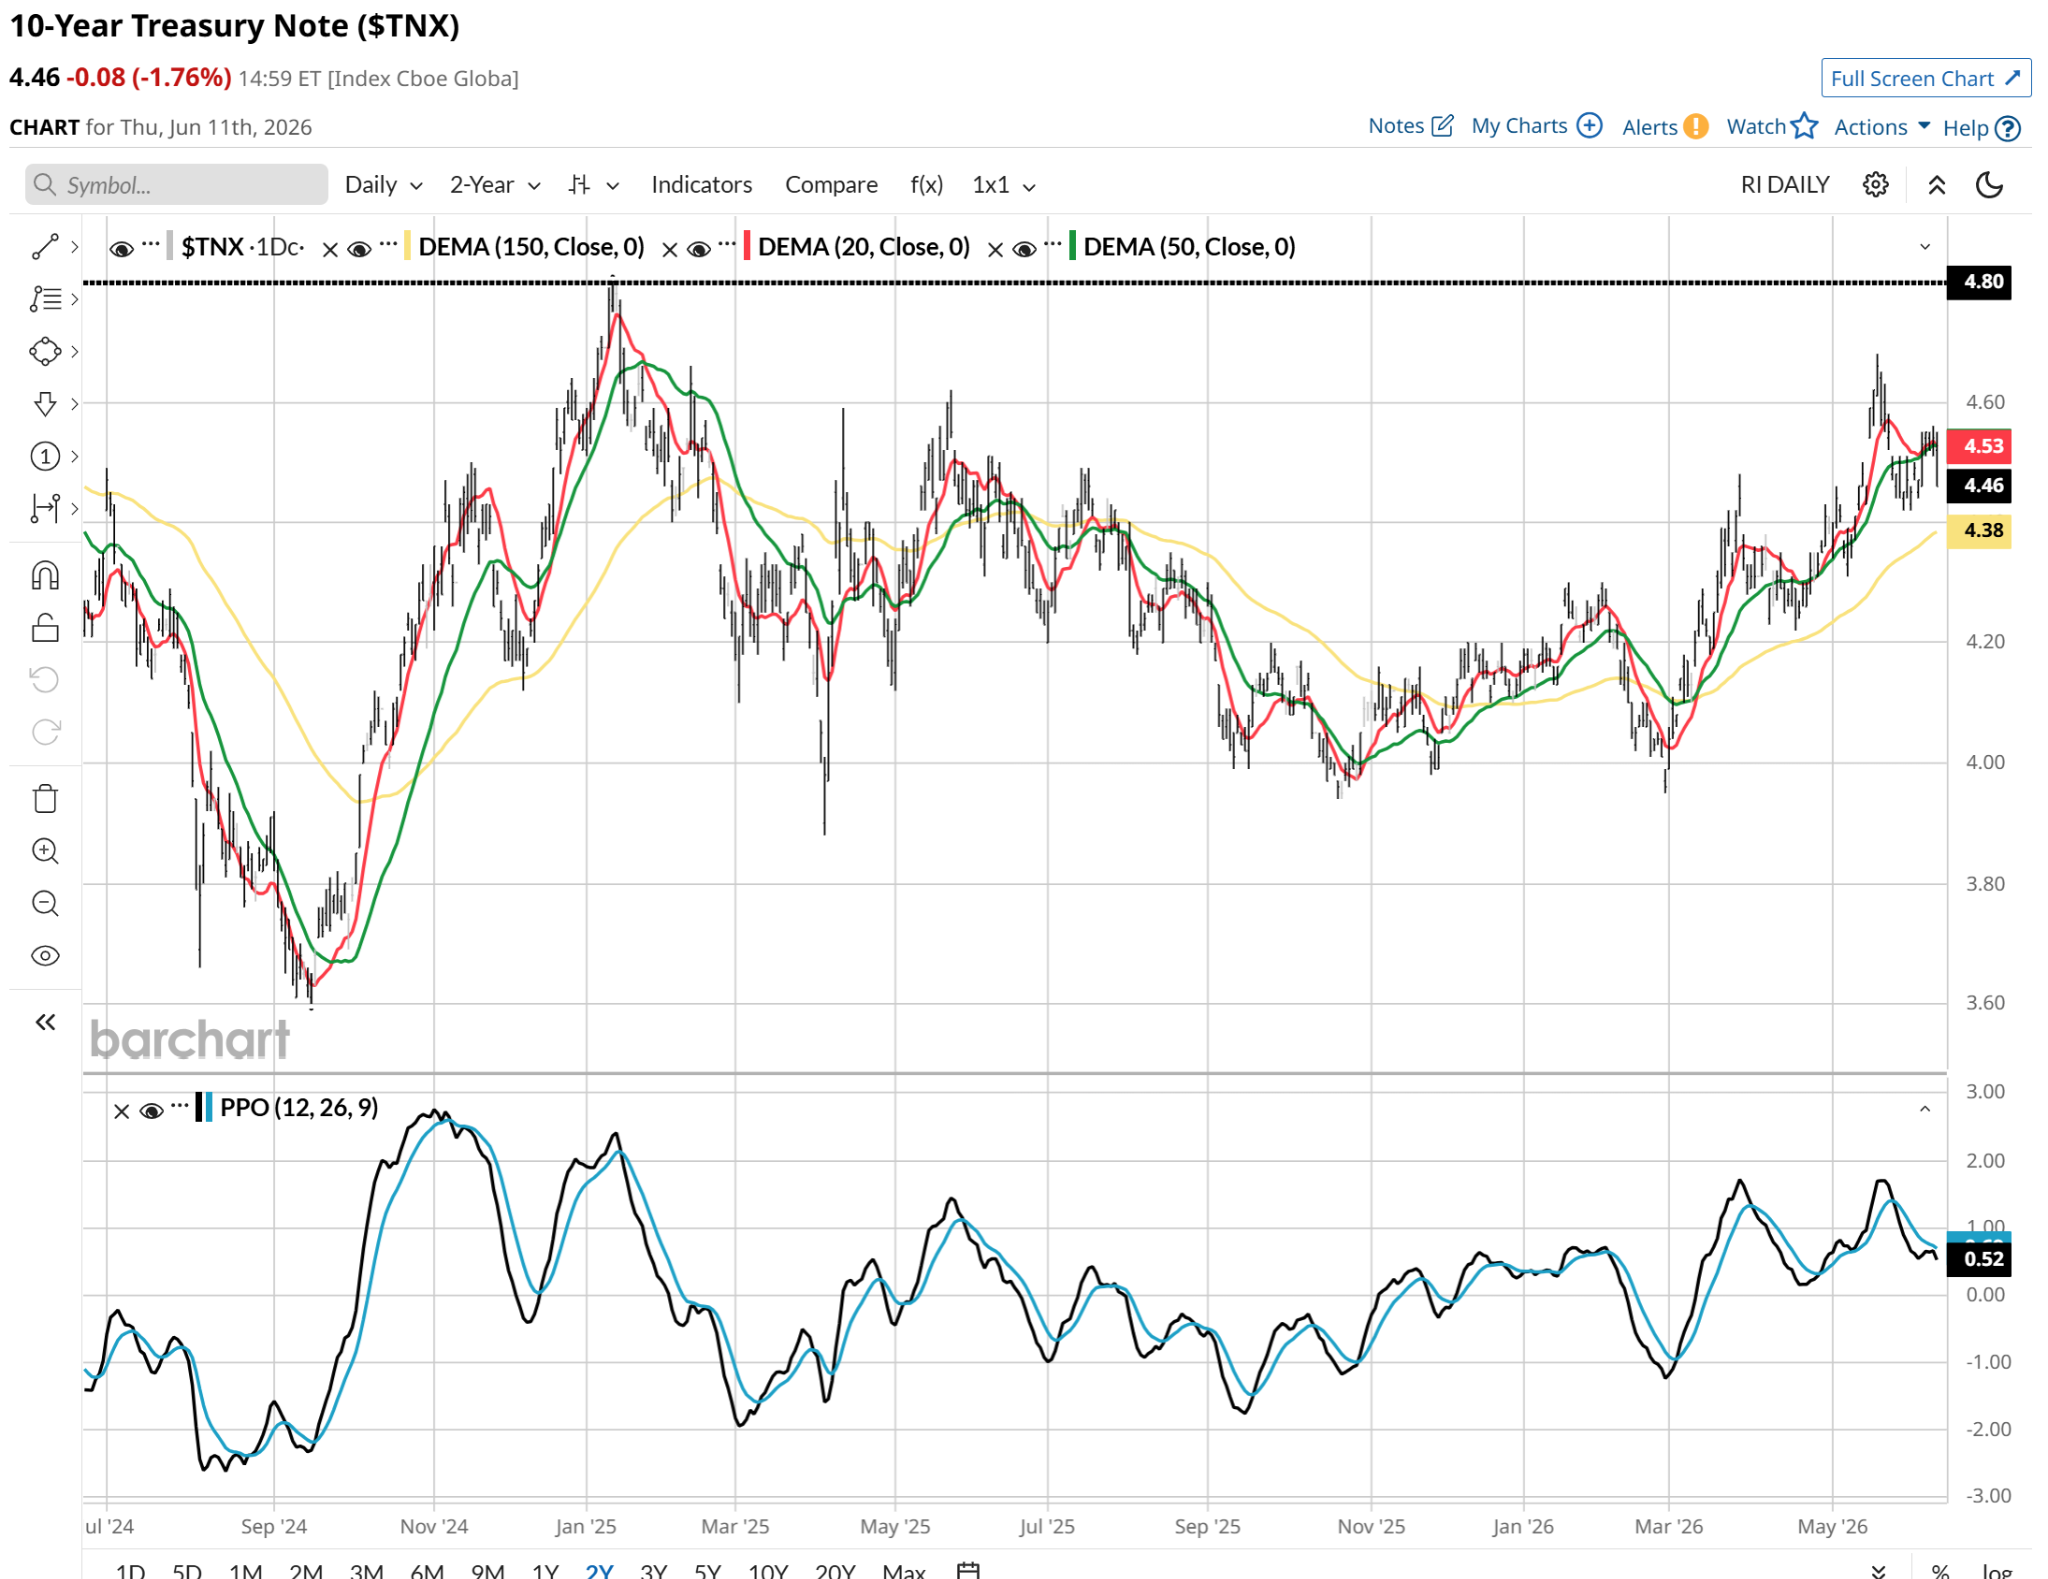
Now, we never know, but a current view of the 10-year U.S. Treasury bond yield at least hints at this not being an issue for a while. See that percentage price oscillator (PPO) on the far right, bottom of that chart? If that continues to duck lower, taking the actual bond yield with it, we ladder fans will get a reprieve. Less need to spend money hedging that bond portfolio if rates are falling. Because that means bond prices are rising.
 www.barchart.com
 Case in point: on Thursday, the S&P 500 Index flew higher by 1.7%. The top 50 stocks by size, as tracked by the Invesco S&P 500 Top 50 ETF (XLG), hyper-loaded with mega-cap companies, gained about 1.0%. But my bond ladder was up similarly, around 1.1%, at least based on the iShares 10-20 Year Treasury Bond ETF (TLH), which I use as a proxy.
It is only one day, but this happens a lot. The risk of the stock market rising with each passing week. Thus, the appeal of a portfolio that has a nearly 5% fixed return with upside if rates fall, and which I can count on to receive what is effectively a “second social security” lump sum each year, is high. It is there for the taking. And I took it. Hopefully you’ll consider taking it too.
Rob Isbitts created the ROAR Score, based on his 40+ years of technical analysis experience. ROAR helps DIY investors manage risk and create their own portfolios. For Rob’s written research, check out ETFYourself.com.
On the date of publication, Rob Isbitts did not have (either directly or indirectly) positions in any of the securities mentioned in this article. All information and data in this article is solely for informational purposes. For more information please view the Barchart Disclosure Policy here.
More news from Barchart
‘Sticky CPI’ Is a Silent Portfolio Killer. How You Can Protect Yourself Right Now. Home Depot or Lowe’s: 1 Has Raised Its Dividend for 50+ Years. The Other Pays More Now This Analyst Just Upped the Price Target on Carnival Stock. Here’s Why. Markets Are Overreacting to Kevin Warsh. Where the Panic Is Coming From and Why a New Fed Chair Isn’t That Bad.