

Nvidia (NVDA) is back in the news again, this time for positive reasons. Thanks to a strong third-quarter earnings report — featuring a top-and-bottom-line beat along with a surprise revenue guidance bump — NVDA stock looks set for a sizable pop to start the midweek session. I don’t want to focus too much on the print as I’m sure my Barchart colleagues will expertly handle that load. Instead, I’d like to tackle the quantitative angle.
In other words, how should options traders manage Nvidia stock over the near term?
Can’t Get Enough Options?: Join the list for Barchart’s daily unusual options report, delivered free.
Of course, the elephant in the room has been the recently ousted CEO Jensen Huang. With Nvidia effectively representing the heart and soul of artificial intelligence — and with the semiconductor giant involved in myriad deals and partnerships bolstering the burgeoning AI ecosystem — the controversy surrounding his exit prompted serious anxieties.
Yes, the primary concern has centered on NVDA stock, obviously. But the escalating drama raised questions about ancillary endeavors. The latest Q3 report provided a necessary credibility boost to right the ship, providing confidence for the contrarian position.
Ultimately, that brings us to the quantitative case for Nvidia stock. Over the trailing month, NVDA has uncharacteristically lost more than 28%, indicating clearly that the stock is firmly in a bearish state. Fortunately for the bulls, historical data suggests that a transition to a bullish state is the more likely statistical outcome over the next several weeks.
To be sure, there are no guarantees in the equities market. An inductive inference, such as a tendency to spark a bearish-to-bullish-state transition, is still induction, which generalizes a specific signal to form a probabilistic principle. Deduction, on the other hand, makes a logically necessary conclusion.
There’s nothing necessary about Nvidia stock moving higher from here but there appears to be compelling evidence to bank on this possibility.
Making an Inductive Case for NVDA Stock
As mentioned above, the natural question for options traders is as follows: what is the generalization of a specific signal of Nvidia stock from which we can form a probabilistic principle? To better answer this inquiry, we need to change the format of how we perceive NVDA.
Rather than analyze individual share prices — which run as a continuous scale with no theoretical upside limit — we need to frame NVDA stock as discrete categories, specifically in a binary nomenclature. For example, in the past two months, Nvidia has printed 10 weekly candlesticks. Of this tally, only three of the candlesticks were positive sessions (where Friday’s close was higher than Monday’s open).
That’s a specific signal, where the ratio of negative weekly sessions to positive ones is seven-to-three. This ratio is quite rare — as you would expect from a powerhouse like Nvidia stock — having only materialized 15 times on a rolling basis over the past five years.
Nevertheless, what’s fascinating about this ratio is that, when it occurs in the technical charts, the market tends to respond positively to NVDA stock over the next 10 weeks. When extrapolating the typical response pattern to Tuesday’s closing price of $155.46, an inductive analysis suggests that there’s about a 40% chance of NVDA stock exceeding the $170 price level on the expiration date for the December monthly options chain.
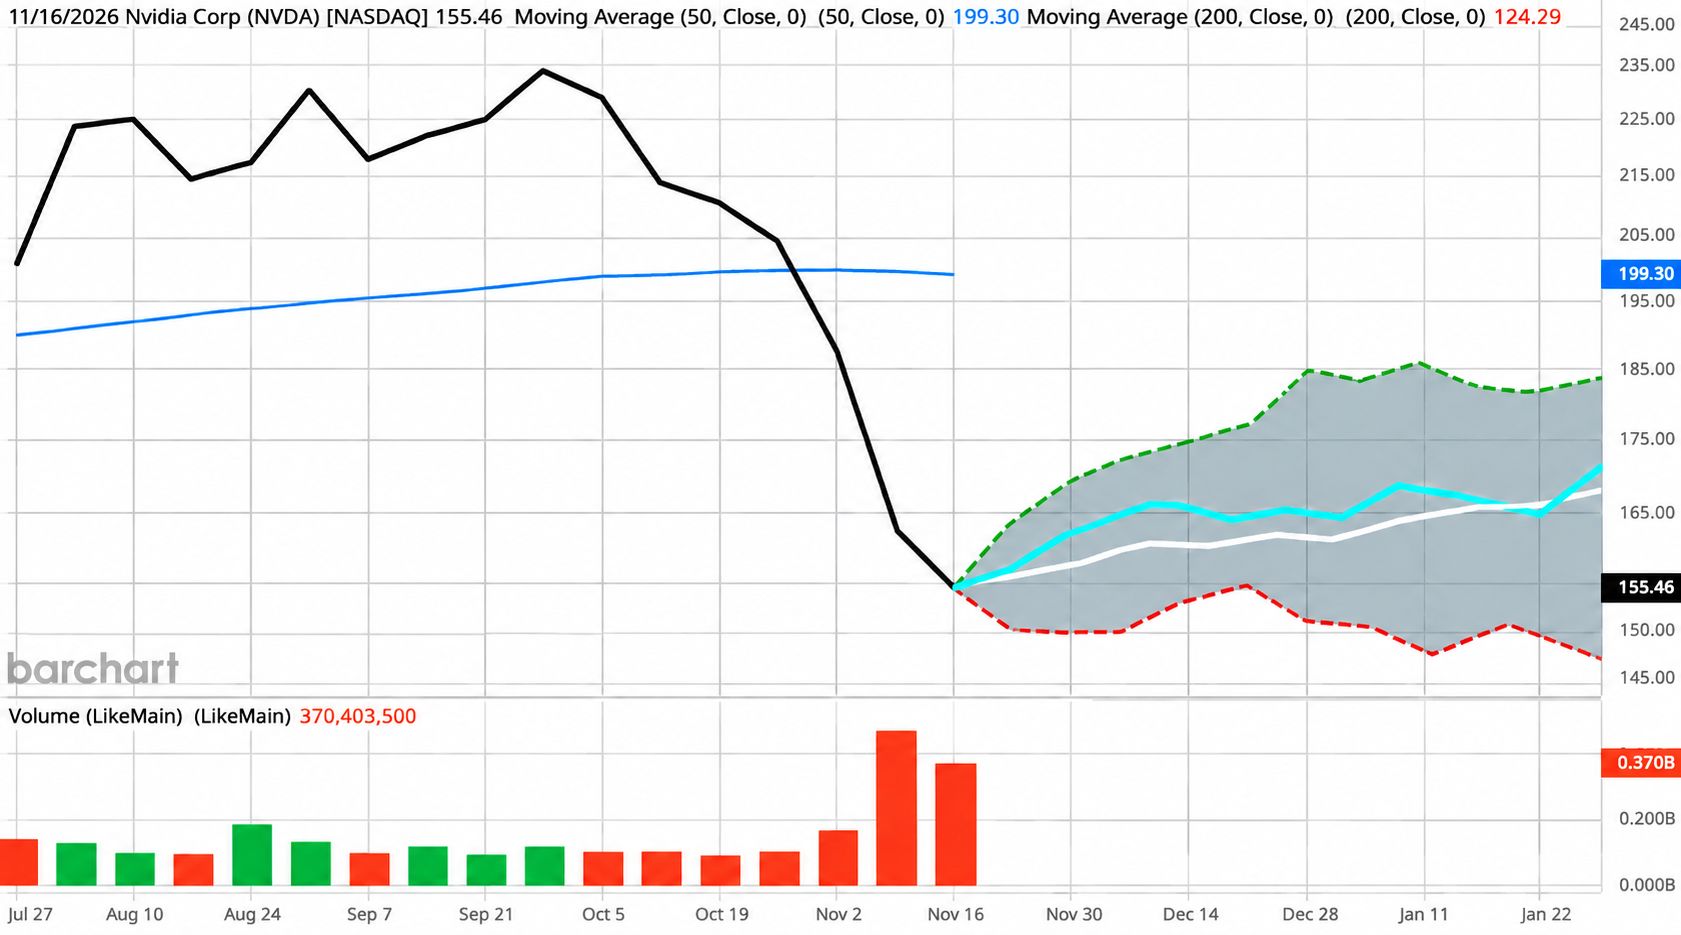
To reiterate, this generalized forecast assumes an extrapolation from the Tuesday close as I don’t know what the actual Wednesday opening price will be at time of writing. But you can use the numbers above as a reference point of what has been the typical response following the 7-to-3 ratio.
If the trend materializes as typically observed, a compelling idea would be to consider the 165/170 bull call spread expiring Dec. 18.
A Favorable EV Calculation Sweetens the Pot for Nvidia Stock
Even if we find a compelling trading idea, we need to have objective benchmarks to have confidence that the deal is actually a good one. Again, benchmarks don’t guarantee success but they help improve the probability of making smarter decisions. Ultimately, that’s why I believe the expected value formula is perhaps the most important tool for the debit-side options trader.
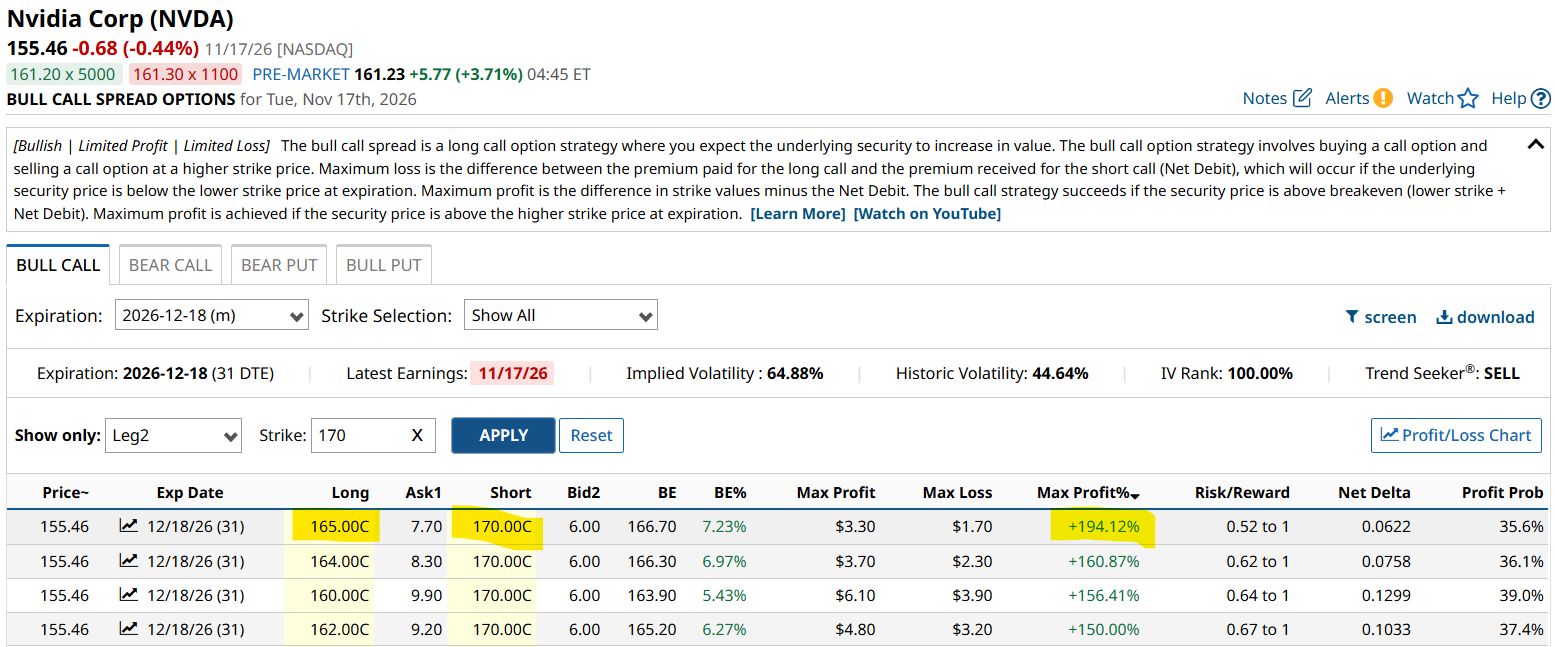
Let’s consider the key stats of the above 165/170 bull spread (as they were listed on Tuesday):
Net debit (upfront cost) of $170. Maximum payout (American-style odds) of 194.12%. Win probability of 40% (calculated from an inductive inference) of 40%.Plug these numbers into an EV calculator and you get an expected value of $30 or a return on capital (ROC) of 17.65%. Basically, we’re limiting the cash we put up while maximizing the payout given a reasonable win probability.
Sure, there are spreads that offer a higher payout but with a much lower probability. There are also higher-probability trades but are expensive and offer only modest upside rewards — often asymmetric (below 100%) against you. Such trades usually exhibit negative EV (and thus negative ROC), despite having possession of a single remarkable statistic.
With an EV-balanced trade, we only filter for the good deals and ignore the bad ones. I’ll reiterate for the third time: this does not guarantee success. What it does do, however, is focus your attention on efficient trades. That’s why the 165/170 December bull spread deserves close attention for those seeking a quick turnaround.
On the date of publication, Josh Enomoto did not directly have a position in any of the securities mentioned in this article. All information and data in this article is solely for informational purposes. For more information please view the Barchart Disclosure Policy here.
More news from Barchart
A Strong Q3 Puts Nvidia (NVDA) Stock on Track for a Quick 194% Options Payout Turn Coca-Cola into an Income Machine with This Options Play Higher Volatility Just Took the Fun Out of Buying Options. It Might Be Time to Shift to Leveraged ETFs The Dow Tests Its 200-Day Moving Average Ahead of Nvidia Earnings. 5 More Levels to Watch for the Blue-Chip Benchmark.