


Copper fell 2.68% on October 22, breaking an April support trendline that had held through five tests. The drop came two days after BloombergNEF warned of a copper supply deficit reaching 44% of demand by 2050.
Yet the same report rates the 2026 copper market in surplus. Traders appear to be pricing that near-term cushion, not the long-term gap.
Why Is Copper the Odd One Out?
BloombergNEF (BNEF) published its annual Transition Metals Outlook on October 20. Nine of the 10 materials it covers should have enough supply through 2050.
Copper is the exception. BNEF projects a 20 million tonne shortfall by 2050, starting as early as 2028.
Demand is set to climb 61% to nearly 46 million tonnes a year. Electrified transport alone accounts for 11.4 million.
Closing the gap would take $332 billion in new mines. Each one needs about 17 years to start producing, according to BNEF.
Martin Tengler, BNEF's head of metals and mining, framed it as a timing problem.
"The challenge now is less about whether the world can produce enough metals overall, and more about whether the right materials will be available when and where they are needed."
The metal exists. The US Geological Survey (USGS) puts global reserves near 980 million tonnes.
Copper needs $ 332bn of new mines.
— Jack Prandelli (@jackprandelli) October 20, 2026
Each one takes about 17 years to build.
Bloomberg new outlook sees a deficit starting in 2028 and widening to 20 million tonnes by 2050.
That’s about 44% of demand.
9 of the 10 transition metals it tracks now look covered. Copper is the odd… pic.twitter.com/fRAzWMLowS
Why Did Copper Fall Anyway?
BNEF's own scorecard also holds a sideways 12-month price view for copper.
Physical flows agree. London Metal Exchange (LME) copper stocks rose to 272,950 tonnes, the highest since July 24, Reuters reported.
Most new metal landed in US warehouses. Comex, the main US futures exchange, slipped to a discount against the LME, erasing its tariff-driven premium.
Alastair Munro, senior metals strategist at broker Marex, linked the two.
"...the recent build in LME copper stocks was the result of the COMEX premium shrinking as contract delivery dates draw closer."
A tech-stock selloff over AI doubts added pressure, dragging LME copper to a five-week low.
Copper Supply Deficit: What's Next for XCU Price?
The breakdown confirms the risk flagged during copper's fifth support test this week.
The trendline formed the base of a rising wedge, a pattern that often resolves lower. Volume also rose on the break.
Meanwhile, copper was rejected near $6.70 resistance. The Relative Strength Index (RSI), a momentum gauge, lost a support line dating to March.
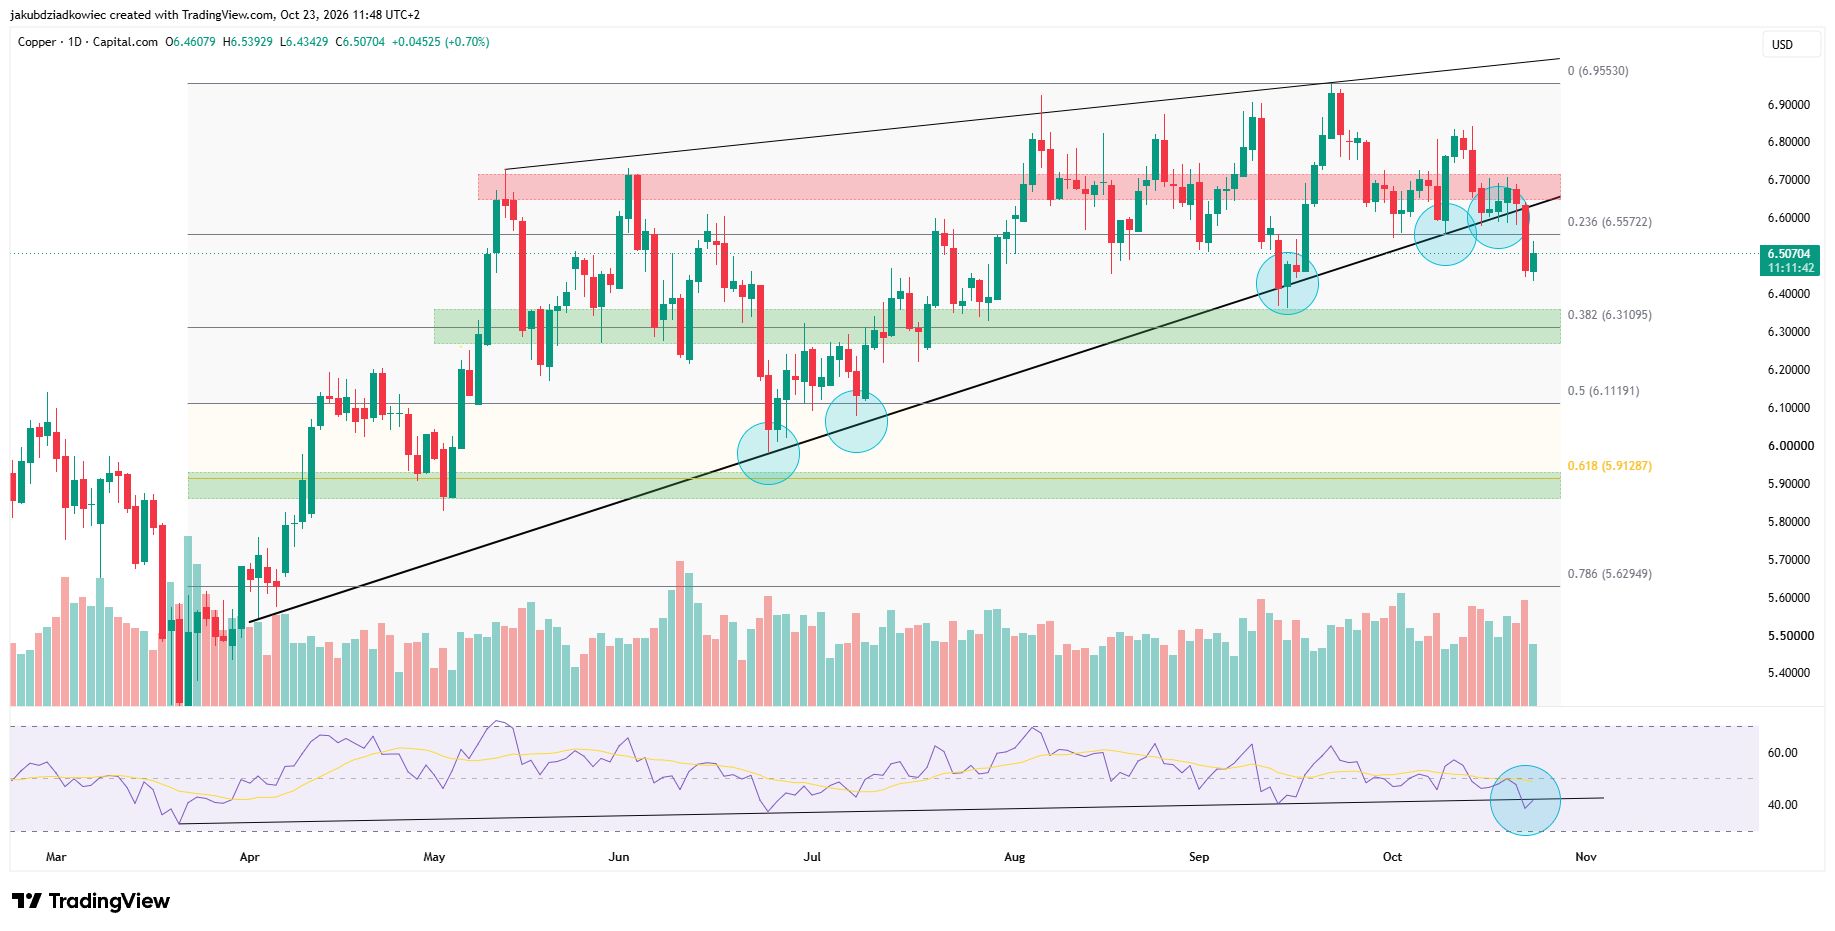 XCU daily chart / Source: Tradingview
Copper now trades near $6.51 per pound, about 6% below its September record high. Resistance sits at $6.56, then at the broken trendline near $6.64.
On the downside, the 0.382 Fibonacci level at $6.31 could be the first target. Deeper supports lie at $6.11 and $5.91.
However, a daily close back above the trendline would weaken the bearish setup.
For now, copper trades on today's surplus rather than the 2028 deficit. The bigger question is whether $332 billion in new mines arrives in time.
Read the Original story Why Did Copper Fall After a 44% Shortage Warning? by Jakub Dziadkowiec at beincrypto.com