


Hyatt Hotels Corporation H delivered second-quarter 2026 results, wherein earnings and revenues beat the Zacks Consensus Estimate. Both metrics increased on a year-over-year basis.
Hyatt reported adjusted earnings of $1.12 per share, surpassing the consensus estimate of 90 cents by 24.4%. The figure increased 64.7% from 68 cents per share in the prior-year quarter.
Revenues of $1,829 million topped the consensus mark of $1,815 million by 0.8% and rose 1.2% year over year. Gross fee growth and higher comparable system-wide hotel RevPAR supported the performance.
Hyatt Hotels Corporation Price, Consensus and EPS Surprise
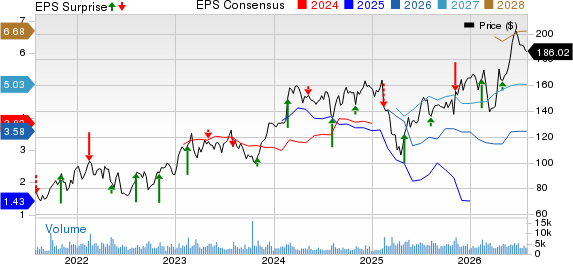
Hyatt Hotels Corporation price-consensus-eps-surprise-chart | Hyatt Hotels Corporation Quote
H's Fee Business Supports Revenue Growth
Gross fees increased 7.8% year over year to $324 million. Base management fees rose 10.2% to $124 million, aided by managed hotel RevPAR growth, strength in the United States and contributions from the Playa Hotels acquisition. The impact of Hurricane Melissa partly offset the increase.
Incentive management fees advanced 2.6% to $64 million, driven by fees from the Playa Hotels acquisition and solid performance in Asia Pacific. Lower fees in the Middle East, Mexico and Jamaica limited the upside. Franchise and other fees climbed 8.1% to $136 million on non-RevPAR fee contributions and U.S. RevPAR growth.
Net fees came in at $307 million, up from $286 million in the year-ago quarter. Management and franchising adjusted EBITDA increased to $266 million from $238 million.
Hyatt's RevPAR Rises on Rate and Occupancy Gains
Comparable system-wide hotel RevPAR increased 5.9% year over year. Average daily rate rose 5% to $216.81, while occupancy improved 0.6 percentage points to 73.2%.
Luxury and upper-upscale hotels led RevPAR growth. Leisure transient and group RevPAR recorded strong increases, while business transient RevPAR grew in the low-single-digit range. The conflict in the Middle East reduced overall RevPAR growth by approximately 110 basis points.
U.S. RevPAR increased 6.7%, while Asia Pacific, excluding Greater China, rose 10.3%. RevPAR advanced 9.5% in the Americas, outside the United States, and 7.2% in Greater China. Middle East and Africa RevPAR declined 28.3%.
H's All-Inclusive Results Face Demand Headwinds
Comparable system-wide all-inclusive resort Net Package RevPAR declined 1.2% year over year. Occupancy decreased 2.1 percentage points to 72.8%, while Net Package average daily rate increased 1.7% to $271.25.
The decline reflected softer demand, partly due to security concerns in Mexico during the first quarter and lower airlift into certain destinations. Net Package RevPAR in the Americas outside the United States fell 2.3%, while Europe reported growth of 3.4%.
Distribution adjusted EBITDA declined to $27 million from $43 million. Temporary hotel closures in Jamaica related to Hurricane Melissa and lower demand in Mexico weighed on the segment.
Hyatt's Adjusted EBITDA Advances
Adjusted EBITDA increased 3.4% year over year to $297 million. After adjusting for assets sold in 2025, the metric rose 8.8%. Owned and leased adjusted EBITDA came in at $40 million compared with $47 million in the prior-year quarter. However, the metric increased 16% after adjusting for 2025 asset sales.
Adjusted general and administrative expenses declined to $107 million from $110 million. Transaction and integration costs decreased sharply to $8 million from $82 million, while depreciation and amortization expenses fell to $73 million from $82 million.
Net income attributable to Hyatt was $110 million in contrast to a loss of $3 million in the year-ago quarter. Adjusted net income increased to $108 million from $66 million.
H Expands Rooms and Development Pipeline
Hyatt opened 3,585 rooms during the quarter. Notable openings included Miraval The Red Sea, the first Miraval property outside the United States, and The Barai Hua Hin, which introduced The Unbound Collection by Hyatt brand to Thailand.
The company’s pipeline of executed management or franchise contracts reached approximately 154,000 rooms, up 10% year over year. Trailing-12-month net rooms growth was 3.9%, or 4.4% excluding rooms from the Playa Hotels acquisition that were removed from Hyatt’s count in the second half of 2025.
Hyatt also announced a master franchise agreement with Dossen Group to develop and operate Hyatt Select hotels in the Chinese Mainland. World of Hyatt membership reached approximately 69 million, reflecting 17% year-over-year growth.
Hyatt Maintains Key 2026 Outlook Ranges
For 2026, comparable system-wide hotel RevPAR growth is expected between 3.5% and 4.5%. Net rooms growth is projected at approximately 6%.
Gross fees are anticipated in the range of $1,305-$1,335 million, implying growth of 9-11%. Adjusted EBITDA is expected between $1,155 million and $1,205 million, representing growth of 13-18% from the adjusted 2025 baseline. Adjusted free cash flow is projected between $580 million and $630 million.
As of June 30, 2026, Hyatt had total debt of $4.3 billion and total liquidity of $2.1 billion. The company returned $175 million to its shareholders through dividends and share repurchases in the first half and expects 2026 capital returns of $325-$375 million.
H’s Zacks Rank & Key Picks
Hyatt currently has a Zacks Rank #3 (Hold).
Some better-ranked stocks from the Zacks Consumer-Discretionary sector are Life Time Group Holdings, Inc. LTH, AMC Entertainment Holdings, Inc. AMC and The Marcus Corporation MCS.
Life Time Group presently sports a Zacks Rank #1 (Strong Buy). You can see the complete list of today’s Zacks #1 Rank stocks here.
Life Time Group delivered a trailing four-quarter earnings surprise of 10.9%, on average. The stock has surged 67.3% in the year-to-date period. The Zacks Consensus Estimate for LTH’s 2026 sales and EPS implies growth of 11.3% and 18.1%, respectively, from the year-ago levels.
AMC Entertainment presently flaunts a Zacks Rank #1. The company delivered a trailing four-quarter earnings surprise of 321.7%, on average. The stock has rallied 64.1% in the year-to-date period.
The Zacks Consensus Estimate for AMC Entertainment’s 2026 sales and EPS indicates an increase of 13.3% and 77.1%, respectively, from the year-ago levels.
Marcus currently sports a Zacks Rank #1. The company delivered a trailing four-quarter earnings miss of 40.4%, on average. The stock has gained 59.3% in the year-to-date period.
The Zacks Consensus Estimate for Marcus’ 2026 sales and EPS indicates growth of 6.2% and 211.8%, respectively, from the year-ago period’s levels.
Beyond Nvidia: AI's Second Wave Is Here
The AI revolution has already minted millionaires. But the stocks everyone knows about aren't likely to keep delivering the biggest profits. AI’s second wave is moving from infrastructure to implementation and these companies are at the forefront of this transition, positioned to become what Amazon and Google were to the internet era.
See Stocks Now >>Want the latest recommendations from Zacks Investment Research? Today, you can download 7 Best Stocks for the Next 30 Days. Click to get this free report
Hyatt Hotels Corporation (H): Free Stock Analysis Report
Marcus Corporation (The) (MCS): Free Stock Analysis Report
AMC Entertainment Holdings, Inc. (AMC): Free Stock Analysis Report
Life Time Group Holdings, Inc. (LTH): Free Stock Analysis Report
This article originally published on Zacks Investment Research (zacks.com).