


Canadian Natural Resources Limited CNQ reported second-quarter 2026 adjusted earnings per share of $1.58, which beat the Zacks Consensus Estimate of $1.43 and significantly increased from 51 cents in the year-ago quarter. The outperformance can be attributed to strong operational performance and higher realized oil and NGL price.
Total revenues of $10.6 billion increased from $6.3 billion in the prior-year period and beat the Zacks Consensus Estimate of $9.2 billion, fueled by increased production volumes.
Canadian Natural Resources Limited Price, Consensus and EPS Surprise
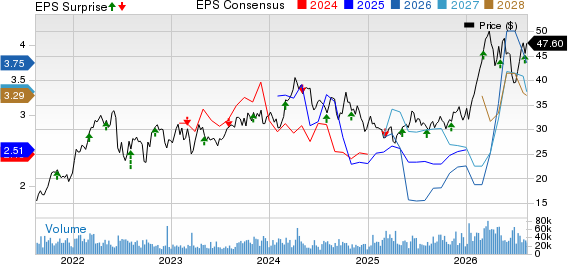
Canadian Natural Resources Limited price-consensus-eps-surprise-chart | Canadian Natural Resources Limited Quote
On Aug. 6, CNQ’s board of directors announced a quarterly cash dividend of 62.5 Canadian cents per common share. The dividend will be payable on Oct. 2, 2026, to its shareholders of record as of the close of business on Sept. 11. This marks the company's continued commitment to returning value to its shareholders.
This commitment is further evidenced by CNQ's impressive track record of growing and sustaining its dividend for 26 years, boasting a remarkable 20% annual growth rate over that period.
In the second quarter of 2026, the company returned around C$2.4 billion directly to its shareholders. This included C$1.3 billion in dividends and C$1.1 billion from the repurchase.
The oil and gas exploration and production company delivered strong financial results in the second quarter of 2026, highlighted by net earnings of approximately C$4.5 billion. Furthermore, CNQ reported robust adjusted net earnings from operations of approximately C$4.6 billion. This strong performance was also reflected in its cash flow. Cash flows from operating activities totaled approximately C$6.8 billion, and adjusted funds flow also reached approximately C$6.9 billion.
Up to Aug. 5, 2026, the Calgary-based company delivered significant returns to its shareholders, amounting to approximately C$5.7 billion. This total was composed of C$3.8 billion in dividends and C$1.9 billion through repurchases.
CNQ’s Q2 Production & Prices
Canadian Natural reported quarterly production of 1,676,754 barrels of oil equivalent per day (Boe/d), up 18% from the prior-year quarter’s level. The figure beat our estimate of 1,655,104 Boe/d.
The oil and NGL output (accounting for around 73% of total volumes) increased to 1,248,889 barrels per day (Bbl/d) from 1,019,149 Bbl/d recorded a year ago. The figure beat our estimate of 1,221,002 Bbl/d.
Natural gas volumes totaled 2,567 million cubic feet per day (MMcf/d), up 6.6% from the 2,407 MMcf/d recorded in the year-ago period. The figure missed our estimate of 2,605 MMcf/d.
Natural gas production in North America reached 2,563 MMcf/d in the second quarter of 2026 compared with 2,398 MMcf/d in the second quarter of 2025. The figure lagged our estimate of 2,602 MMcf/d.
Exploration and production activities in North America, not including thermal in situ methods, reported an average output of 338,138 Bbl/d. This indicates a 24.8% year-over-year increase during this quarter. Meanwhile, thermal in situ production volume increased to 275,607 Bbl/d from 274,789 Bbl/d recorded a year ago. The figure missed our estimate of 280,000 Bbl/d.
The Oil Sands Mining and Upgrading operations in North America reported an average output of 624,754 Bbl/d of synthetic crude oil. This represented a 34.7% increase from the prior-year quarter’s levels of 463,808 Bbl/d.
The realized natural gas price decreased to C$2.05 per thousand cubic feet from the year-ago level of C$2.58. The realized oil and NGL price increased 51% to C$105.11 per barrel from C$69.58 in the second quarter of 2025.
The company also achieved industry-leading operating costs for Oil Sands Mining and Upgrading, amounting to C$22.19 per barrel in the second quarter of 2026.
CNQ’s Q2 Costs & Capital Expenditure
Total expenses in the quarter were C$8.8 billion, up from C$5.9 billion recorded in the year-ago period. The rise was mainly due to an increase in blending and feedstock expenses of the company.
Capital expenditure totaled C$2.4 billion compared with C$1.9 billion a year ago.
CNQ’s Balance Sheet
As of June 30, 2026, CNQ had cash and cash equivalents worth C$2.6 billion and long-term debt of approximately C$14.9 billion, with a debt to capitalization of about 24.2%.
CNQ’s 2026 Guidance
Canadian Natural Resources raised its 2026 production guidance for the second time this year, reflecting the recently completed Peace River acquisition and strong conventional drilling performance. The company now expects total production of 1,637-1,682 MBOE/d, up from the previous range of 1,615-1,665 MBOE/d, with the midpoint increasing by 20,000 BOE/d. The revised outlook includes higher natural gas production of 2,595-2,635 MMcf/d and Conventional E&P crude oil and NGL production of 352,000-360,000 bbl/d, while Thermal and Oil Sands Mining & Upgrading production guidance remains unchanged at 852,000-883,000 bbl/d. Total liquids production is now expected at 1,204-1,243 mbbl/d.
On the capital front, Canadian Natural maintained its 2026 operating capital budget at approximately C$5,990 million, including C$3.16 billion for Conventional E&P and C$2.83 billion for Thermal and Oil Sands Mining & Upgrading. However, total capital expenditures increased to C$7.64 billion from the previous C$6.88 billion forecast, entirely due to a C$761 million increase in net acquisitions following the Peace River asset purchase.
CNQ currently carries a Zacks Rank #3 (Hold). You can see the complete list of today’s Zacks #1 Rank (Strong Buy) stocks here.
Important Earnings at a Glance
While we have discussed CNQ’s second-quarter results in detail, let us take a look at three other key reports in this space.
Imperial Oil Limited IMO reported second-quarter 2026 adjusted earnings per share of $3.27, which beat the Zacks Consensus Estimate of $2.99 and increased from the year-ago quarter’s $1.34, driven by higher price realizations.
Revenues of $11.6 billion missed the Zacks Consensus Estimate of $11.8 billion. However, the top line increased significantly from the year-ago quarter’s level of $8.1 billion, backed by strong performance in both the Upstream and Downstream segments.
As of June 30, 2026, Imperial Oil had cash and cash equivalents of C$2.8 billion. Total debt of the company amounted to C$3.96 billion, with a debt-to-capitalization of 13.9%.
USA Compression Partners USAC reported second-quarter 2026 adjusted net profit of 31 cents per common unit, beating the Zacks Consensus Estimate of 24 cents. The metric improved from the year-ago quarter’s net profit of 22 cents per common unit, driven by a year-over-year increase in revenue-generating capacity.
The largest independent provider of natural gas compression services generated revenues of $342.1 million, improving 36.8% from the year-ago quarter’s level and beating the Zacks Consensus Estimate by 0.7%. This growth was aided by higher contract operations revenues and higher revenues from the sale of parts and services.
As of June 30, 2026, USA Compression had net long-term debt of $2.9 billion. The partnership had $536.9 million of remaining unused availability under its revolving credit facility.
Diamondback Energy, Inc. FANG reported second-quarter 2026 adjusted earnings per share of $6.48, which beat the Zacks Consensus Estimate of $5.96 and more than doubled from the year-ago adjusted profit of $2.67. The outperformance was driven by production growth and a 53.1% improvement in the year-over-year realized oil prices.
This Midland, TX-based oil and gas exploration and production company’s revenues of $5.6 billion increased more than 51% from the year-ago quarter and topped the Zacks Consensus Estimate by about 17%, fueled primarily by higher sales of oil, natural gas and natural gas liquids, increased sales of purchased oil and higher revenues from other operating income.
As of June 30, the Permian-focused operator had approximately $462 million in cash and cash equivalents and $11.1 billion in long-term debt, representing a debt-to-capitalization of 20.1%.
7 Best Stocks for the Next 30 Days
Just released: Experts distill 7 elite stocks from the current list of 220 Zacks Rank #1 Strong Buys. They deem these tickers "Most Likely for Early Price Pops."
Since 1988, the full list has beaten the market more than 2X over with an average gain of +23.9% per year. So be sure to give these hand picked 7 your immediate attention.
See them now >>Want the latest recommendations from Zacks Investment Research? Today, you can download 7 Best Stocks for the Next 30 Days. Click to get this free report
Canadian Natural Resources Limited (CNQ): Free Stock Analysis Report
Imperial Oil Limited (IMO): Free Stock Analysis Report
USA Compression Partners, LP (USAC): Free Stock Analysis Report
Diamondback Energy, Inc. (FANG): Free Stock Analysis Report
This article originally published on Zacks Investment Research (zacks.com).