


Essex Property Trust, Inc. ESS reported third-quarter 2026 core funds from operations (FFO) of $4.00 per share, missing the Zacks Consensus Estimate of $4.01. Core FFO grew marginally from $3.97 a year ago.
Quarterly revenues rose 4.1% year over year to $492.69 million but lagged the consensus estimate of $493.50 million. Results reflected rising cost pressures, with total expenses increasing 5.4%, outpacing revenue growth.
Essex Property's Same-Property Costs Rise
Same-property operating expenses increased 2.8% to $136.71 million. Maintenance and repair costs climbed 10.7%, utilities rose 4.7%, and real estate taxes increased 1.6%. Insurance and other expenses fell 5.7%, partially offsetting these increases.
Same-property NOI totaled $313.19 million compared with $303.69 million a year earlier. Sequentially, comparable-property expenses increased 6.7%, outpacing revenue growth and contributing to a 1.3% decline in NOI from the second quarter.
ESS' Rental Revenues Drive Top-Line Growth
Rental and other property revenues increased 4.1% to $490.35 million. Rental income rose 4.1% to $482.77 million, while other property revenues advanced 7.5% to $7.58 million.
Total expenses climbed 5.4% to $342.71 million, including a $10.71 million impairment charge. Property operating expenses increased 4.2% to $149.50 million, while corporate-level property management costs rose 9.6% to $13.39 million. General and administrative expenses declined 8.3% to $16.56 million.
Essex Property's Northern California Markets Lead
Northern California remained the strongest region, with same-property revenue growth of 5.4% and NOI growth of 7%. Santa Clara County revenues increased 5.7%, while San Mateo County posted 6.6% growth. San Francisco recorded an 8% increase.
Southern California revenues rose 1.5%, with NOI up 1%. Seattle Metro revenues increased 1.3%, but a 5.3% rise in operating expenses contributed to a 0.4% NOI decline. Sequentially, total same-property revenues improved 1%, led by Northern California's 1.7% gain.
ESS' Leasing and Occupancy Metrics Improve
Same-property revenues reached $449.90 million compared with $436.73 million a year earlier. The average monthly rental rate increased 2.5% to $2,777.
Financial occupancy improved to 96.3% from 96% a year earlier and remained unchanged sequentially. Renewal lease tradeouts registered 5.3% net effective rate growth, with blended lease tradeouts increasing 3.5%. New-lease rates, however, declined 0.2%.
ESS' Dispositions and Investments Progress
Essex sold three apartment communities during the quarter for a total pro rata contract price of $111.9 million. Transactions included a 76-unit Seattle property, a 268-unit San Jose property sold through a joint venture, and a 101-unit Marina del Rey community.
A 50%-owned joint venture originated two preferred equity investments totaling $36.2 million, or $18.1 million at Essex's share, carrying an initial preferred return of 11.5%. After quarter-end, the company acquired a 378-unit Oakland property following the liquidation of its subordinated loan interest and payoff of the senior mortgage.
Essex Property's Financial Flexibility
Essex obtained a $275 million unsecured term loan in September, priced at SOFR plus 0.80%, with a scheduled maturity in September 2029 and extension options. Quarter-end liquidity exceeded $1.7 billion. Net consolidated debt was $6.61 billion, while fixed-rate borrowings accounted for 92% of total debt.
ESS did not repurchase shares in the quarter. For the first nine months, it repurchased 254,001 shares for $61.9 million. Essex retained $500 million of buyback authority and $883.5 million of capacity under its at-the-market equity issuance program.
ESS Raises Full-Year Core FFO Guidance
Management revised its 2026 core FFO outlook to $16.10-$16.22 per share from $16.03-$16.25. The midpoint increased by 2 cents to $16.16. Fourth-quarter core FFO is projected at $3.95-$4.07 per share.
The revised outlook assumes same-property revenue growth of 2.8%-3% versus the prior forecast of 2.5%-3.1%. Expected NOI growth was revised to 2.8%-3.2% from 2.3%-3.3%, while operating expense growth guidance narrowed to 2.6%-2.9% from 2.5%-3%.
ESS’ Zacks Rank
Essex Property currently carries a Zacks Rank #3 (Hold). You can see the complete list of today’s Zacks #1 Rank (Strong Buy) stocks here.
Essex Property Trust, Inc. Price, Consensus and EPS Surprise
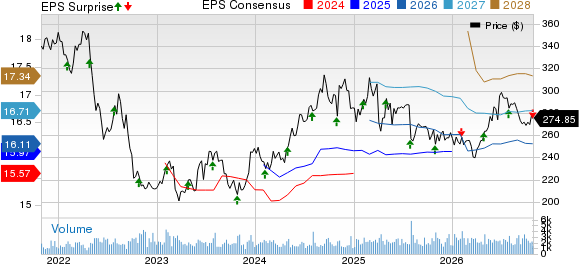
Essex Property Trust, Inc. price-consensus-eps-surprise-chart | Essex Property Trust, Inc. Quote
Performance of Other REITs
Crown Castle Inc. CCI reported third-quarter 2026 adjusted FFO per share of $1.24, up 10.7% year over year. The metric surpassed the Zacks Consensus Estimate of $1.20 by 3.3%. Results benefited from lower interest expenses.
Prologis PLD reported third-quarter 2026 core FFO per share of $1.60, outpacing the Zacks Consensus Estimate of $1.58. Results gained from higher rental revenues, steady leasing demand and improved occupancy levels.
Note: Anything related to earnings presented in this write-up represents funds from operations (FFO) — a widely used metric to gauge the performance of REITs.
Zacks' Research Chief Names "Stock Most Likely to Double"
Our team of experts has just released the 5 stocks with the greatest probability of gaining +100% or more in the coming months. Of those 5, Director of Research Sheraz Mian highlights the one stock set to climb highest.
This innovative software-as-a-service firm upped its user base +22% year over year. That rate is increasing and margins are expanding as AI efficiencies take effect. Of course, all our elite picks aren't winners, but this one could far surpass earlier Zacks' Stocks Set to Double like D-Wave Quantum, which shot up +680.1%.
Free: See Our Top Stock And 4 Runners UpWant the latest recommendations from Zacks Investment Research? Today, you can download 7 Best Stocks for the Next 30 Days. Click to get this free report
Essex Property Trust, Inc. (ESS): Free Stock Analysis Report
Prologis, Inc. (PLD): Free Stock Analysis Report
Crown Castle Inc. (CCI): Free Stock Analysis Report
This article originally published on Zacks Investment Research (zacks.com).