


Sony Group Corporation SONY reported earnings of ¥76.49 per share for the second quarter of fiscal 2026, up 47.9% year over year from ¥51.71.
Adjusted net income increased 27.4% to ¥449.6 billion.
Quarterly net sales grew 10.3% to ¥3,429.4 billion, driven by Pictures and Game & Network Services. PlayStation monthly active users reached 127 million, up from 119 million a year ago, while stronger theatrical revenues boosted profitability.
Sony's Gaming Profit Jumps 83%
Game & Network Services sales increased 9% to ¥1,208.5 billion. Segment operating income surged 83% to ¥220.1 billion, supported by higher network services and first-party game software revenues. The absence of ¥49.8 billion in impairment and development-cost adjustments recorded a year earlier also supported growth.
Sony Corporation Price, Consensus and EPS Surprise
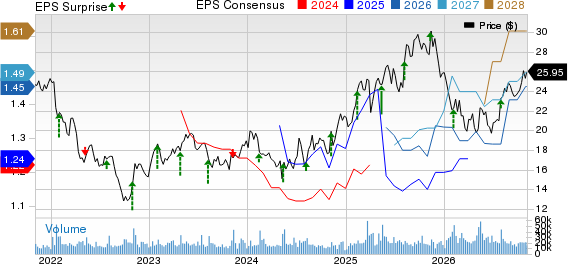
Sony Corporation price-consensus-eps-surprise-chart | Sony Corporation Quote
Network Services revenues increased to ¥218.3 billion from ¥182.7 billion, while Digital Software and Add-on Content revenues climbed to ¥643.9 billion from ¥568.1 billion.
PlayStation 5 hardware shipments rose to 2.6 million units from 1.5 million. Full-game software sales reached 88.2 million units, up from 80.3 million. First-party software sales increased to 8.2 million units from 6.3 million, while the digital download ratio improved to 78% from 72%.
SONY's Pictures and Music Deliver Growth
Pictures sales jumped 48% to ¥513.7 billion, driven primarily by theatrical revenues from Spider-Man: Brand New Day . Operating income surged 568% to ¥92.6 billion, reflecting higher Motion Pictures sales.
Motion Pictures revenues increased to ¥290 billion from ¥105.3 billion. Television Productions revenues declined to ¥76.7 billion from ¥103.4 billion, partially offsetting theatrical strength.
Music sales increased 10% to ¥598.4 billion, while operating income advanced 6% to ¥122.8 billion. Higher live-event and merchandising revenues supported Recorded Music, alongside streaming growth in Recorded Music and Music Publishing.
Recorded Music streaming revenues climbed to ¥242.2 billion from ¥208.6 billion. Music Publishing streaming revenues increased to ¥74.4 billion from ¥65.1 billion. Lower contributions from Demon Slayer: Kimetsu no Yaiba Infinity Castle weighed on Visual Media & Platform.
Sony's Sensors and Electronics Show Mixed Trends
Imaging & Sensing Solutions sales declined 6% to ¥577.6 billion, reflecting lower mobile image sensor sales and reduced unit volumes. Improved product mix and favorable currency movements provided partial offsets.
Segment operating income increased 12% to ¥154.6 billion, primarily benefiting from foreign exchange movements despite lower sales.
Entertainment, Technology & Services sales slipped 1% to ¥567.8 billion amid declining unit sales across businesses, including Imaging. Operating income increased 5% to ¥64.1 billion, supported by U.S. tariff refunds, although weaker Imaging and Sound sales weighed on profitability.
SONY's Operating Margin Expands Sharply
Operating income jumped 45.1% to ¥622.3 billion, lifting the operating margin to 18.1% from 13.8%.
Total costs and expenses increased 4% to ¥2,784.3 billion, below the pace of revenue growth. Cost of sales rose to ¥2,162.1 billion, while selling, general and administrative expenses increased to ¥629.2 billion.
Income before income taxes advanced 41.1% to ¥623.2 billion. The effective tax rate declined to 27% from 28%, reflecting a higher proportion of pretax income generated in the United States.
Sony's Cash Flow and Balance Sheet Shift
As of Sept. 30, 2026, cash and equivalents totaled ¥2,009.3 billion, down from ¥2,208.9 billion at fiscal year-end. Inventories increased to ¥1,452.5 billion from ¥1,227.4 billion.
Long-term debt rose to ¥1,236 billion from ¥824.4 billion. Total assets increased to ¥16,667.7 billion from ¥15,683.5 billion.
For the first six months, operating cash flow from continuing operations increased to ¥655.4 billion from ¥492.3 billion. Investing cash outflows rose to ¥607.8 billion from ¥377.7 billion, reflecting higher business acquisition payments and investments in property and intangible assets.
SONY Raises Fiscal 2026 Outlook
Sony raised its full-year sales forecast to ¥13,000 billion from ¥12,500 billion and operating income guidance to ¥1,870 billion from ¥1,720 billion. The net income forecast increased to ¥1,330 billion from ¥1,210 billion, while operating cash flow guidance rose to ¥1,600 billion from ¥1,500 billion.
Game & Network Services received a ¥290 billion sales upgrade and a ¥40 billion operating income increase, reflecting stronger non-first-party software sales and network services.
Pictures operating income guidance increased by ¥50 billion to ¥200 billion, while Music and Imaging & Sensing Solutions received upgrades of ¥25 billion and ¥30 billion, respectively.
The company maintained its planned annual dividend of ¥35 per share, up ¥10 year over year.
SONY’s Zacks Rank
Sony currently carries a Zacks Rank #2 (Buy). You can see the complete list of today’s Zacks #1 Rank (Strong Buy) stocks here.
Recent Performance of Other Firms
Cadence Design Systems, Inc. CDNS reported strong third-quarter 2026 results, driven by robust demand for AI-oriented design solutions and hardware-assisted verification products. Non-GAAP earnings per share of $2.11 beat the Zacks Consensus Estimate by 3.4% and increased 9.3% year over year. Revenues of $1.633 billion surpassed the consensus mark by 1.4% and increased 22% year over year. The figure exceeded management’s guided range of $1.60-$1.63 billion.
Progress Software Corporation PRGS reported third-quarter fiscal 2026 results wherein revenues came in at $246 million, down 2% year over year and on a constant currency (cc) basis. ARR of $873 million inched up 1% year over year on a cc basis. Progress Software Corporation reported a 13% year-over-year increase in non-GAAP earnings per share, which stood at $1.69.
Synopsys, Inc. SNPS reported third-quarter fiscal 2026 non-GAAP earnings of $3.91 per share, which increased 15.3% year over year and beat the Zacks Consensus Estimate by 6.5%. Broad-based strength, led by EDA and Ansys, supported the earnings outperformance.
Revenues for Synopsys rose 42.4% year over year to $2.48 billion, topping the consensus mark by 1.7%. Backlog remained strong at $10.9 billion, while Design IP returned to year-over-year growth.
Beyond Nvidia: AI's Second Wave Is Here
The AI revolution has already minted millionaires. But the stocks everyone knows about aren't likely to keep delivering the biggest profits. AI’s second wave is moving from infrastructure to implementation and these companies are at the forefront of this transition, positioned to become what Amazon and Google were to the internet era.
See Stocks Now >>Want the latest recommendations from Zacks Investment Research? Today, you can download 7 Best Stocks for the Next 30 Days. Click to get this free report
Sony Corporation (SONY): Free Stock Analysis Report
Synopsys, Inc. (SNPS): Free Stock Analysis Report
Cadence Design Systems, Inc. (CDNS): Free Stock Analysis Report
Progress Software Corporation (PRGS): Free Stock Analysis Report
This article originally published on Zacks Investment Research (zacks.com).