


Grocery Outlet Holding Corp. GO reported third-quarter fiscal 2026 results, with both top and bottom lines surpassing the Zacks Consensus Estimate. Net sales increased 0.9% year over year, while adjusted earnings per share declined 23.8%.
Results benefited from improving customer traffic, a stronger opportunistic product assortment and positive comparable-store sales. The company also raised its comparable-store sales outlook for fiscal 2026, reflecting improved operating momentum despite continued margin pressures.
GO's Quarterly Performance: Key Insights
Grocery Outlet reported adjusted earnings of 16 cents per share in the third quarter, beating the Zacks Consensus Estimate of 15 cents. The figure declined from adjusted earnings of 21 cents posted in the year-ago quarter.
Net sales rose to $1,178.3 million from $1,168.2 million in the prior-year quarter, surpassing the consensus estimate of $1,170 million. Growth was driven by contributions from new stores and higher comparable-store sales, partly offset by reduced sales stemming from store closures under the Optimization Plan.
Comparable-store sales increased 0.5%, improving from a 0.3% decline in the second quarter. The increase reflected 2.4% growth in transactions, partly offset by a 1.9% decline in the average transaction size. Management highlighted improving traffic and basket trends, supported by stronger execution of its opportunistic merchandise offering.
Grocery Outlet Holding Corp. Price, Consensus and EPS Surprise
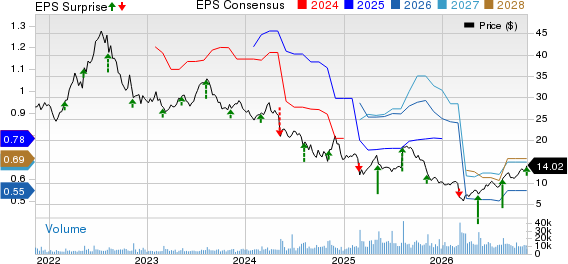
Grocery Outlet Holding Corp. price-consensus-eps-surprise-chart | Grocery Outlet Holding Corp. Quote
Grocery Outlet's Margin Profile Remains Pressured
Gross profit declined 0.6% year over year to $353 million. Gross margin contracted 40 basis points to 30% from 30.4% in the prior-year quarter. The contraction primarily reflected promotional spending, higher transportation expenses and increased produce shrink associated with the Cyclospora outbreak, partly offset by a favorable shift toward opportunistic products.
Selling, general and administrative expenses increased slightly to $332.5 million from $331 million. As a percentage of net sales, SG&A expenses declined 10 basis points to 28.2%.
Adjusted EBITDA fell 10.9% year over year to $59.4 million from $66.7 million. Adjusted EBITDA margin contracted 70 basis points to 5%. Operating income increased to $24 million from $22.8 million, benefiting from $3.6 million in net restructuring credits related to the Optimization Plan.
GO's Merchandising Initiatives Gain Traction
Management highlighted continued progress in strengthening Grocery Outlet's opportunistic assortment, which remains central to its value proposition. Improved merchandising execution helped sustain growth in the grocery department, while similar initiatives gained traction across frozen and deli categories.
Customer credit card data indicated an increase in new shoppers during the quarter. Grocery Outlet's 80th-anniversary promotional event also generated double-digit comparable-store sales growth over three days.
The Cyclospora outbreak reduced quarterly comparable-store sales by approximately 60 basis points, less than management's earlier expectation of a 100-basis-point impact. Management noted that produce demand subsequently recovered, while overall comparable-store sales accelerated into October.
Grocery Outlet's Store Expansion Update
Grocery Outlet opened 14 new stores and recorded no closures during the third quarter, ending the period with 561 stores across 16 states.
During the first nine months of fiscal 2026, the company opened 31 stores and closed 40 locations, including 36 under its Optimization Plan.
Grocery Outlet now expects 30-31 net new store openings in fiscal 2026, excluding Optimization Plan closures, compared with its previous projection of 30-33.
GO's Financial Health Snapshot
Grocery Outlet ended the quarter with cash and cash equivalents of $59.8 million compared with $69.6 million at fiscal 2025-end. Long-term debt, net, totaled $487 million, while stockholders' equity stood at $834.1 million.
Operating cash flow increased to $18.2 million from $17.3 million in the prior-year quarter. The improvement primarily reflected higher accrued and other liabilities, partly offset by lower operating lease liabilities associated with the Optimization Plan.
Capital expenditures, net of tenant improvement allowances, declined to $25.7 million from $39.4 million. Management maintained its fiscal 2026 capital expenditure (net of tenant improvement allowances) forecast of approximately $170 million.
Grocery Outlet Revises Fiscal 2026 Outlook
Grocery Outlet maintained its fiscal 2026 net sales guidance of $4.70-$4.72 billion while raising its comparable-store sales growth forecast to 0.2%-0.4% from the previous range of flat to down 0.5%.
Management narrowed its adjusted EBITDA guidance to $225-$229 million from $225-$235 million. Adjusted earnings-per-share guidance was revised to 52-55 cents from 51-55 cents previously. Gross margin expectations remain unchanged at 29.8%-30%.
For the fourth quarter, management anticipates comparable-store sales growth of 1.5%-2.5%, gross margin of 29.7%-30%, adjusted EBITDA of $57-$61 million and adjusted earnings of 11-14 cents per share.
The outlook reflects expectations for continued sales improvement from opportunistic merchandising initiatives, alongside higher repairs and maintenance expenses and certain supply-chain cost pressures.
Shares of this Zacks Rank #3 (Hold) company have advanced 22.2% over the past three months compared with the industry’s rise of 12%.
Stocks to Consider
Dollar General Corporation DG, a discount retailer, currently carries a Zacks Rank of 2 (Buy). You can see the complete list of today’s Zacks #1 Rank (Strong Buy) stocks here.
The Zacks Consensus Estimate for Dollar General’s current fiscal-year sales and EPS implies growth of 4.3% and 15.9%, respectively, from the year-ago figures. DG delivered a trailing four-quarter earnings surprise of 19.1%, on average.
Target Corporation TGT, which operates as a general merchandise retailer, currently carries a Zacks Rank #2. TGT delivered a trailing four-quarter earnings surprise of 10.5%, on average.
The Zacks Consensus Estimate for Target’s current fiscal-year sales and EPS implies growth of 5.1% and 39%, respectively, from the year-ago figures.
BJ's Wholesale Club Holdings, Inc. BJ, a leading operator of membership warehouse clubs, currently carries a Zacks Rank #2. BJ delivered a trailing four-quarter earnings surprise of 4.8%, on average.
The Zacks Consensus Estimate for BJ's Wholesale Club’s current fiscal-year sales and EPS calls for growth of 11.7% and 6.8%, respectively, from the year-ago figures.
Beyond Nvidia: AI's Second Wave Is Here
The AI revolution has already minted millionaires. But the stocks everyone knows about aren't likely to keep delivering the biggest profits. AI’s second wave is moving from infrastructure to implementation and these companies are at the forefront of this transition, positioned to become what Amazon and Google were to the internet era.
See Stocks Now >>Want the latest recommendations from Zacks Investment Research? Today, you can download 7 Best Stocks for the Next 30 Days. Click to get this free report
Grocery Outlet Holding Corp. (GO): Free Stock Analysis Report
Target Corporation (TGT): Free Stock Analysis Report
Dollar General Corporation (DG): Free Stock Analysis Report
BJ's Wholesale Club Holdings, Inc. (BJ): Free Stock Analysis Report
This article originally published on Zacks Investment Research (zacks.com).