Technical Indicators for MetaTrader 5

Signals from technical indicators play a crucial role in opening and closing deals on stock and Forex markets. The essence of indicators is a mathematical transformation of a financial symbol price aimed at forecasting future price changes. Test technical indicators to better predict market behavior and profit from it.


Indicator type
Price

Chart Pen PRO

Free

OBV macd

Free

QQE Signal Arrows and Alerts

Free

MTF Trend Multi Timeframe Direction Dashboard

Free

Swing High Low detector with Divergence mapping

Free

Total TP SL and Timer Indicator MT5

Free

Chandelier Exit MT5

Free

Liquidity Break Retest Scanner

Free

Clean Trading Sessions indicator

Free

Market Depth Pro

Free

Perfect Day Scalper Pro Indicator

Free

SNR Sentinel Indicator

Free

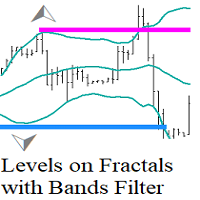
Levels on Fractals with Bands Filter

Free

Smoothed Heiken Ashi Plus

Free

Plus BB Color

Free

Candle Close Countdown Timer

Free

Lydians Indicator

Free

Trinity Zones

Free

ChopShield Pro

Free

Mini POC

Free

Trade vision buy and sell arrow

Free

Gold Eagle Pro

Free

Session Volume Profile Value Area MT5

Free

OFX Book

Free

Green Red Sweep Candle

Free

Marcus Creations

Free

RSICloud

Free

SMC Structure Gap Monitor

Free

Yoshi Order Blocks and Breaker Blocks

Free

SC MTF Stochastic RSI for MT5 with alert

Free

Superwave MT5

Free

Sweep Liquidity

Free

Auto Fibonacci Multi Timeframe MT5

Free

Haven RSI Candlestick

Free

False Breakout Trap Radar MT5

Free

Market Session by TradingLabs ID

Free

Confluex SMC Pro Signals

Free

Renko Box

Free

SMT Divergence Multi Timeframe MT5

Free

Advance Market Analysis Indicator

Free

VSA Volume Color

Free

Haven Fractals

Free

Bar Countdown

Free

Classic MACD Histogram

Free

Order Block Breaker Block Zone by RWBTradeLab

Free

Orderblock MT5

Free

TS Market Sessions

Free

Engulfing Signal Alert

Free

Extreme POI

Free

Mako Market Structure

Free

Cris Levels

Free

HiperCube Auto Trend Lines

Free

Plus RSI 14

Free

Fibonacci Projection Volume Delta Profile

Free

Better Volume Multi Timeframe Climax Churn

Free

Entry Synergy KPG

Free

Higher High and Lows MT5

Free

SR Breakout Trend Detector

Free

Auto Fibo MT5

Free

Sentinel Trend Catcher

Free

Ichimoku Trend Alert MT5

Free

Super Trend Strategy

Free

Wyckoff Range Premium Discount Zones

Free

RSI abcd

Free

Pro Zona de Liquidez

Free

Smart Bar Timer

Free

Sniper MACD

Free

Buy Sell Signal MTF

Free

SST Vwap

Free

Williams PR Trades Setups Scanner

Free

OrderBlockDetector

Free

Trend Arrow Signal

Free

Frequently asked questions about technical indicators

What is a technical indicator?

A technical indicator processes prices, volumes or other market data and displays the result on a chart or in a separate window. It can help traders assess trends, momentum, volatility, market levels, patterns and other characteristics that are difficult to see from raw prices alone.

Can an indicator open trades automatically?

No. An indicator is designed to calculate and display analytical information. It cannot send trading orders on its own. However, an Expert Advisor can read indicator values and use them as part of an automated trading strategy.

How is an indicator different from an Expert Advisor?

An indicator helps analyze the market and presents its calculations on a chart. An Expert Advisor can analyze market data and also execute trading operations. Put simply, an indicator provides information, while an EA can use information to act.

What types of indicators are available in the Store?

The Store includes trend indicators, oscillators, channels, levels, pattern-recognition tools, multi-timeframe and multicurrency products, cluster indicators and volume-analysis tools. Choose a category based on the market feature you want to study rather than simply on the number of signals shown.

Can I test an indicator before buying it?

Yes. Download the demo version and start it in visual testing mode in the MetaTrader 5 Strategy Tester. You will see how the indicator behaves on historical data, how its values change and where its signals appear. A demo indicator cannot be launched on a regular online chart.

Can I use several indicators on one chart?

Yes. MetaTrader 5 does not impose a fixed limit on the number of indicators attached to one chart. However, many similar tools can duplicate signals, slow down chart updates and make the screen harder to read. Add only those indicators that answer different analytical questions.

How do I choose a useful technical indicator?

Start with the question you want the indicator to answer: trend direction, momentum, volatility, volume, market levels or entry timing. Then examine its calculation method, supported symbols and timeframes, input settings and signal frequency. It is also worth checking whether previously displayed values or signals can change when new data arrives.

How do I add an indicator from the Store to a chart?

Open the Navigator and find the installed product under "Indicators", usually in the "Market" folder. Double-click it or drag it onto the required chart. Review the input parameters, colors and levels, then click "OK" to start the calculation.