EUR/USD – Bearish Structure Under Resistance EURUSD Short Euro vs US Dollar
EUR/USD – Bearish Structure Under Resistance
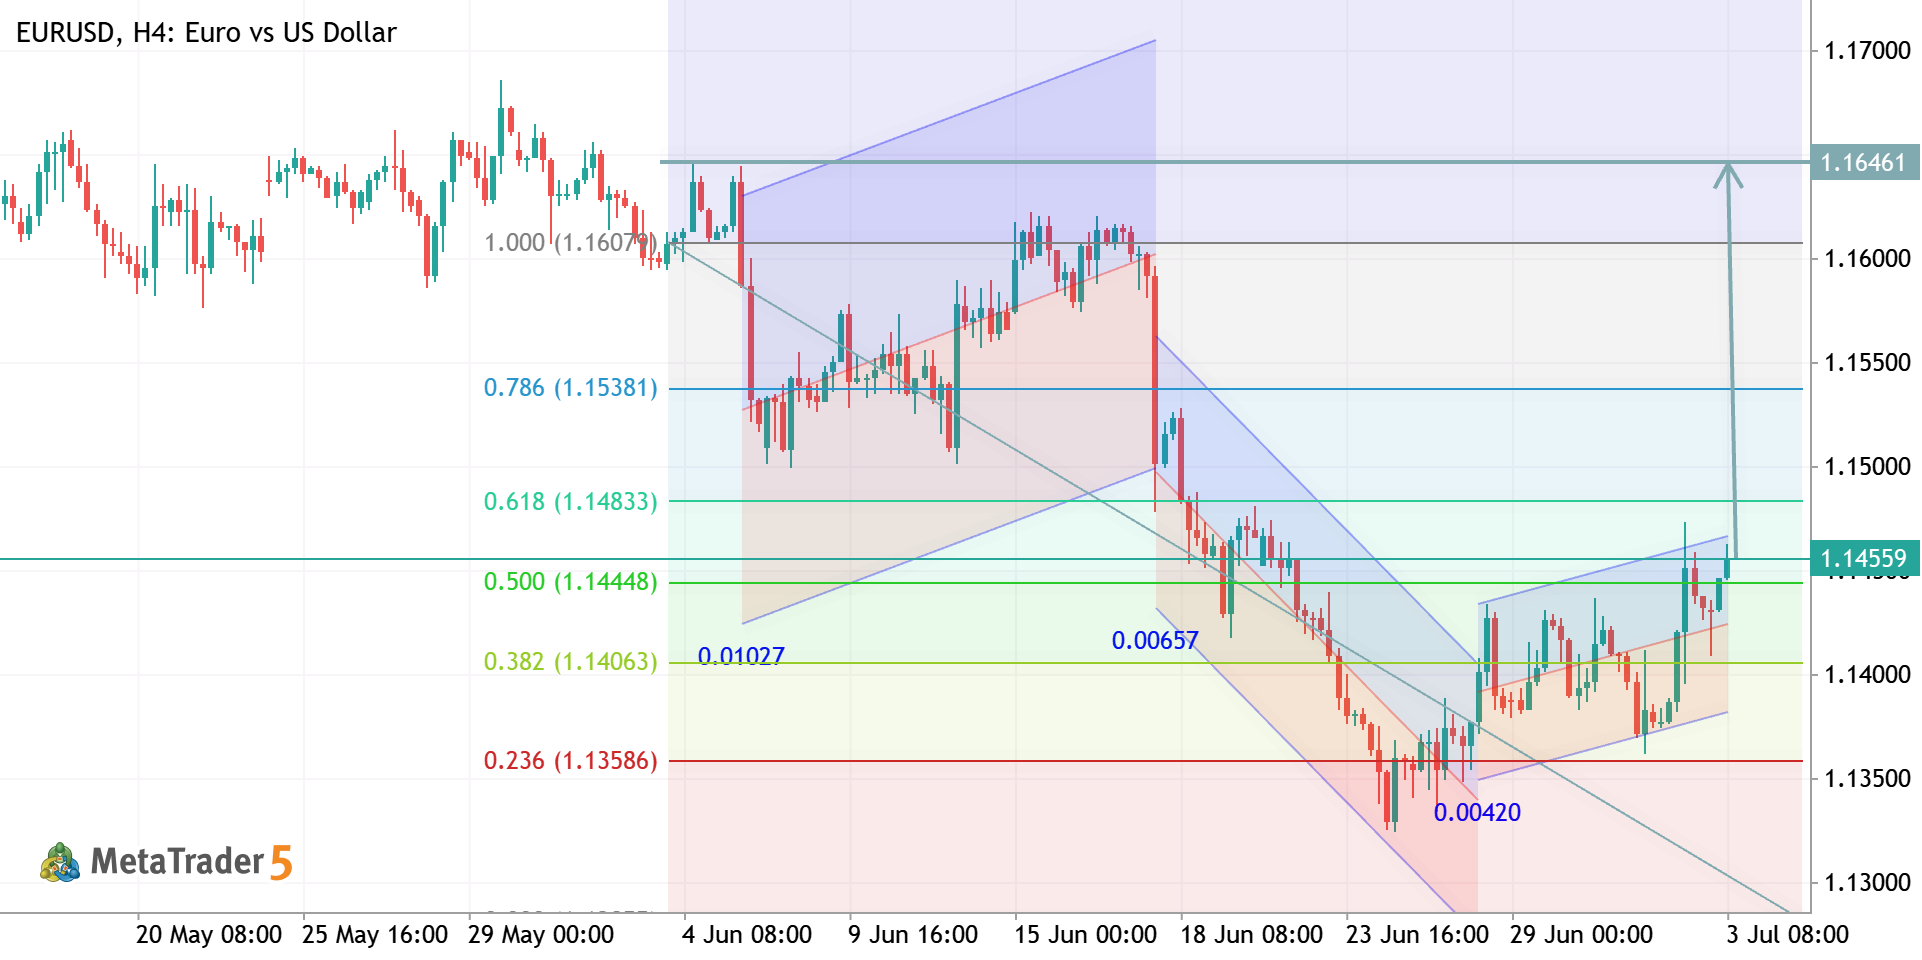
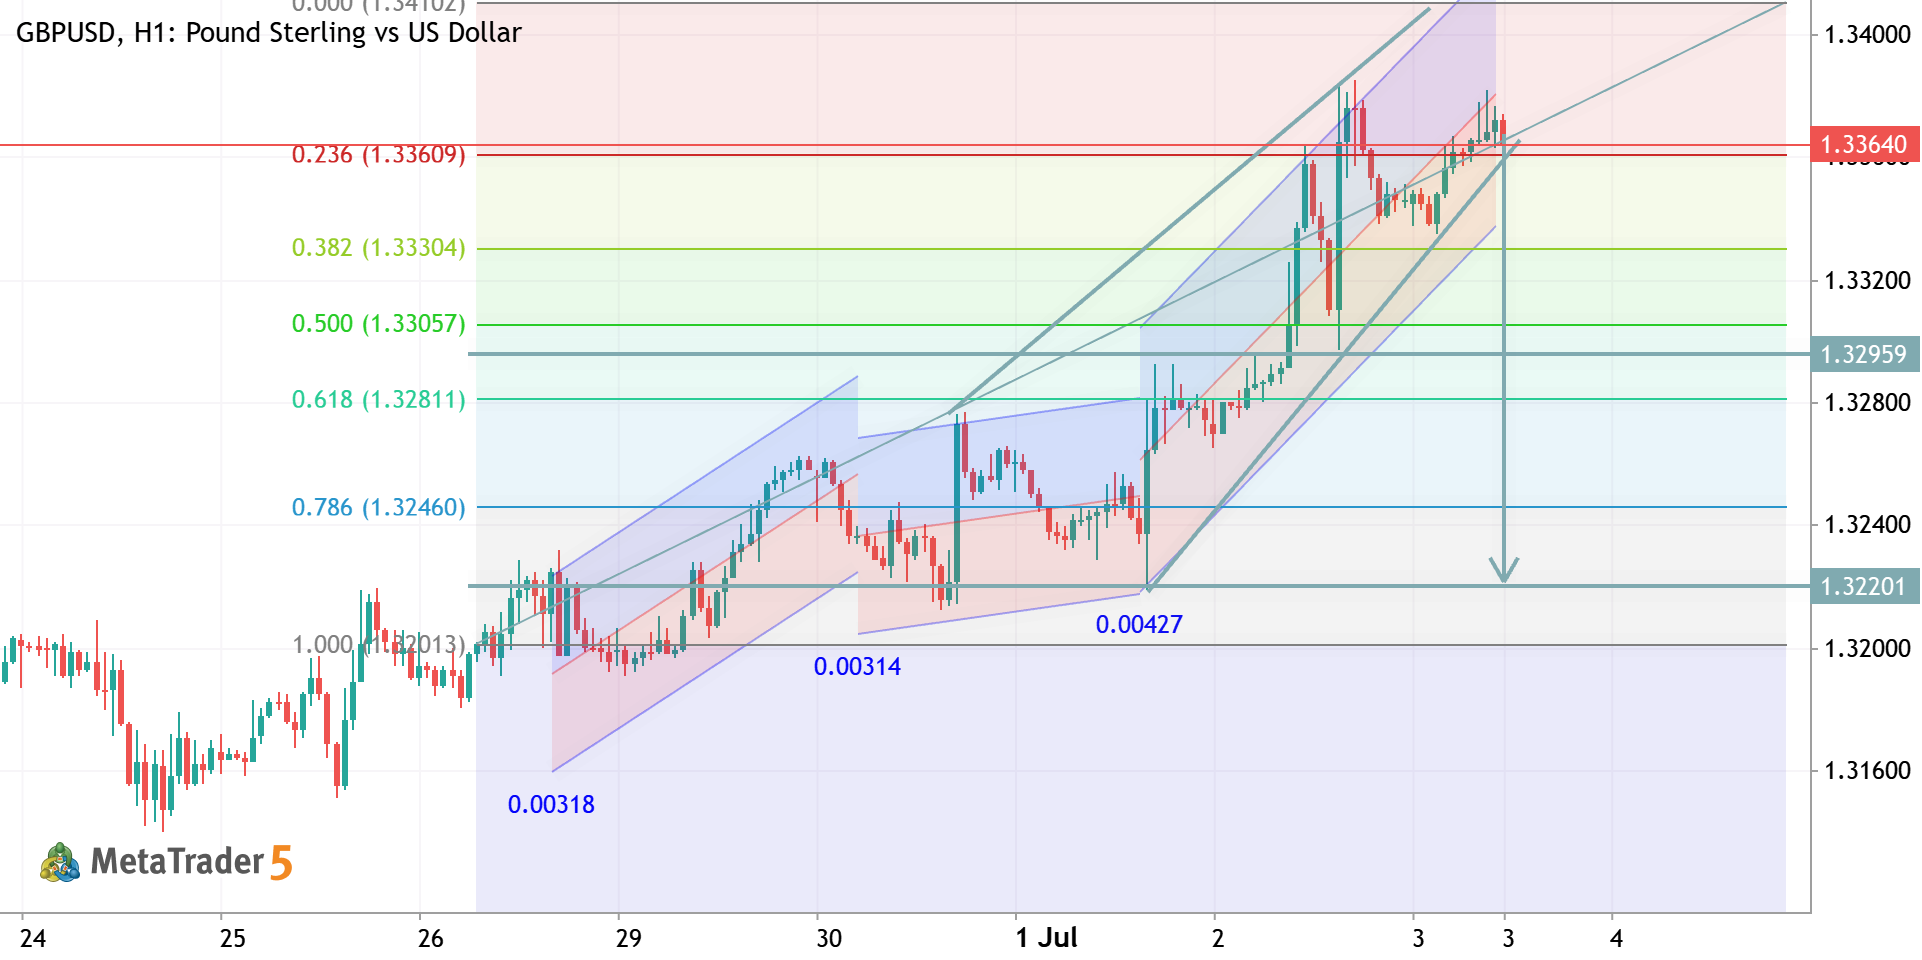
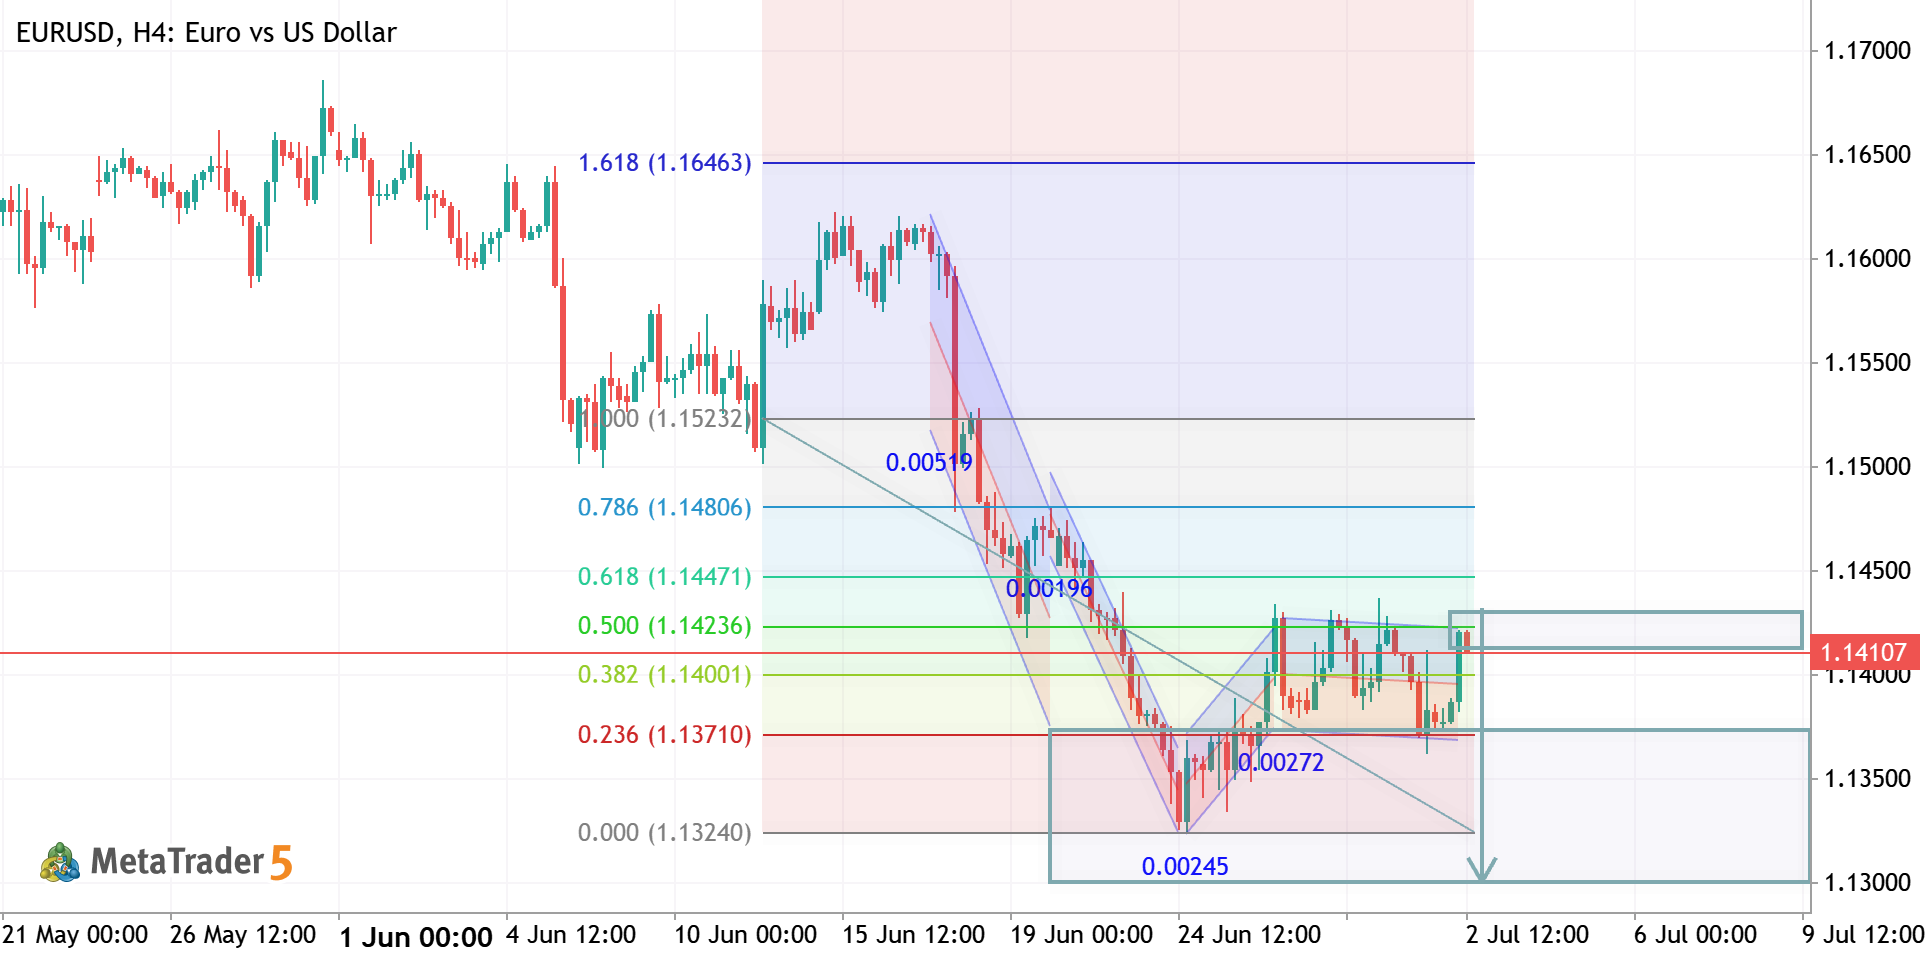
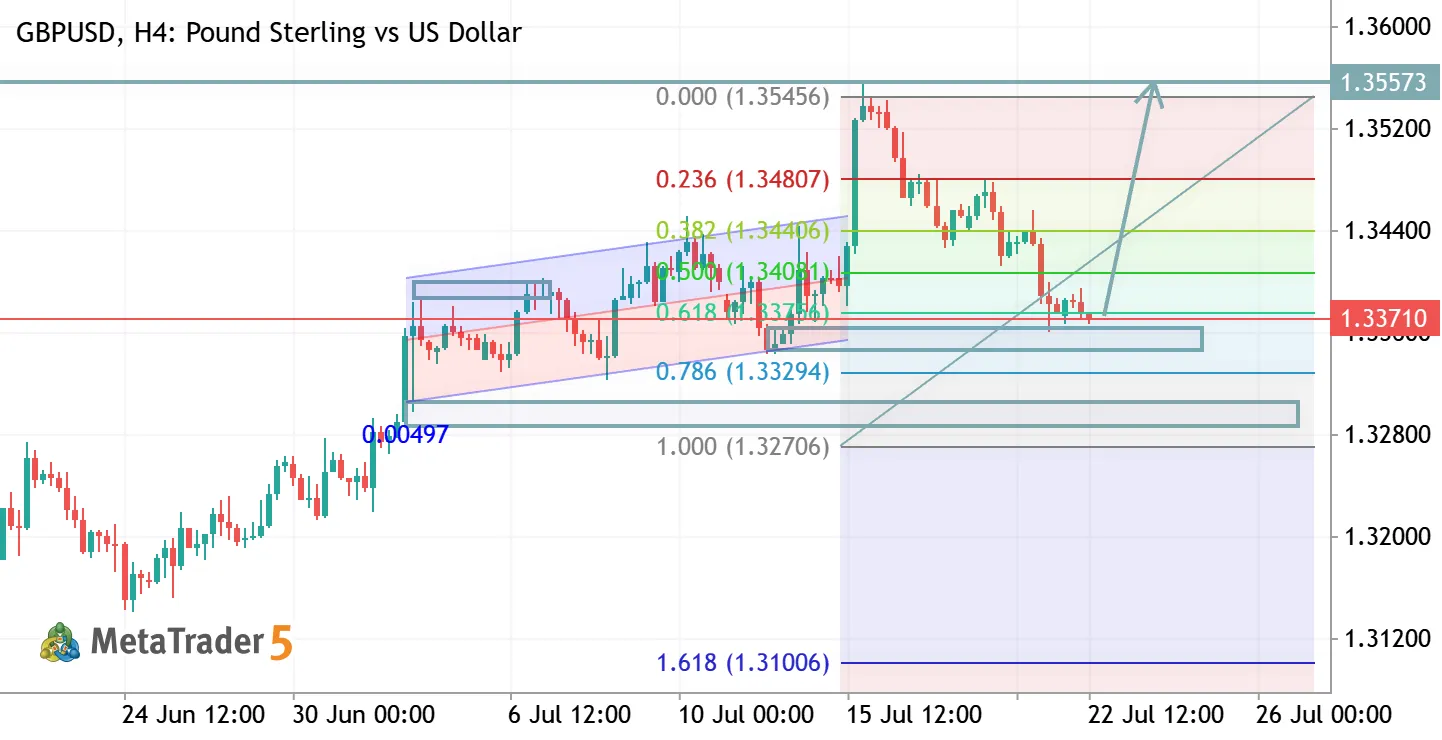
EUR/USD – Bearish Structure Under Resistance Trend: Lower highs forming → descending trendline intact (bearish pressure) Key Zone: 1.1780 – 1.1820 (strong resistance + rejection area) Confirmation: Price failing to break above zone + respecting trendline Sell Trigger: Break below 1.1700 support (clean bearish momentum) Targets: 1.1550 1.1400 (major support) ❌ Invalidation: Sustained close above 1.1820 (trendline breakout) — Clean setup: rejection + structure = downside continuation bias.
2
XKing05 ArmanFx Trader 2026.05.04 08:00
USDZAR - Price Action Daily Analysis USDZAR US Dollar vs Rand
USDZAR - Price Action Daily Analysis
Daily price is on ranging around 200 SMA within 16.66/17.22 s/r channel waiting for the direction, and the Stochastic oscillator is indicating the overbought market condition. If the price breaks support level at 16.66 to below so the primary daily bearish trend will be resumed. If the price crosses 17.22 resistance level to above so the primary daily bullish reversal will be started. Alternatively, the price will be on ranging waiting for direction of the strong trend to be started. Recommendation: waiting for direction
1
newdigital Sergey Golubev 2026.04.04 08:20
USDTHB Price Action Analysis: daily breakout with the bullish reversal USDTHB US Dollar vs Thai Baht
USDTHB Price Action Analysis: daily breakout with the bullish reversal
Daily price broke 200 SMA to above for the good daily breakout with the primary bullish reversal. The price is testing the resistance level at 32.93 to above for the daily bullish trend to be continuing. But the Stochastic Oscillator is indicating the overbought level for the price movement so the alternative way for the price movement is the secondary daily ranging within 32.07/32.93 s/r channel waiting for direction of the strong bullish trend to be continuing or the bearish reversal to be started. Trading Summary: waiting for direction.
1
newdigital Sergey Golubev 2026.03.21 15:49
Trading Ideas for 2026: USD/ZAR - Technical Forecast and Levels USDZAR US Dollar vs Rand
Trading Ideas for 2026: USD/ZAR - Technical Forecast and Levels
Weekly price is located below Ichimoku cloud in the bearish area of the chart. The price was bounced from support level at 15.63 to above for the bear market rally to be started for trying to break the resistance at 17.00 to above for the secondary rally to be continuing. Stochastic oscillator is indicating the oversold level of the price, and Chinkou Spam line of Ichimoku indicator is located to be near historical price from below to be ready to cross it to above for the good breakout to be started. If the price breaks 17.00 resistance to above on weekly close bar so the breakout may be started with the 17.57 bullish reversal target to re-enter, or the price will be on secondary ranging waiting for the direction of the good trend to e started. Trading Summary: future possible breakout with the bullish reversal, alternatively - ranging within s/r channel for direction.
3
newdigital Sergey Golubev 2026.03.21 15:30
Trading Ideas for 2026: USD/COP - Technical Forecast and Levels USDCOP US Dollar vs Colombian Peso
Trading Ideas for 2026: USD/COP - Technical Forecast and Levels
Weekly price broke Ichimoku cloud and it is located in the bearish area of the chart for now: Chinkou Span line of Ichimoku indicator broke historical price to below for the good weekly breakdown. But the Stochastic oscillator is showing the oversold market condition indicating the possible bear market rally in the future. Price is testing the support level at 3618 to below for the primary bearish trend to be continuing. Alternatively, the price may be bounced from support to above for the bear market rally to be started with the secondary ranging condition. Trading Summary: bearish breakdown; waiting for the bearish trend to be continuing or for the ranging with bear market rally to be started; possible bullish reversal in the long-term.
1
newdigital Sergey Golubev 2026.03.11 17:27
USDCHF - Long-Term Forecast USDCHF US Dollar vs Swiss Franc
USDCHF - Long-Term Forecast
Weekly price is located below Ichimoku cloud in the bearish area of the chart. The price is on ranging within 0.7603/0.8040 support resistance channel for direction of the breakout with the bullish reversal or for the bearish trend to be continuing. Stochastic Oscillator is showing the oversold market condition so the breakour or at least the bear market rally is very likely in the near future for example. If the price breaks 0.8040 resistance to above so the primary bullish reversal will be started with 0.8249 target to re-enter. If the price crosses the support level at 0.7603 to below so primary weekly bearish trend will be continuing. Trading Summary: waiting for direction of the strong trend to be started.
1
newdigital Sergey Golubev 2026.02.22 05:53
GBPUSD: Correction to the Bearish Reversal GBPUSD Pound Sterling vs US Dollar
GBPUSD: Correction to the Bearish Reversal
Daily price was bounced from resistance level at 1.3712 to below for the secondary correction within the primary bullish trend to be started. The price is testing descending triangle pattern with 1.3433 support ot below for the support level at 1.3343 as the next possible target for the primary bearish reversal. Alternatively, the price will be on secondary ranging near and above Ichimoku cloud waiting for direction of the strong trend to be started. Trading Summary: correction to the possible bearish reversal.
3
newdigital Sergey Golubev 2026.02.21 07:11
Bullish Breakout for NZDUSD NZDUSD New Zealand Dollar vs US Dollar
Bullish Breakout for NZDUSD
Chinkou Span line broke historical price to above on close weekly bar for the good bullish breakout. The price crosses Ichimoku cloud to be located in the bullish area of the chart. If the price breaks resistance at 0.6120 so the primary bullish trend will be continuing; if the price crosses 0.5927 support level to below for 0.5710 as the possible target to re-enter so the primary bearish reversal will be started; alternatively, the price will be ranging waiting for direction.
2
newdigital Sergey Golubev 2026.02.11 06:14