
Ethereum is struggling to push above $2,400 as buying pressure builds against resistance that has capped the recovery at every recent attempt. The market is heating up — but a CryptoQuant analyst has examined the derivatives data and found a reading that adds important structural context to both the difficulty at the current level and the potential for what comes after it.
The Binance Ethereum Futures Power 30D Change index has moved back into positive territory, registering a current reading of 0.026. In practical terms, this means the composite futures momentum across Binance — incorporating open interest, funding rates, taker volumes, and price behavior — is higher today than it was a month ago. The direction has reversed from the negative readings that defined the period of maximum pressure on Ethereum.
What the analyst is careful to note is where that reading sits in historical context. The 0.026 level remains below the 0.0327 recorded on October 24, 2023 — a reading that appeared during an early recovery phase for Ethereum, before the asset built the momentum that carried it significantly higher in the months that followed. Being below even that early recovery benchmark is the detail that makes the current signal constructive without being alarming.
The derivatives market is recovering. It is not overheating. For Ethereum testing $2,400, that combination describes a market with runway rather than one approaching a ceiling.
Early Positive. Not Overheated. That Distinction Has a History Behind It
The CryptoQuant analyst’s framework for reading the current index level requires understanding what has happened at the extremes. The Binance Ethereum Futures Power index is a composite built from five components — open interest, funding rates, taker long volume, taker short volume, and ETH price behavior. When the 30-day change turns positive, it means the aggregate of those five inputs is collectively stronger today than it was a month ago. The direction matters. The magnitude matters equally.
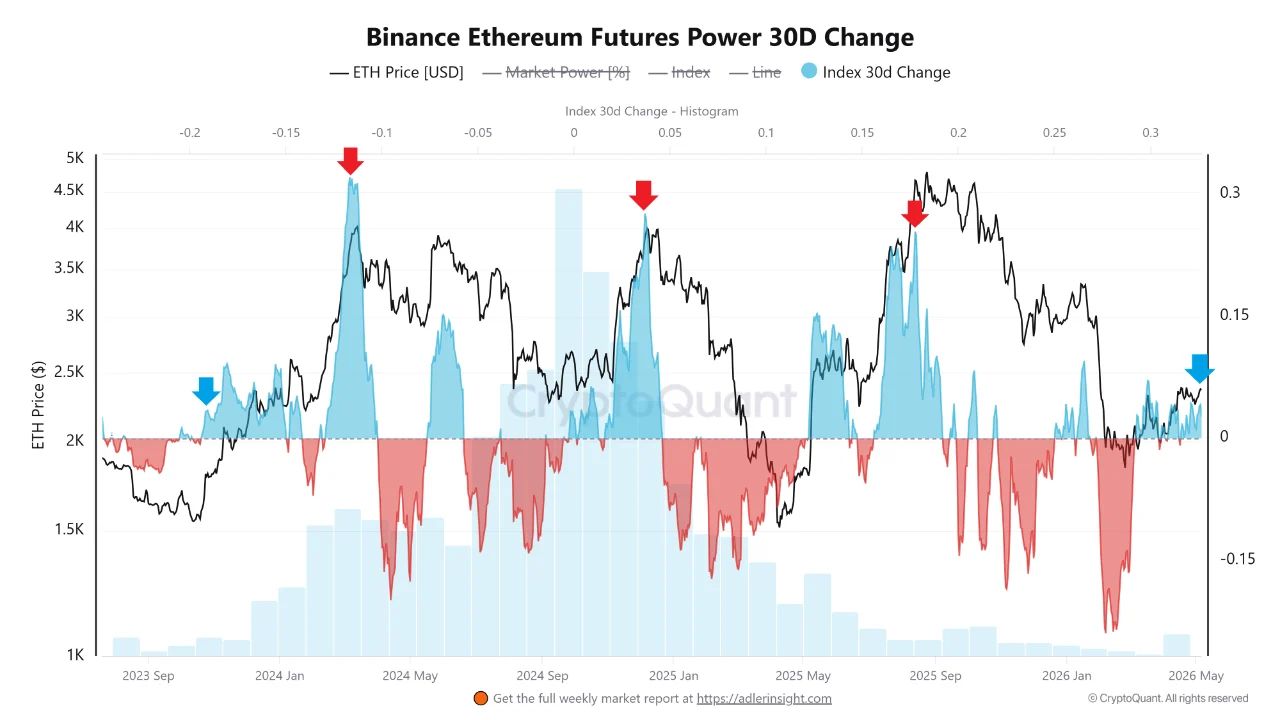
The current reading of 0.026 represents a constructive shift from the negative derivatives pressure that defined the correction phase — a genuine improvement in futures momentum that confirms the recovery has derivatives participation behind it. But the analyst is precise about what this level does not indicate: overheated positioning.
The historical record provides the reference points that make that distinction alarming in its specificity. The most extreme positive zones appeared around March 2024, December 2024, and August 2025. Each of those periods was followed by significant ETH pullbacks — ranging from roughly 44% to 61%. The pattern is consistent enough to function as a warning system: when the index reaches elevated extremes, sharp corrections have followed.
The current 0.026 is nowhere near those extremes. It sits below even the October 2023 early recovery reading of 0.0327 — a period that preceded stronger momentum rather than a correction. That positioning on the historical spectrum is what makes the current setup structurally different from the overheated phases that ended badly. The derivatives market is participating in the recovery without creating the kind of excess that has historically preceded the largest declines.
For Ethereum pushing toward $2,400, that combination of genuine positive momentum and absent excess is the most favorable derivatives backdrop available.
Ethereum Presses Into Resistance With Strengthening Structure
Ethereum is testing the $2,400 level after a steady recovery from its February lows, where capitulation briefly pushed price below $1,800. Since then, the structure has shifted from a clear downtrend into a controlled sequence of higher lows, indicating that buyers are gradually regaining control. The market is no longer trending downward, but it has not yet confirmed a full bullish reversal.
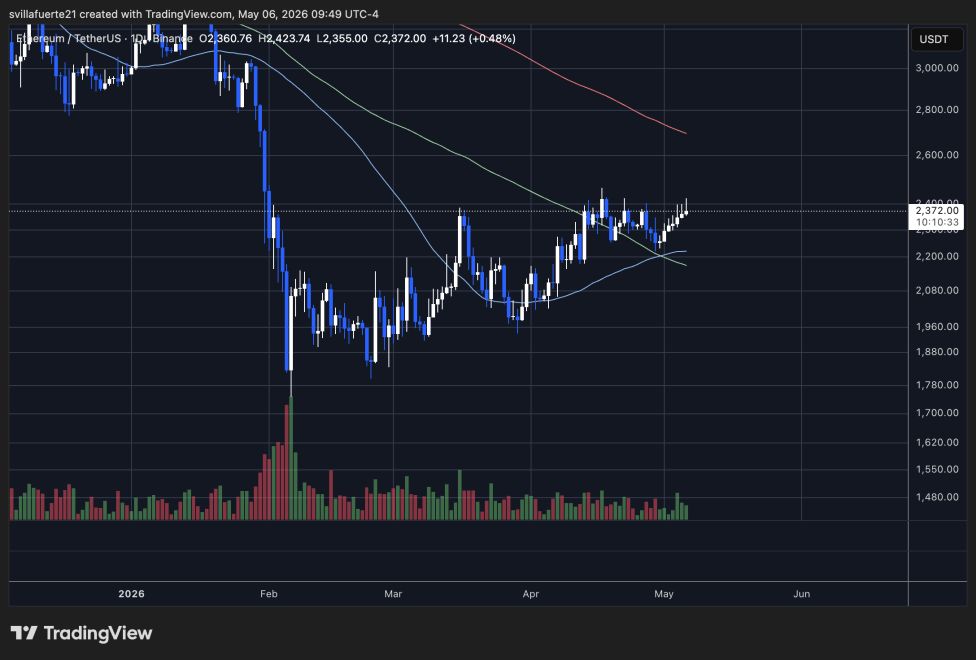
Price is now trading above the 50-day moving average and challenging the 100-day, both of which are flattening after months of decline. This transition typically signals a loss of bearish momentum. However, the 200-day moving average remains significantly above current price and continues to slope downward, reinforcing that the broader trend has not yet turned.
The $2,400 zone is acting as a well-defined resistance level. Multiple recent attempts to break above it have stalled, suggesting that supply remains active at this range. At the same time, dips toward the $2,150–$2,200 area are being bought consistently, creating a tightening structure beneath resistance.
Volume does not show aggressive expansion on this move, which raises some uncertainty about conviction. A confirmed breakout above $2,400 would likely open the path toward $2,700. Rejection would keep Ethereum range-bound in the near term.
Featured image from ChatGPT, chart from TradingView.com