
Tickers relacionados
| # | Nombre | Precio | 24h % | 7d % | 1M % | 1A % | Últimos 7 días | |
|---|---|---|---|---|---|---|---|---|
| 1 | LTCUSD Litecoin vs US Dollar | 59.05 USD | -0.49% | -4.43% | +1.23% | -36.21% | ||
| 2 | ETHUSD Ethereum vs US Dollar | 2395.58 USD | -0.48% | -5.33% | -9.04% | -40.02% | ||
| 3 | MBTUSD milliBitcoin vs US Dollar | 81.591 USD | -0.27% | -2.34% | +0.78% | -24.94% | ||
| 4 | ETCUSD Ethereum Classic vs US Dollar | 7.715 USD | -0.37% | -6.01% | -8.78% | -51.46% |
Noticias
CZ dice que Peter Schiff tendrá razón sobre Bitcoin algún día, pero hay un detalle
La altseason pierde terreno rápidamente mientras aumenta el dominio de Bitcoin
BTC/USD Hoy 19/10: Bitcoin Prueba Resistencia de $82.875
Forex Hoy 19/10: Euro Bajo Presión con la Mirada en Francia
Bitcoin sube hasta cerca de 83.000 dólares por el alivio del petróleo
¿Bitcoin está listo para las computadoras cuánticas? Lo que muestra el nuevo plan de Coinbase
Bitcoin Resiste en $81.000 Mientras Caen las Altcoins
Pares en Foco: Inflación en EE. UU. Sorprende a los Mercados
Forex Semana 19 a 23/10: Ocho Mercados Bajo Presión
Google supera obstáculo clave en la computación cuántica: ¿Qué significa para Bitcoin?
Wallets de ballenas de Bitcoin registran máximo histórico mientras los bajistas abren más posiciones cortas: ¿Qué sigue?
Gráficos e ideas
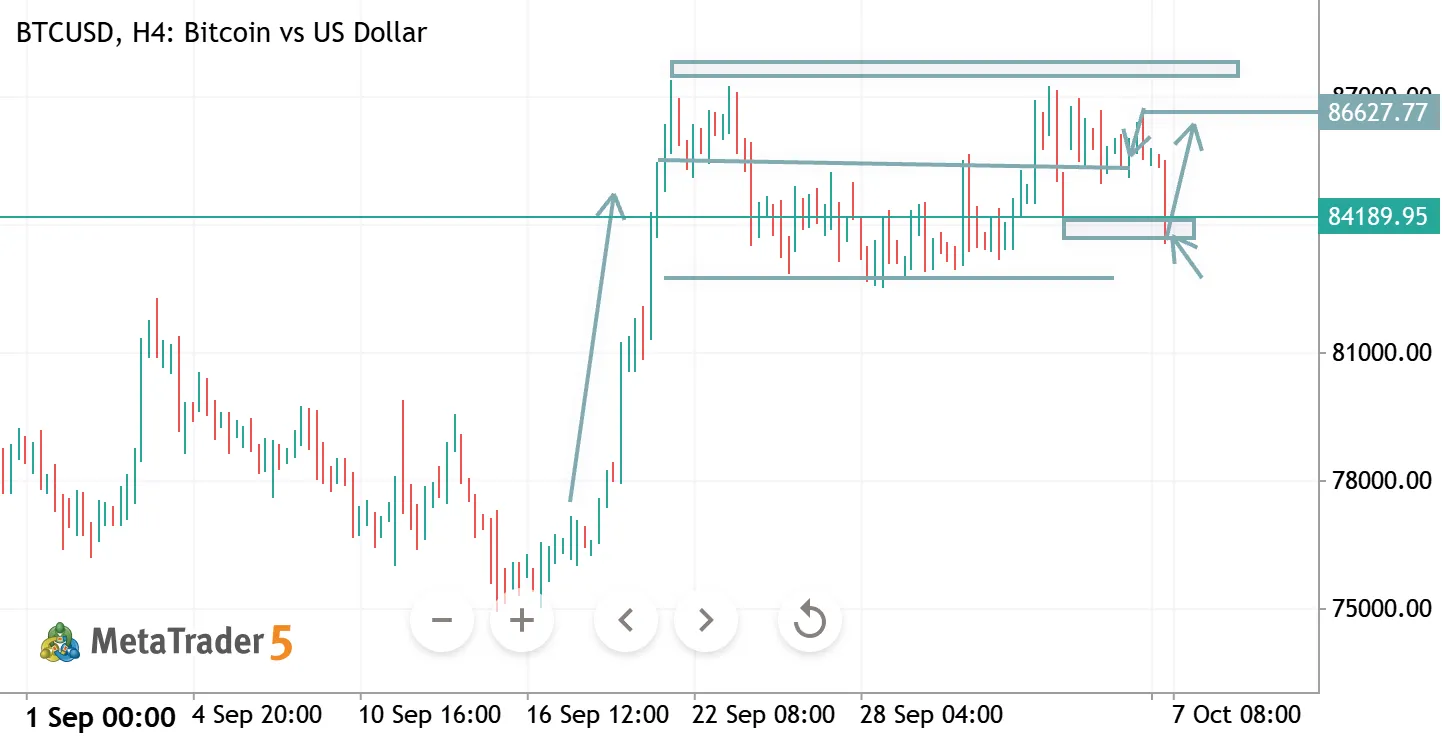
BTCUSD H4 ANALYSIS
BTCUSD H4 Analysis
BTC is consolidating near 84,100 after a strong recovery. The 84,000–84,500 zone is key support; holding above it could push price back toward 86,700–88,000.
🔹 Support: 84,000–84,500 🔹 Resistance: 86,700–88,000 🔹 Bias: Bullish above 84,000 🔹 Key Trigger: Break above 86,700 → upside continuation.

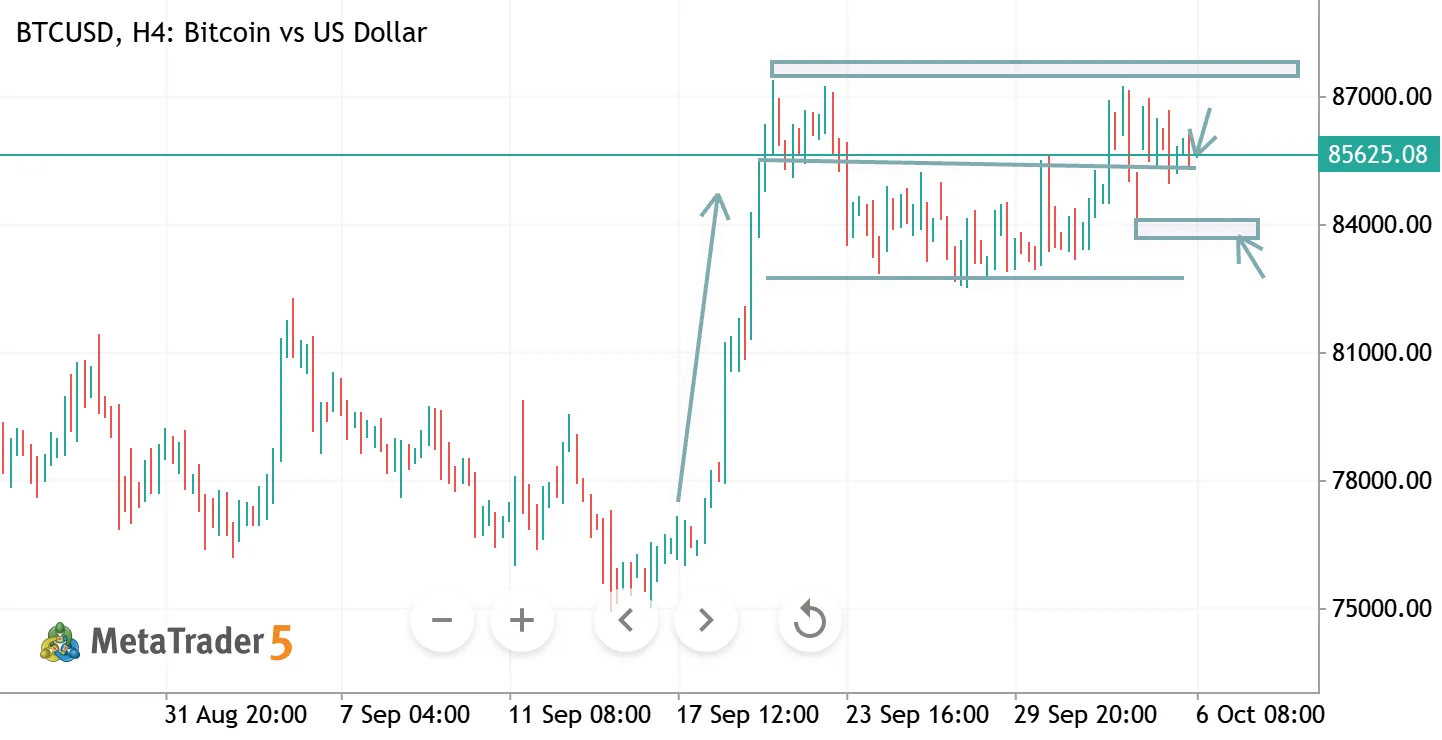
BTCUSD H4 ANALYSIS
BTCUSD H4 Analysis
BTC is consolidating below the 86,000–87,000 resistance zone after a strong recovery. A breakout above this area could resume the bullish move toward 88,000, while rejection may pull price back toward 84,000–82,500.
🔹 Resistance: 86,000–87,000 🔹 Support: 84,000–82,500 🔹 Bias: Bullish above 84,000 🔹 Key Trigger: H4 close above 87,000 → upside continuation.
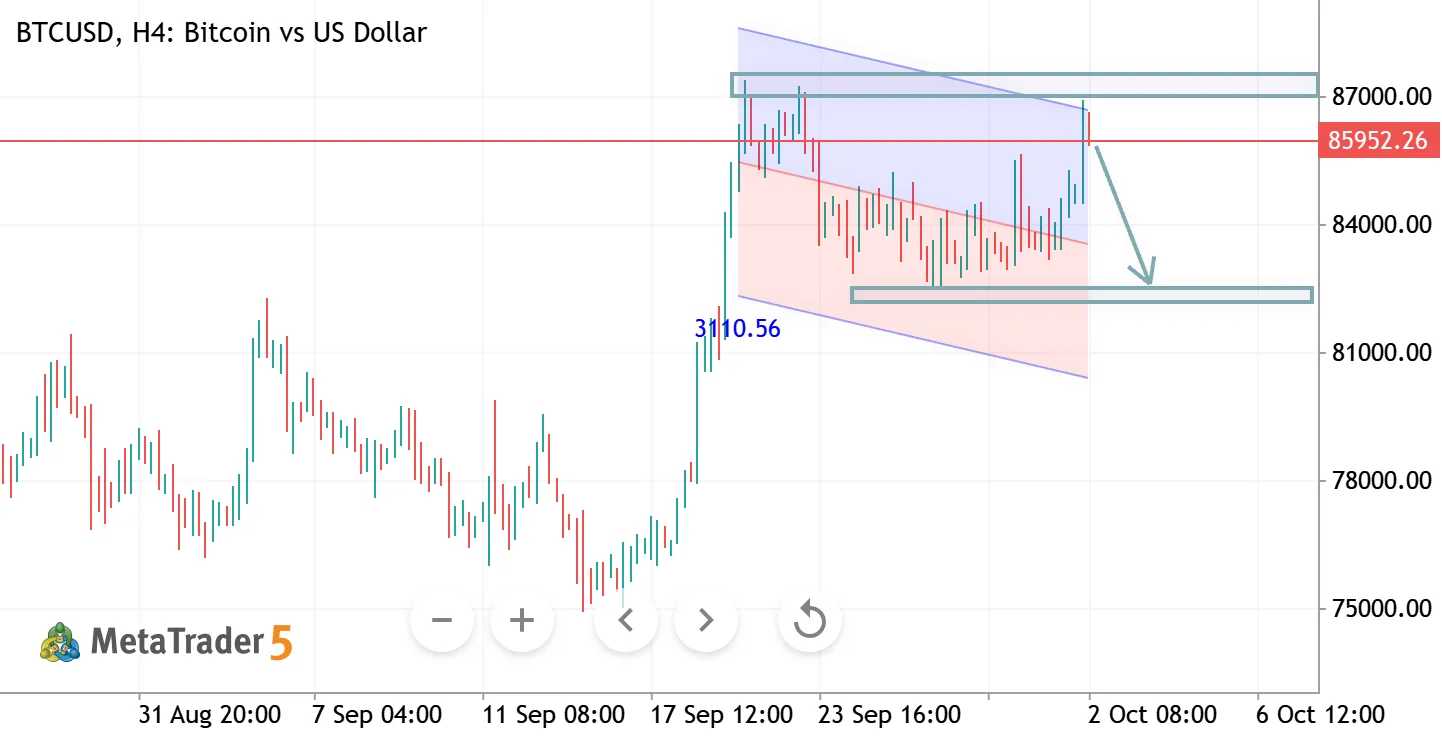
BTCUSD H4 ANALYSIS
BTCUSD H4 Analysis Bitcoin is testing a major resistance zone around 85,800–86,500 after a strong recovery. Rejection here could trigger a pullback toward the 82,000 support zone. 🔹 Resistance: 85,800–86,500 🔹 Support: 82,000–82,500 🔹 Bias: Bearish below 86,500 🔹 Key Trigger: Break above 86,500 → bullish continuation; rejection → downside toward 82,000.
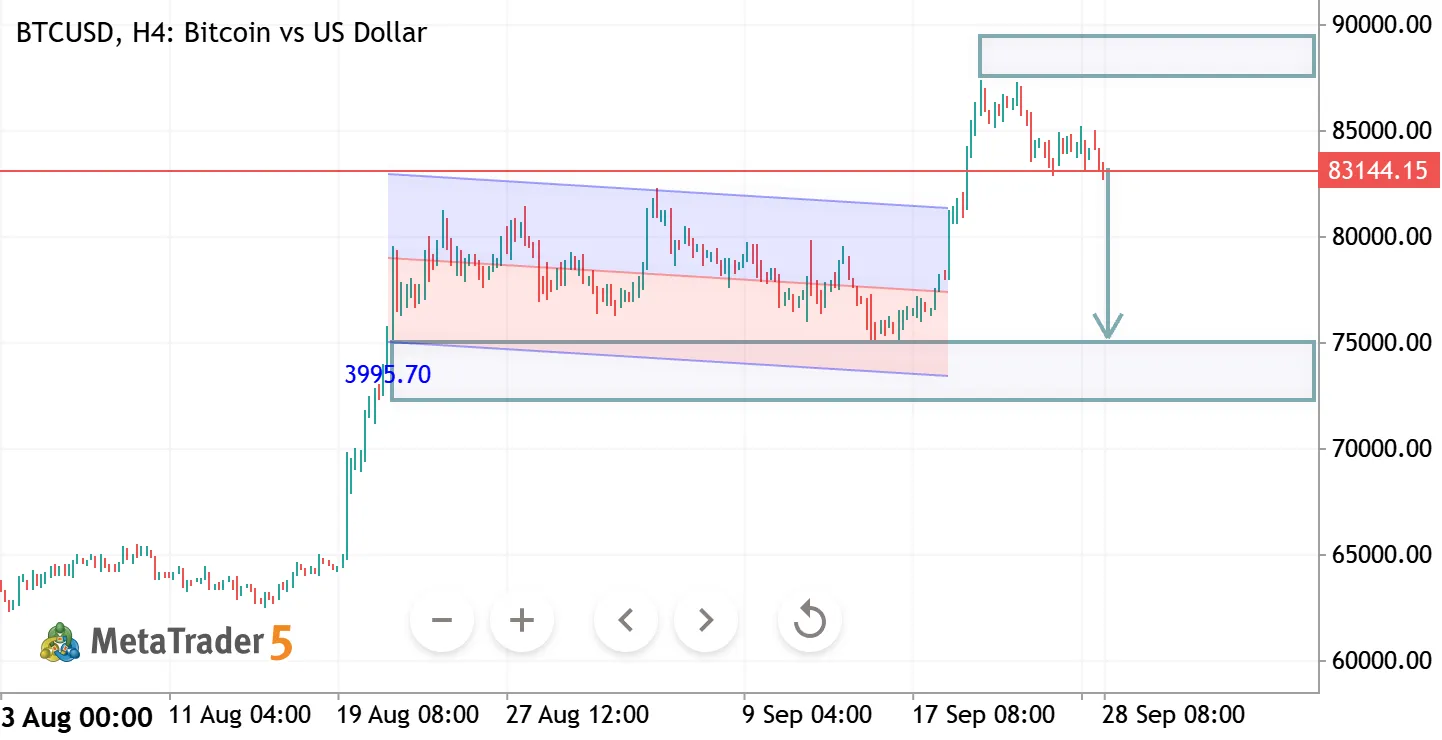
BTCUSD H4 ANALYSIS
GBPUSD – Technical Analysis 📊
GBPUSD is showing signs of a potential bullish reversal after moving within a descending channel. Price is holding around 1.3230, with the chart indicating a possible move toward the 1.3380–1.3400 resistance zone.
🔹 Support: 1.3200–1.3230 🔹 Target Zone: 1.3380–1.3400 🔹 Key Level: Sustained strength above 1.3260 would support the bullish setup.
Disclaimer: Technical analysis is based on chart structure and is not financial advice.
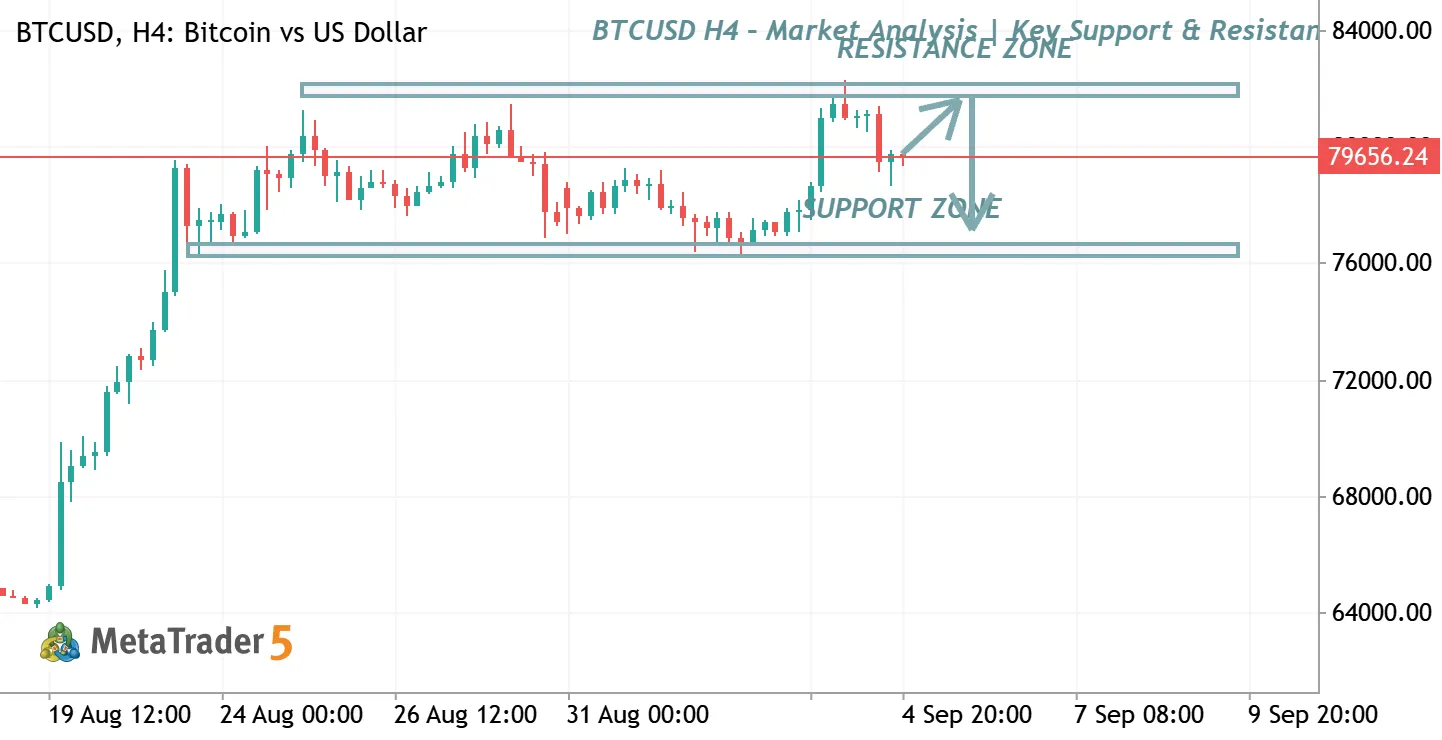
BTCUSD H4 – Market Analysis | Key Support & Resistance
BTCUSD is currently trading between important support and resistance zones on the H4 timeframe. Price is approaching a critical area where traders should watch for confirmation of either a bullish breakout toward the resistance zone or a bearish rejection toward support . 📈 Bullish Scenario: Break and hold above resistance may open the way for further upside.
📉 Bearish Scenario: Rejection from resistance could lead price back toward the major support zone. ⚠️ Trade with proper risk management and wait for confirmation before entering

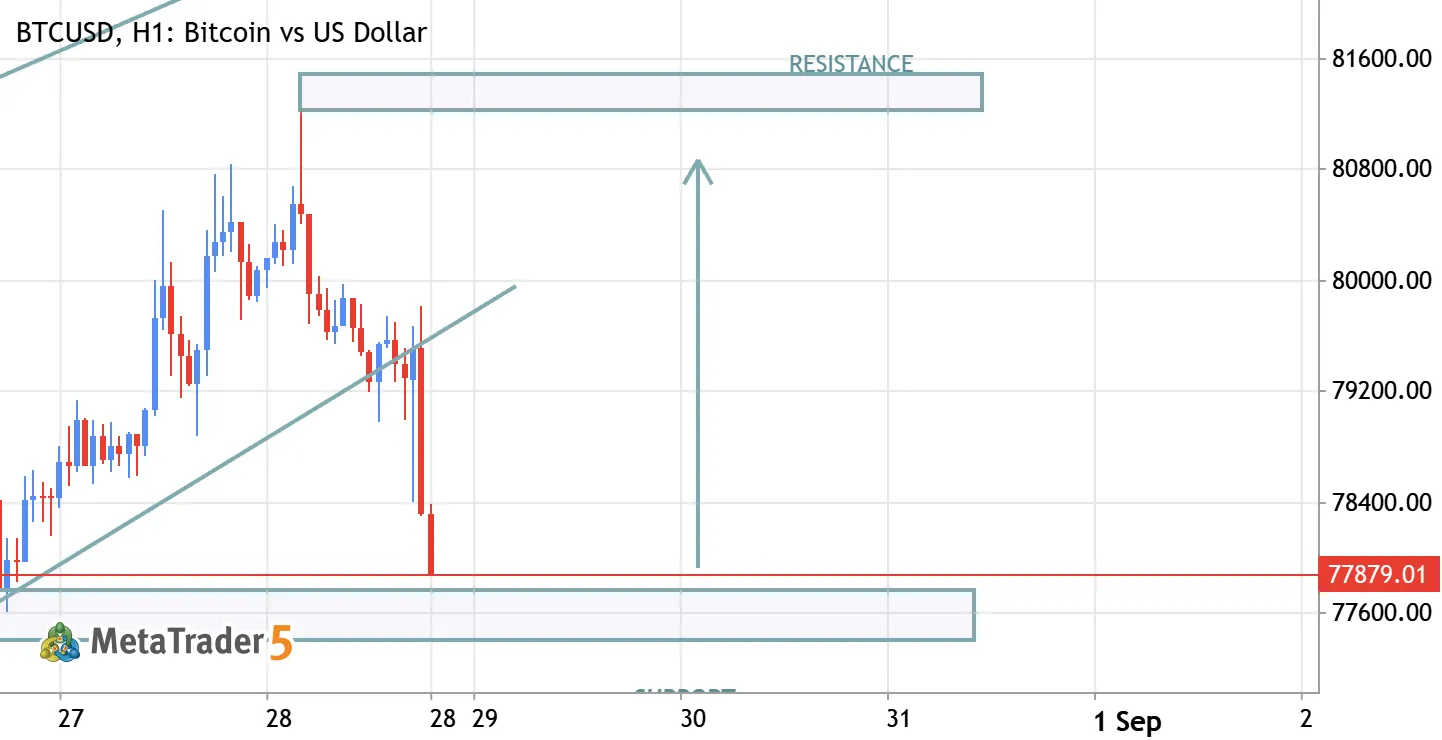
BTCUSD BULLISH TREND AFTER SUPPORT
BTCUSD BULLISH FROM SUPPORT TARGETS 81600


Actualmente no hay otras ideas comerciales para BTCUSD
Eche un vistazo a ideas comerciales ya preparadas o seleccione un símbolo y cree la suya propia
Ir a los gráficos e ideas comerciales