
Bitcoin is struggling as the price loses the $80,000 level and the market faces a wave of selling pressure that has erased the confidence built during weeks of recovery. The breakdown raises an immediate question that a CryptoQuant report has now answered with uncomfortable precision: what was actually driving the rally that carried Bitcoin back toward $82,000 — and why is it now fading?
The report’s finding reframes the entire recovery in a single diagnosis. The recent Bitcoin advance appears to have been driven primarily by a derivatives-led short squeeze rather than by the kind of organic spot demand that characterizes sustainable bull market advances. Short sellers who had accumulated positions during the correction were forced to cover as the price moved against them — creating buying pressure that pushed Bitcoin higher without the underlying spot market activity that would typically accompany a genuine recovery.
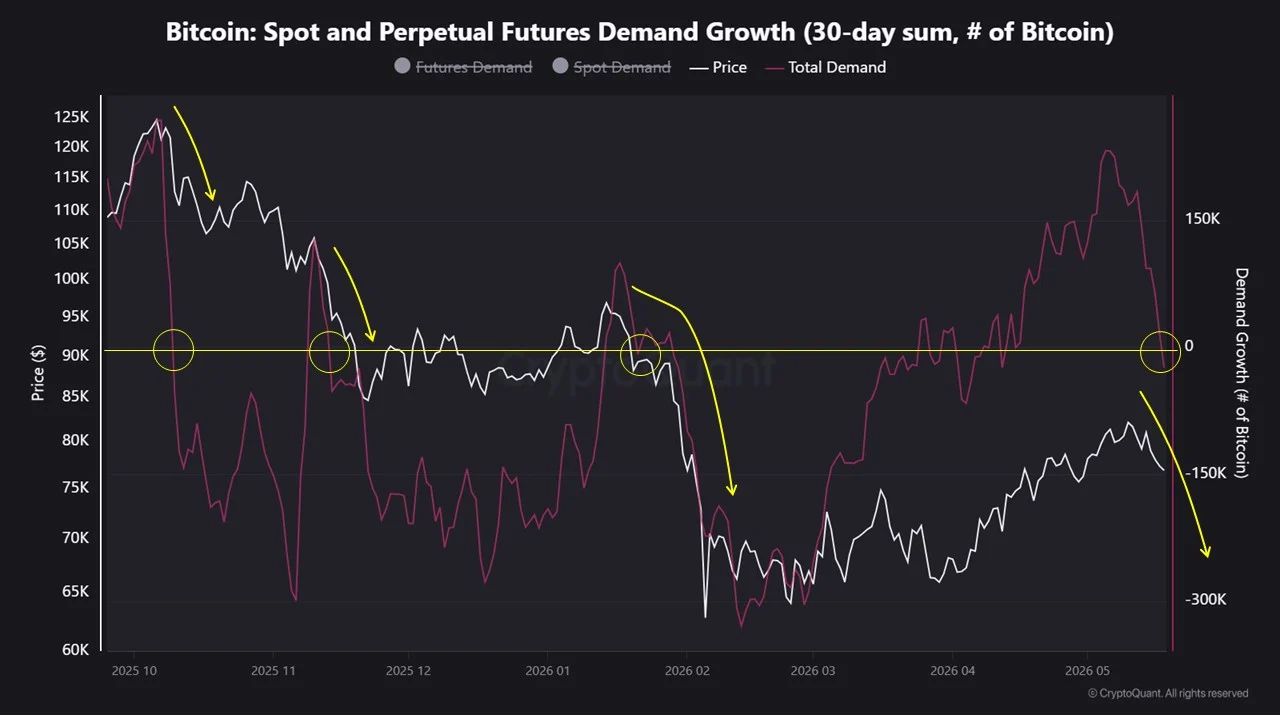
That distinction carries a specific forward implication. Short squeeze-driven rallies are mechanical rather than fundamental — they run as long as there are shorts to force out, and they exhaust themselves when that supply of forced buyers is depleted. The CryptoQuant data suggests that depletion has arrived. Spot market demand has failed to generate the new inflows required to sustain the move independently, and futures demand has begun declining rapidly.
The result is a Bitcoin that reached the upper boundary of its resistance zone on borrowed momentum — and is now facing the consequences of that foundation proving insufficient.
The Historical Playbook Is Not Encouraging
The CryptoQuant report places the current demand deterioration in a historical framework that removes ambiguity about what typically follows. During previous bearish phases, whenever Bitcoin’s total demand — the combined reading across spot and futures markets — fell below zero, the asset either declined further or entered extended periods of sideways consolidation before finding a genuine directional catalyst. The current reading has crossed that threshold, placing Bitcoin in the same structural category as those prior episodes.
The macro environment adds pressure from outside the crypto market simultaneously. Rising sovereign bond yields across major economies are tightening the financial conditions that influence risk asset allocation — a dynamic that reduces the pool of capital available for speculative positioning and increases the attractiveness of fixed-income alternatives relative to assets like Bitcoin. That external pressure does not create the demand weakness, but it makes the recovery of demand considerably harder to achieve while it persists.
The selling pressure increasingly visible on US-based exchanges adds the domestic dimension. When American exchanges show elevated sell-side activity, it reflects the institutional and retail participants most sensitive to macro conditions, reducing their exposure — the cohort whose return would be most meaningful for a genuine demand recovery.
The report’s forward assessment is honest and conditional. A technical rebound remains possible given the scale of the recent short-term decline — oversold conditions create mechanical bounces regardless of underlying structure. But the downward trend pressure is likely to persist until total demand recovers meaningfully above zero. A bounce that occurs without that demand recovery is a bounce that faces the same structural headwinds that produced the current breakdown — and those headwinds do not resolve simply because the price temporarily moves higher.
Bitcoin Tests Critical Support As Recovery Momentum Weakens
Bitcoin is attempting to stabilize near the $77,000 level after losing momentum below the local highs around $82,000. The daily chart shows BTC pulling back directly into a critical support confluence formed by the 200-day moving average near $75,000 and the previous breakout zone between roughly $73,000 and $74,000. That area acted as resistance throughout March and early April before Bitcoin finally broke above it during the latest recovery phase. Now, the market is testing whether former resistance can successfully flip into support.
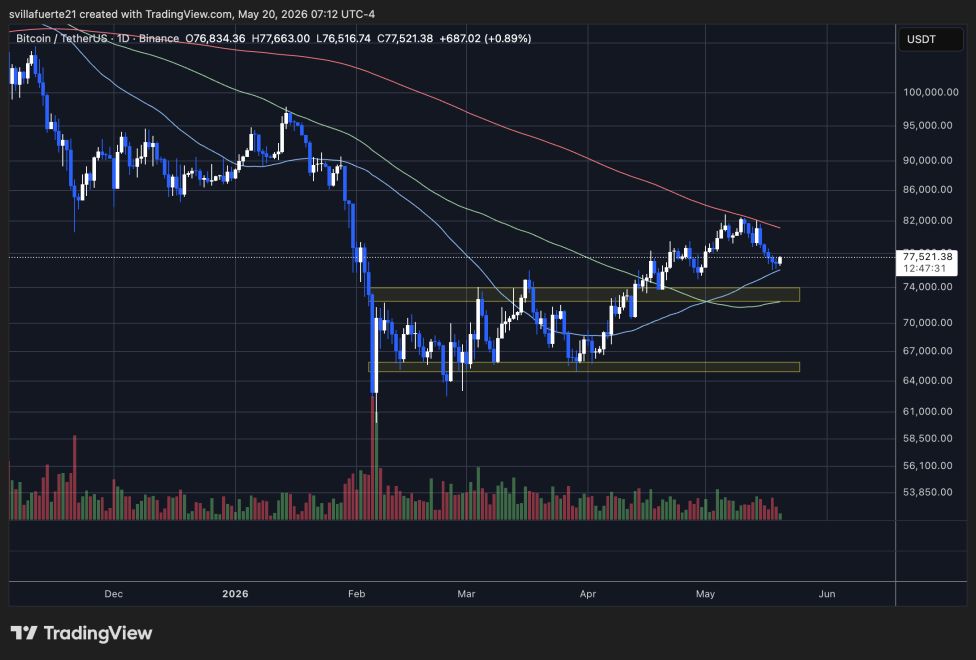
The rejection from the 200-day exponential moving average near $81,000 remains technically important. BTC briefly pushed into that region but failed to sustain upside momentum, confirming that sellers are still defending higher levels aggressively. At the same time, volume during the recent decline has not expanded dramatically compared to the capitulation phase seen in February, suggesting that the current move resembles a corrective retracement rather than a panic-driven breakdown.
Short-term structure remains fragile. Bitcoin continues trading below the declining 200-day EMA while attempting to hold above the 200-day SMA, leaving the market trapped between bearish momentum overhead and structural support underneath. If bulls lose the $73,000–$75,000 zone, the next major support sits near the $65,000 region highlighted by the February accumulation range.
Featured image from ChatGPT, chart from TradingView.com