Bitcoin’s derivatives market has yet to fully heal from a violent shakeout last October, when roughly 71,000 BTC worth around $11 billion was wiped from open interest across major exchanges.
Total open interest has not recovered to pre-event levels, leaving a gap of more than 24,000 BTC that signals many traders are still sitting on the sidelines.
Derivatives Damage Still Visible
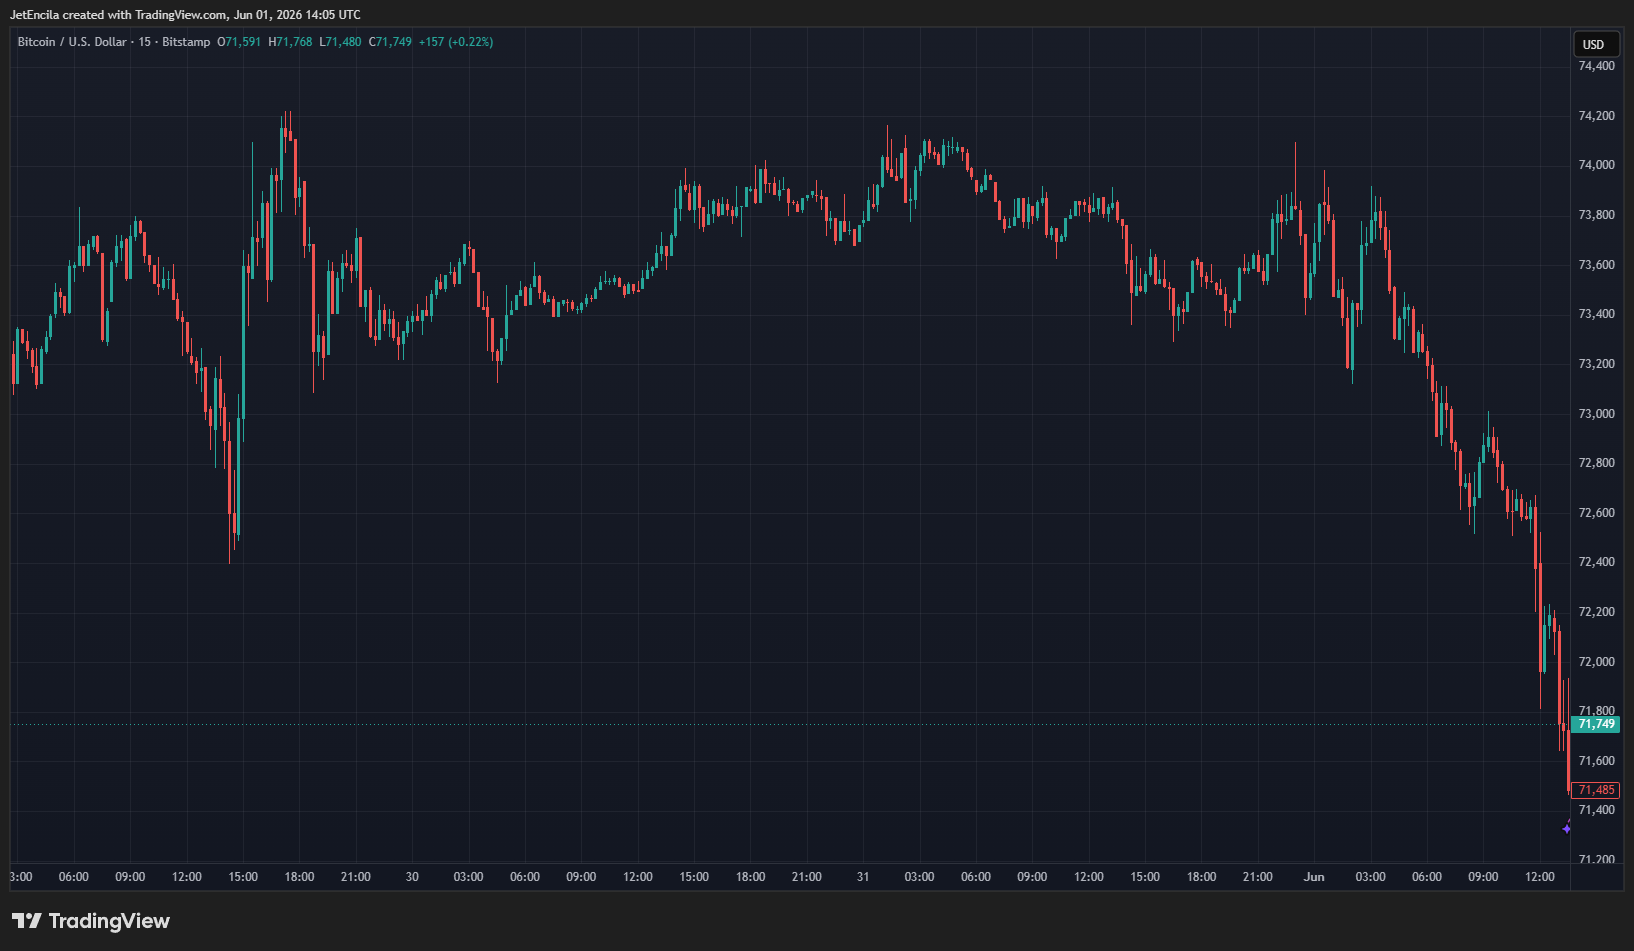
That cautious positioning sits at the center of growing concern about where Bitcoin heads next. The world’s largest cryptocurrency closed May at $73,560, down 3.40% for the month, and at least two closely watched analysts say the slide may not be over.
Prominent on-chain analyst PlanB framed the debate plainly. He said the market is roughly split on whether the February low near $60,000 marked the bottom of this cycle or whether a steeper drop is still ahead, and based on his reading of the data, he leans toward more downside.
Bitcoin closed May at $73,568
Market is 50/50 on if Febryary $60k was the bottom, or the bear will continue.
IMO data is telling us that we have not seen bottom formation yet, and that there is a >50% probablility that we go lower (below 200wma $61k or realized price $53k). pic.twitter.com/4uxdxH5oGA
— PlanB (@100trillionUSD) June 1, 2026
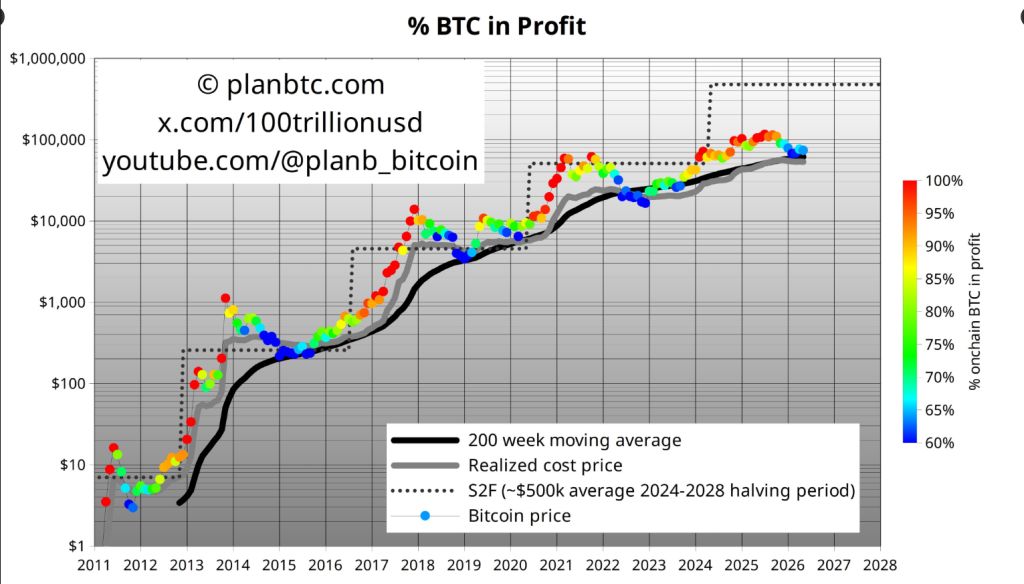
PlanB’s view rests on a chart tracking how much of the total Bitcoin supply is currently sitting in profit. In past bear market cycles, major bottoms typically formed when only a small share of holders were in the green and fear was widespread.
Right now, data shows a higher proportion of holders still in profit compared to those historical trough periods, which PlanB says means the market has not yet hit the kind of full panic, or capitulation, that usually marks a true bottom.
Two Levels Now In Focus
He puts the odds of prices moving lower above 50%, with two long-term indicators as potential landing zones. The 200-week moving average sits near $61,000 and has held as strong support in previous downturns. The realized price, which reflects the average cost basis across the entire Bitcoin supply, is near $53,000.
Trader Ted Pillow flagged a nearer-term threshold. He said a daily close below $70,000 could trigger a fresh wave of selling, noting that the level has absorbed repeated pressure in recent weeks and that losing it would likely shake short-term trader confidence.
What Needs To Happen For A BottomThe picture that emerges from both analysts is one of a market waiting for a cleaner flush before conditions line up for a sustained recovery. Open interest on the derivatives side remains depressed, sentiment is fragile, and the percentage of holders in profit has not fallen to the lows that have historically coincided with cycle bottoms.
PlanB said prices could fall below $61,000, with the 200-week moving average offering the first major test and the realized price near $53,000 representing a deeper level of potential support. Bitcoin would need to move toward either of those levels for the current setup to more closely resemble the bottoming patterns seen in prior cycles.
Featured image from Unsplash, chart from TradingView