
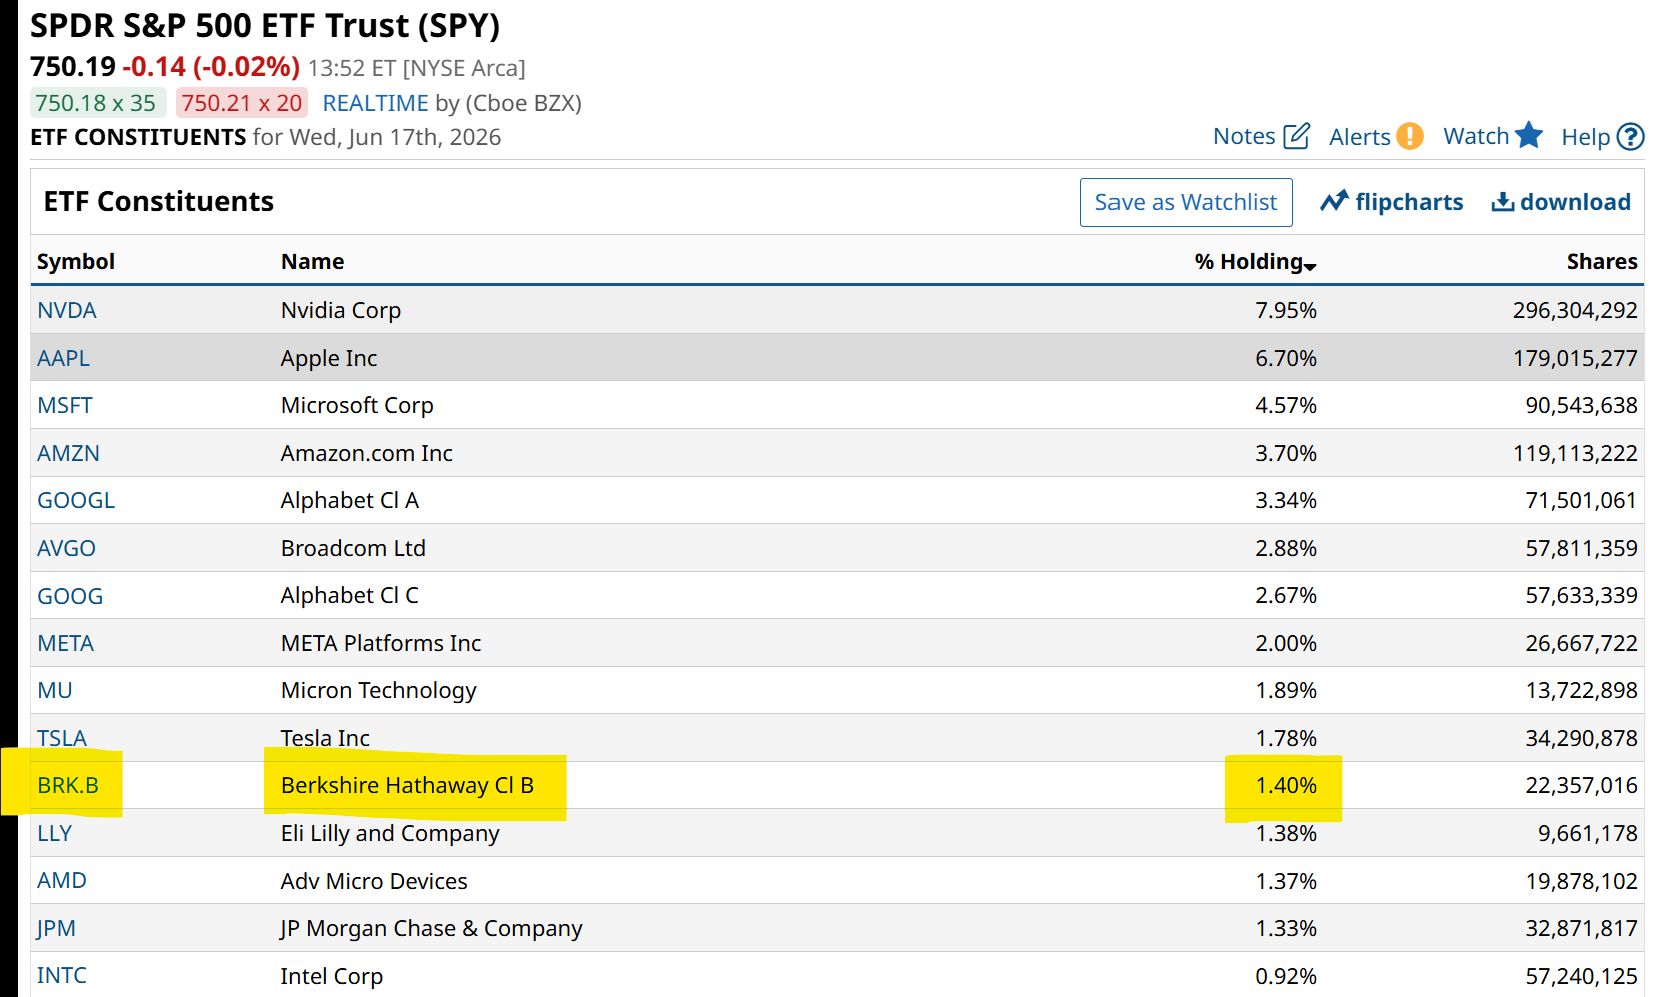
There it is. Warren Buffett and Charlie Munger’s legacy, quietly hiding in the middle of a list of the top S&P 500 Index ($SPX) components by weight. And with SpaceX (SPCX) just waiting its turn to knock it down another peg. As Tesla (TSLA), Micron (MU), and many others have done over the decades.
 www.barchart.com
 I’ve developed a theory that Berkshire Hathaway (BRK.A) (BRK.B) might be one of the best indications we have right now that the stock market is in deep horse manure. Something which, as a racehorse owner, I’ve become quite familiar with.
Join 200K+ Subscribers: Find out why the midday Barchart Brief newsletter is a must-read for thousands daily.
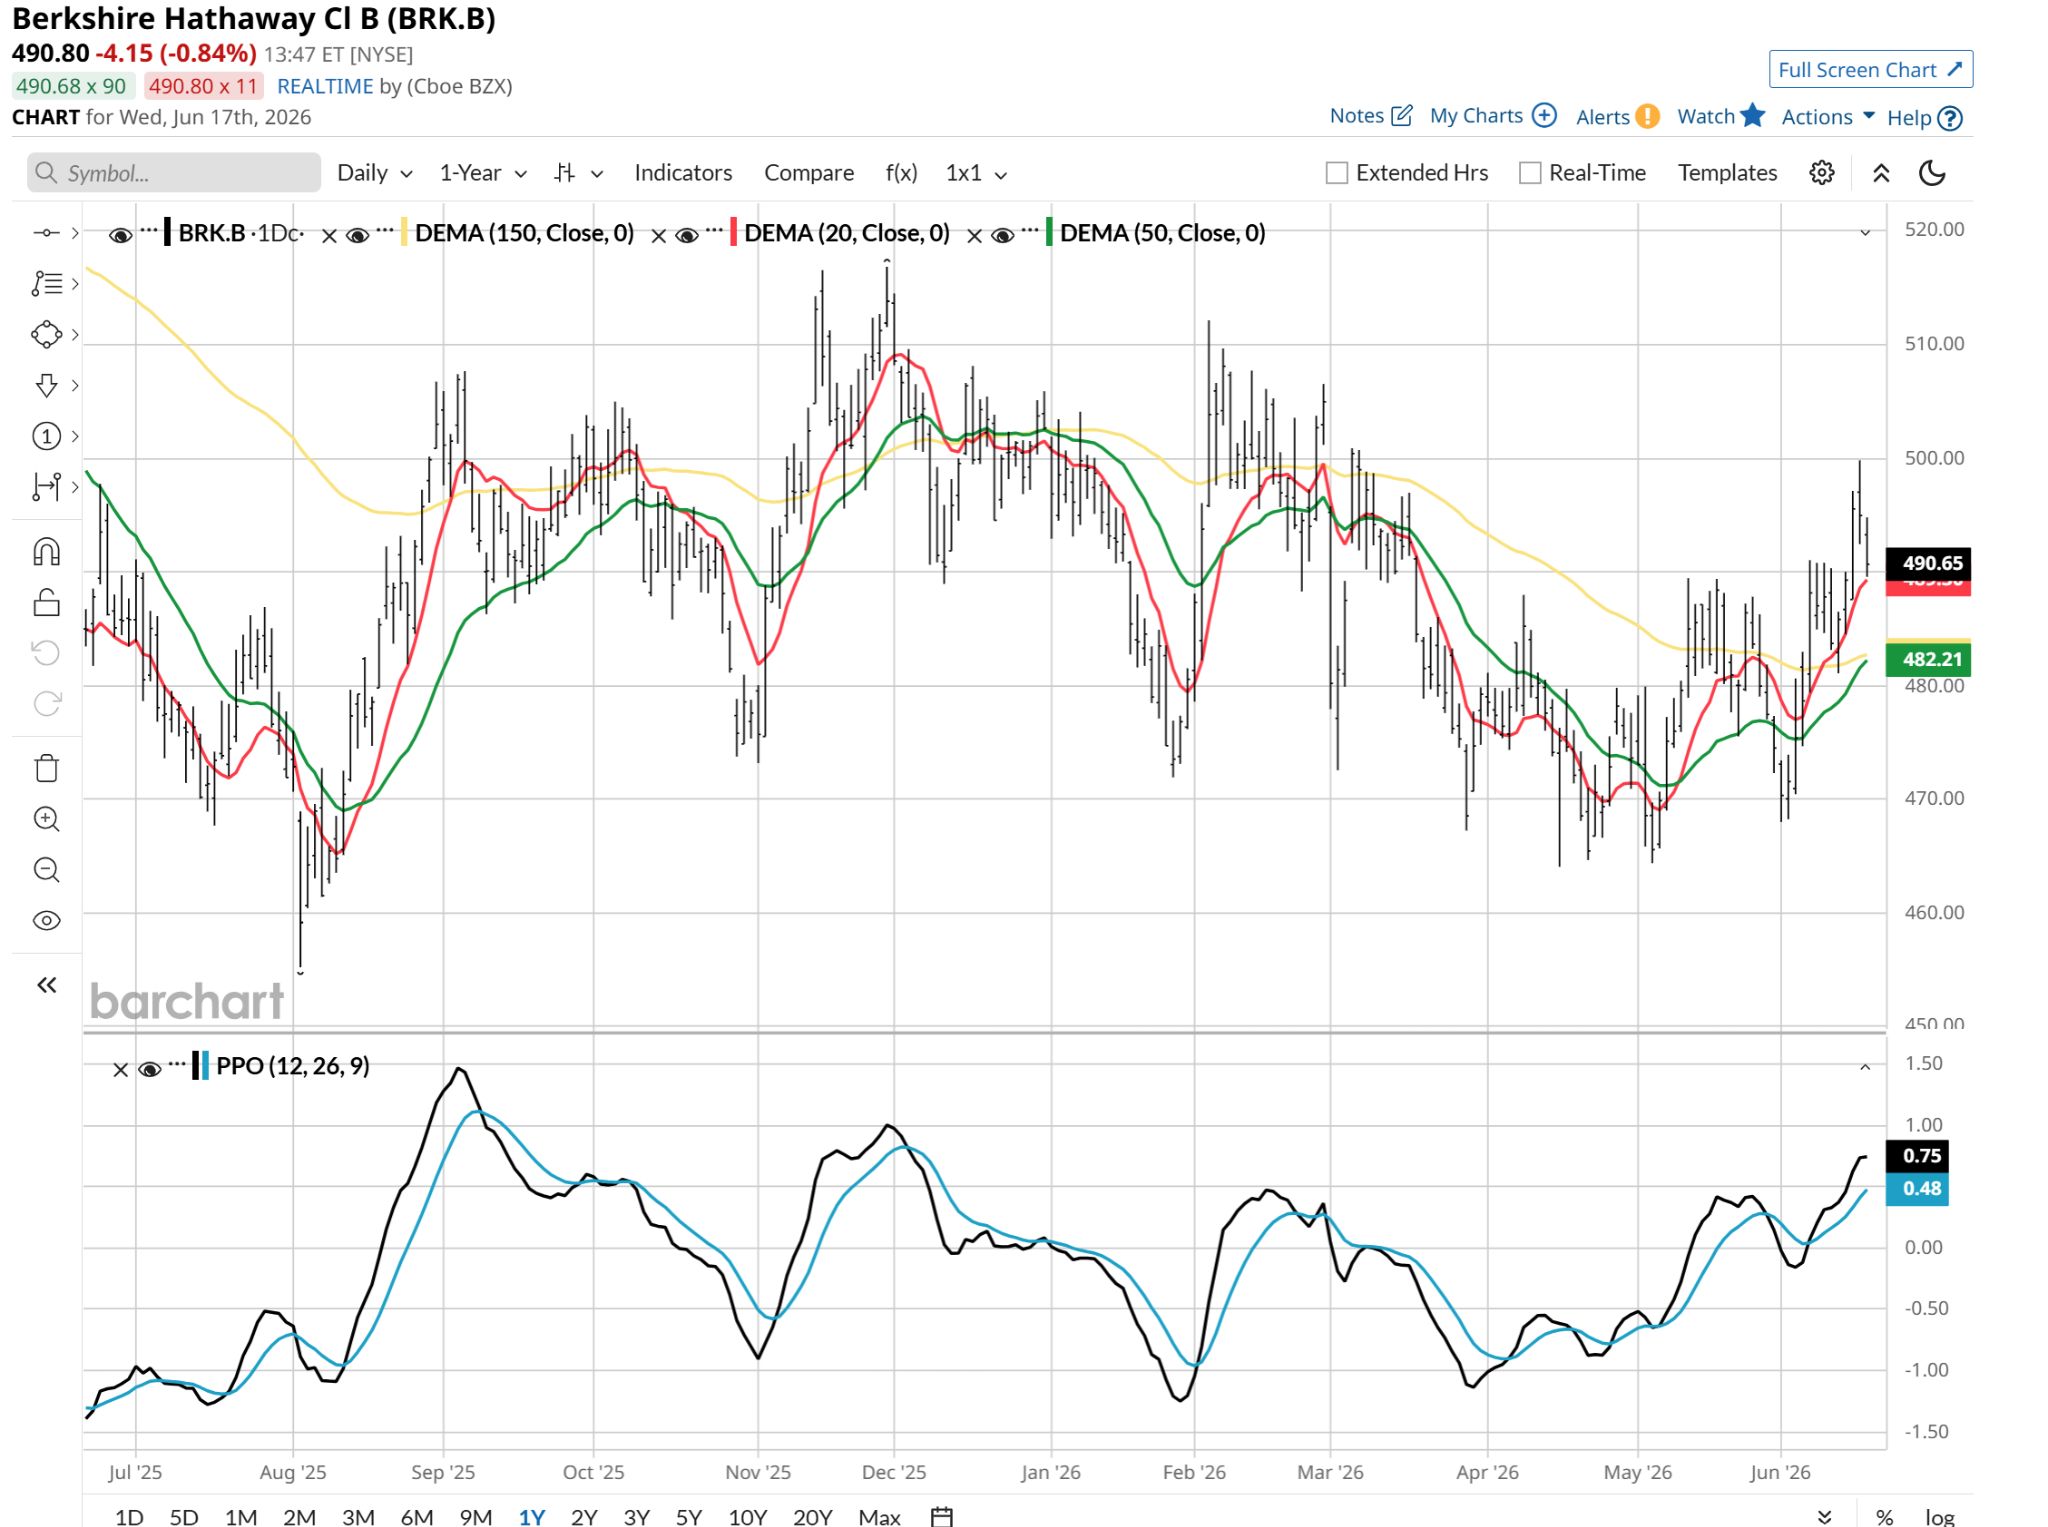
Here’s my take, based on the chart of Berkshire class B shares. Notice anything odd over the past 12 months? What you should notice is that there’s not much going on. The stock is flat. And has not been too volatile either. That massive cash pile that Buffett left his successors with is part of the valuation equation for investors.
 www.barchart.com
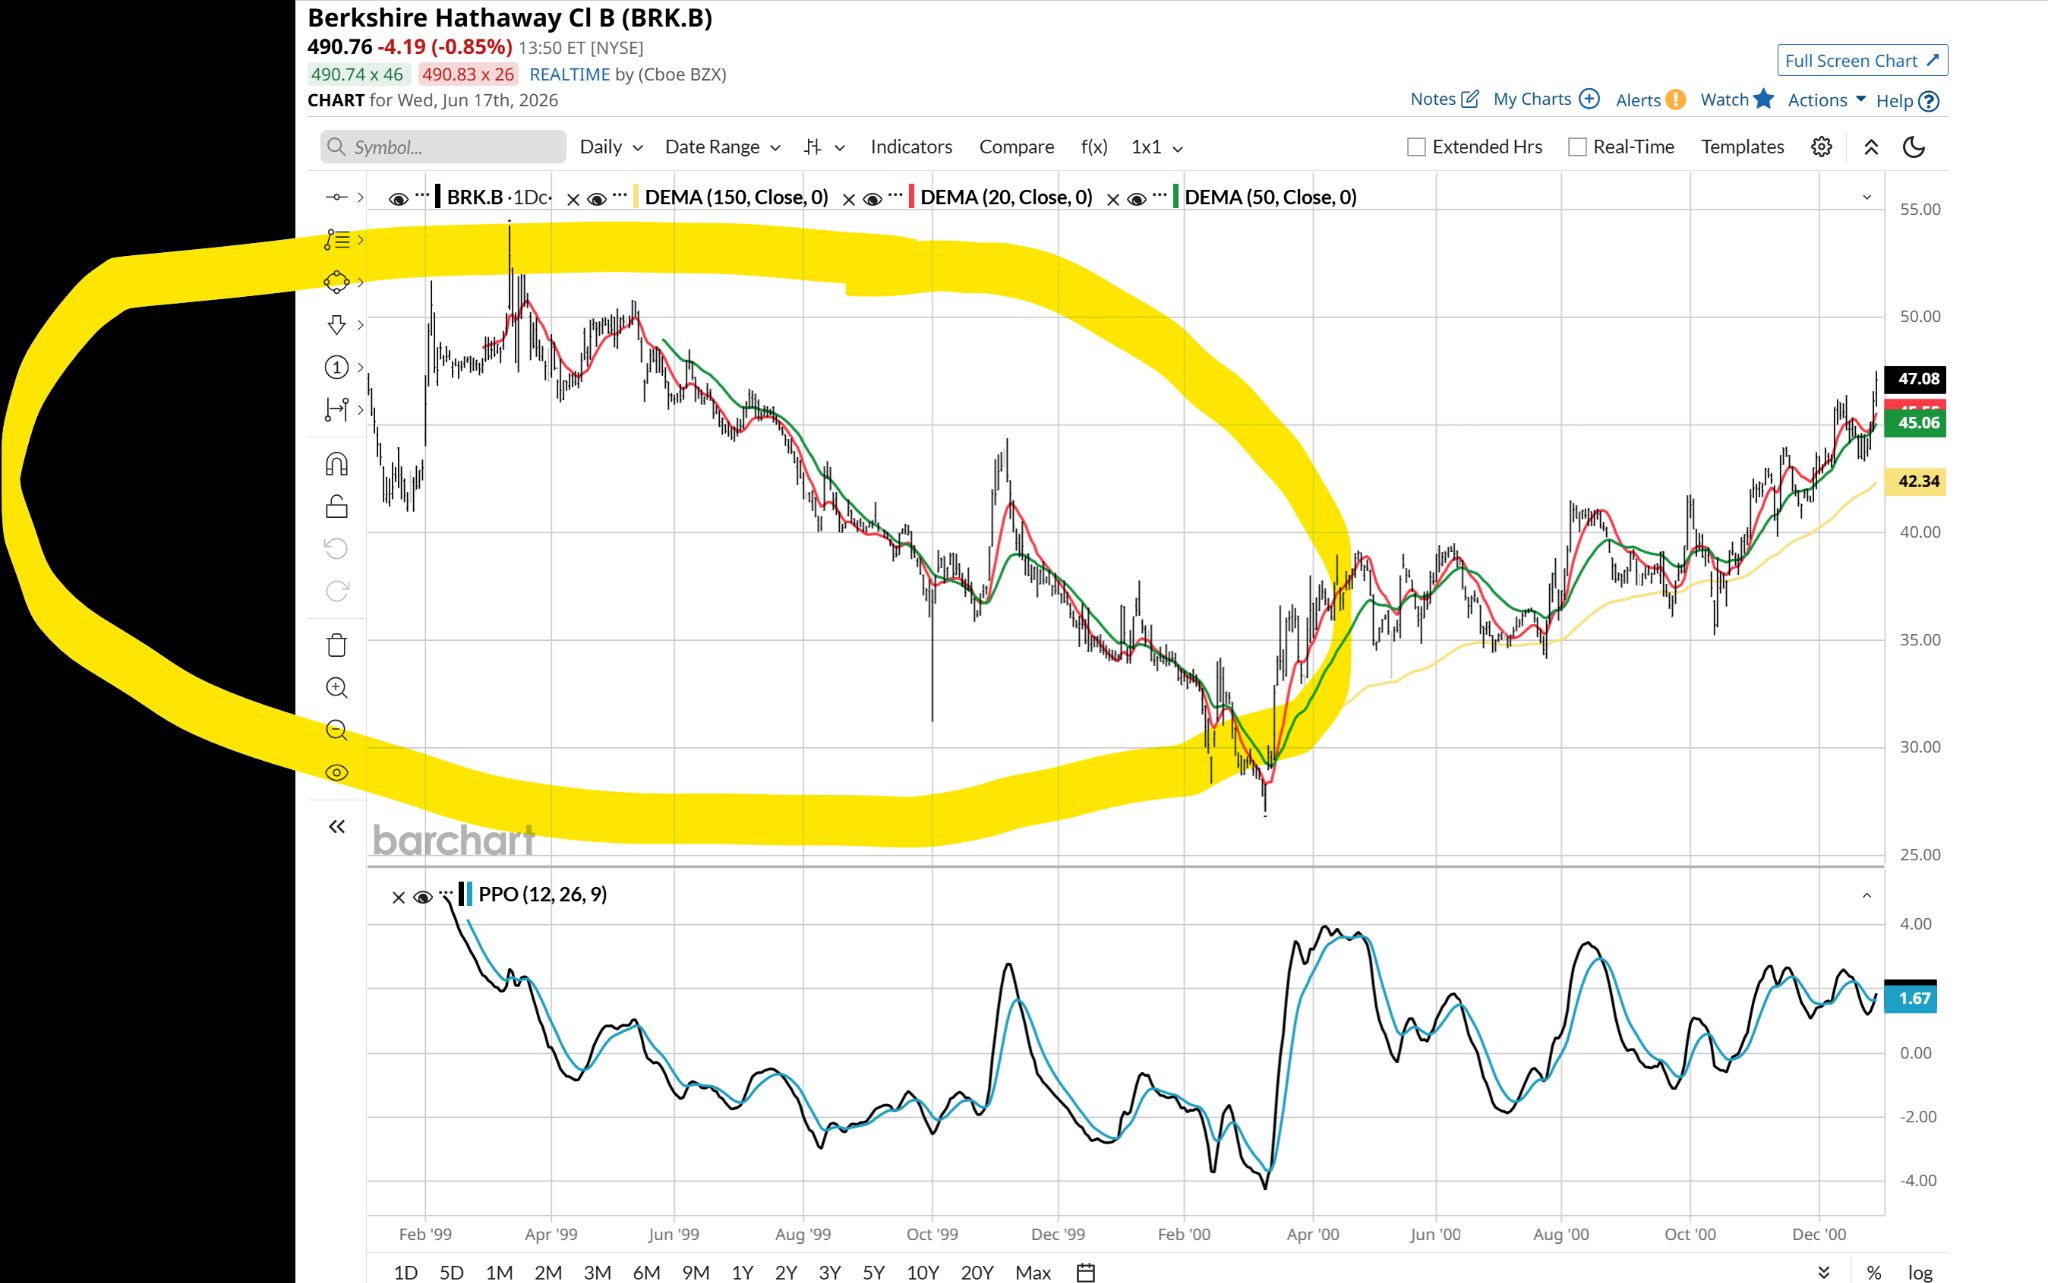
 My natural curiosity led me back to how this same stock did leading up to the bursting of the dot-com bubble in 2000. Thanks to Barchart’s ability to quickly call up past eras in chart form, I circled the period leading up to the March 2000 stock market top.
 www.barchart.com
 My point is not that they are identical, as they are not. But Berkshire’s lagging performance in the AI-driven frenzy today? That DOES mimic the past.
Berkshire also wasn’t a safe haven when the bubble burst 26 years ago. So too do I expect the next crash to be one characterized by a lack of a “counter punch” from non-tech.
That is, industrial, financial, utility, and consumer staple stocks will likely not rally to replace semiconductor and telecom flyers. The result will be a market that caves in from all sides. When? I have no idea. But investors essentially pushing BRK.B out of the mainstream market chatter, along with most non-AI stocks, is very reminiscent of that turn-of-the-century period.
Why that’s just the tip of the iceberg
When hunting for the definitive warning sign of a major market peak, the financial press routinely focuses on the wrong indicators. Analysts pore over speculative momentum charts, margin debt levels, and the over-extended multiples of the current technology darlings. But history shows that the clearest warning signal of a looming distribution phase isn’t found by looking at what people are frantically buying. It is found by looking at what they are actively ignoring.
Specifically, it is found by tracking the relative performance pattern of BRK.B.
Buffett’s conglomerate has spent decades functioning as the ultimate real-economy litmus test. Because Berkshire completely avoids overvalued tech hype and focuses strictly on cash-generative insurance, infrastructure, and industrial utility, the stock behaves like a mirror image of the consensus crowd’s speculative fever.
Twice in modern history — first in the late 1990s and again right now — Berkshire’s performance pattern has flashed the exact same warning sign about a top-heavy market structure.
To understand the signal, we have to look back at the climax of the dot-com bubble. Throughout 1998 and 1999, the capital markets were completely intoxicated by internet and technology listings. Money indiscriminately flooded into market-cap-weighted indexes and high-beta growth funds, dragging the headline averages to record heights week after week.
Because the crowd was completely consumed by tech momentum, traditional value assets were aggressively liquidated to fund the chase. Berkshire Hathaway became the ultimate funding source. As technology stocks put on vertical, parabolic runs, Berkshire’s stock decoupled from the broad index and experienced a brutal, standalone drawdown, dropping roughly 50% from its 1998 peak to its early 2000 low.
The media openly mocked Buffett, declaring that the old value playbook was permanently broken and that the New Economy had rendered Berkshire obsolete. But that extreme underperformance was actually the final warning sign of the bubble.
The crowd had pushed the point spread of the broad index so thin that it possessed zero margin for error. The moment the Federal Reserve tightened credit conditions in early 2000, the unprofitable tech sector experienced a devastating structural unwind.
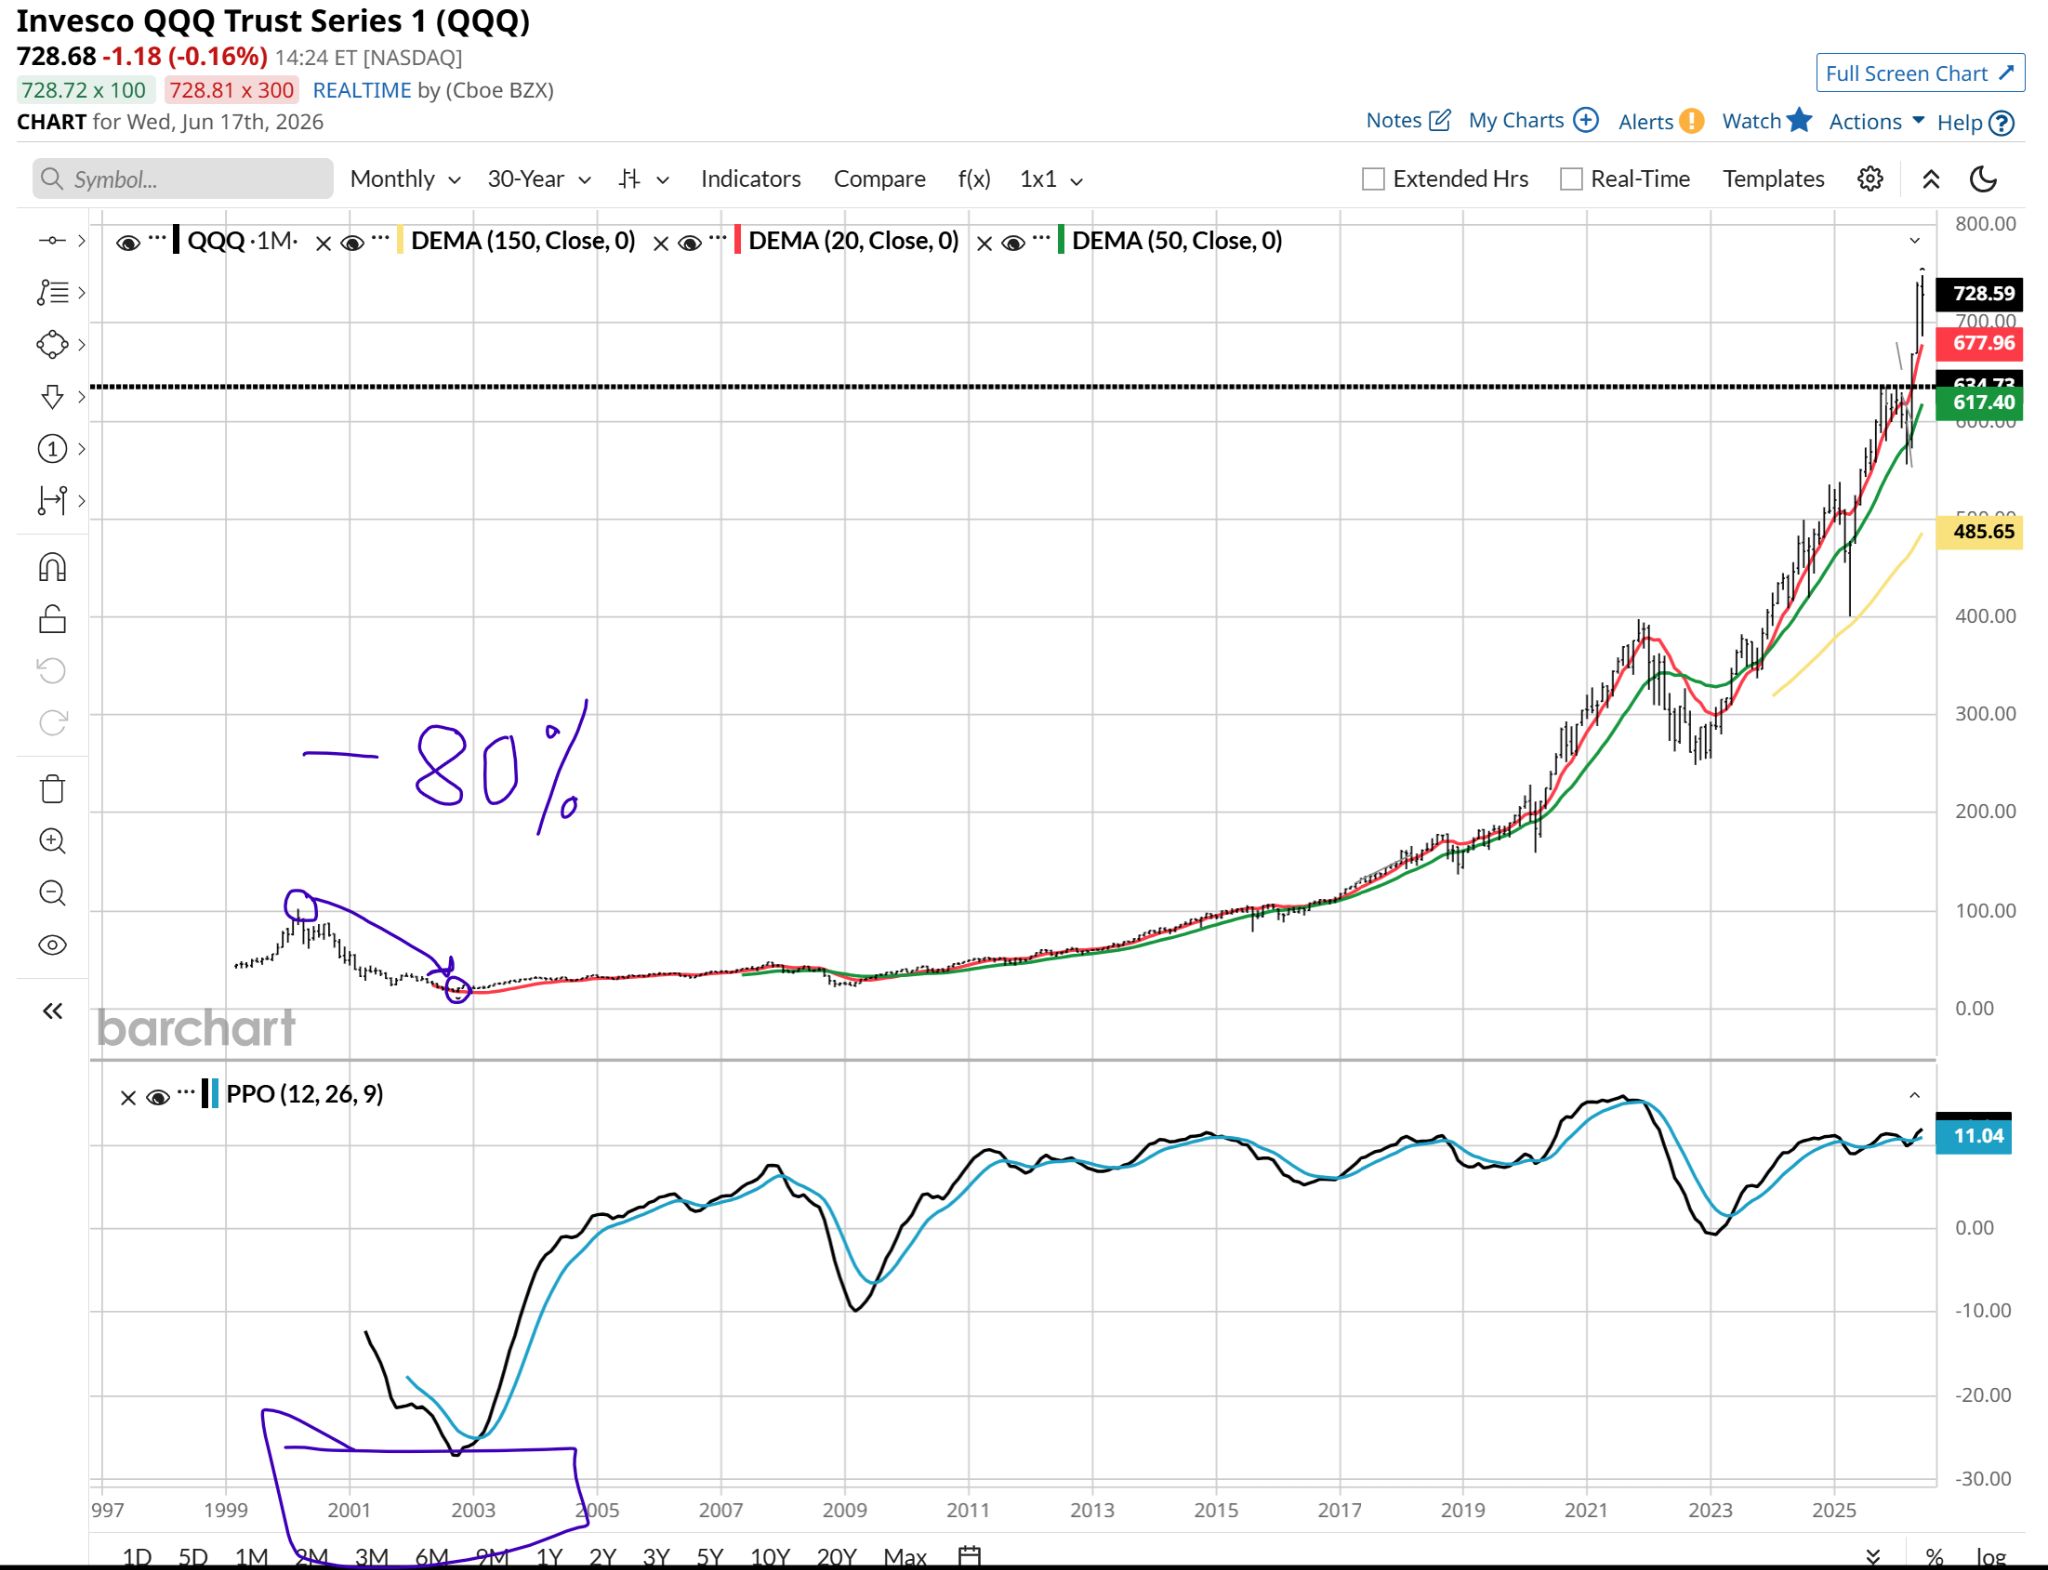
In 2000, the Invesco QQQ Trust (QQQ) ultimately collapsed by nearly 80% over the ensuing two years, Berkshire Hathaway surged back to new all-time highs, outperforming the wreckage. But let’s not get ahead of ourselves. The main point here is that BRK.B’s stock price trend is important to follow from here on out.
By the way, this is a picture of what happened when the last tech stock crash happened more than 20 years ago. I’ve highlighted that QQQ declined from around $100 a share to around $20 a share. It is now a blip on the chart. But it's time to remind ourselves what markets are capable of.
 www.barchart.com
 Fast forward to the current market landscape, and the identical behavioral loop is playing out right before our eyes. The headline S&P 500 is completely dominated by an exceptionally tight group of artificial intelligence and semiconductor heavyweights, pushing cap-weighted index concentration to terminal levels.
Just like in 1999, the broad index returns are an optical illusion masking a quiet, localized bear market under the hood. As capital aggressively concentrates into a handful of mega-caps, the “market of stocks” has languished, with nearly half of the largest U.S. companies failing to outperform a basic, risk-free 1-3 Month T-Bill ETF over the last four years.
Do not misinterpret the market’s current tech momentum as a sign of health. When index concentration reaches this extreme phase, it ceases to be a diversified safety net and transforms into a momentum fund that will drag the rest of the market down with it when the wind shifts.
Rob Isbitts created the ROAR Score, based on his 40+ years of technical analysis experience. ROAR helps DIY investors manage risk and create their own portfolios. For Rob’s written research, check out ETFYourself.com.
On the date of publication, Rob Isbitts did not have (either directly or indirectly) positions in any of the securities mentioned in this article. All information and data in this article is solely for informational purposes. For more information please view the Barchart Disclosure Policy here.
More news from Barchart
Why This Mega-Cap Stock Might Be the Best Crash Warning We Have Stocks Rally Before the Open on U.S.-Iran Peace Deal ‘At Some Point, People Stop Trusting’: Billionaire Mark Cuban Says OpenAI CEO Sam Altman Is ‘All Over The Map’ And Warns ‘That Will Backfire on Him’ What Will the Fed Do With Rates Wednesday?