

NVDA
#1
NVIDIA Corporation - Common Stock
227.0 6 USD
-0.01%
Market Price
Sector: Tecnología
Básica: USD
Divisa de beneficio: USD
Rango diario
Rango anual
Cambio diario
-0.97%
Variación mensual
+7.57%
Variación en los últimos 6 meses
+22.06%
Cambio anual
+20.80%
Cierres anteriores
229.2 8
Open
228.7 3
Mínimo
226.9 2
Máximo
228.8 6
Financials
2017
Annual report, FY2017
NVIDIA CORP annual report, FY2017
10-K
Current report, Q1 FY2017
NVIDIA CORP current report, Q1 FY2017
8-K
Current report, Q1 FY2017
NVIDIA CORP current report, Q1 FY2017
8-K
2016
Current report, Q4 FY2016
NVIDIA CORP current report, Q4 FY2016
8-K
Current report, Q4 FY2016
NVIDIA CORP current report, Q4 FY2016
8-K
Current report, Q4 FY2016
NVIDIA CORP current report, Q4 FY2016
8-K
Quarterly report, Q3 FY2017
NVIDIA CORP quarterly report, Q3 FY2017
10-Q
Current report, Q4 FY2016
NVIDIA CORP current report, Q4 FY2016
8-K
Current report, Q3 FY2016
NVIDIA CORP current report, Q3 FY2016
8-K
Current report, Q3 FY2016
NVIDIA CORP current report, Q3 FY2016
8-K
Noticias
Nvidia y Cisco anuncian nuevo módulo óptico para centros de datos de IA
Allianz Technology Trust informa sobre su cartera de inversiones
NVIDIA presiona soporte clave en $226,77: niveles en vivo
¿Puede el crecimiento de beneficios sostener el alza en acciones?
La emisión de deuda de IA por parte de tecnológicas cae en septiembre
Nvidia negocia adquirir Reflection AI o ampliar su inversión
Nuvacore, respaldada por Sequoia, busca valoración de 2.500 millones de dólares
5 grandes movimientos de analistas en IA: Google reafirmado como favorito tras el lanzamiento del agente Gemini
UBS mantiene el precio objetivo de Nvidia en 300 dólares gracias a datos de Taiwán
Los futuros del TSX suben levemente ante datos de empleo y caída del petróleo
COMUNICADO: Expertos reunidos por Legálitas: datos y experiencia marcarán la diferencia en la era de la IA
Gráficos e ideas
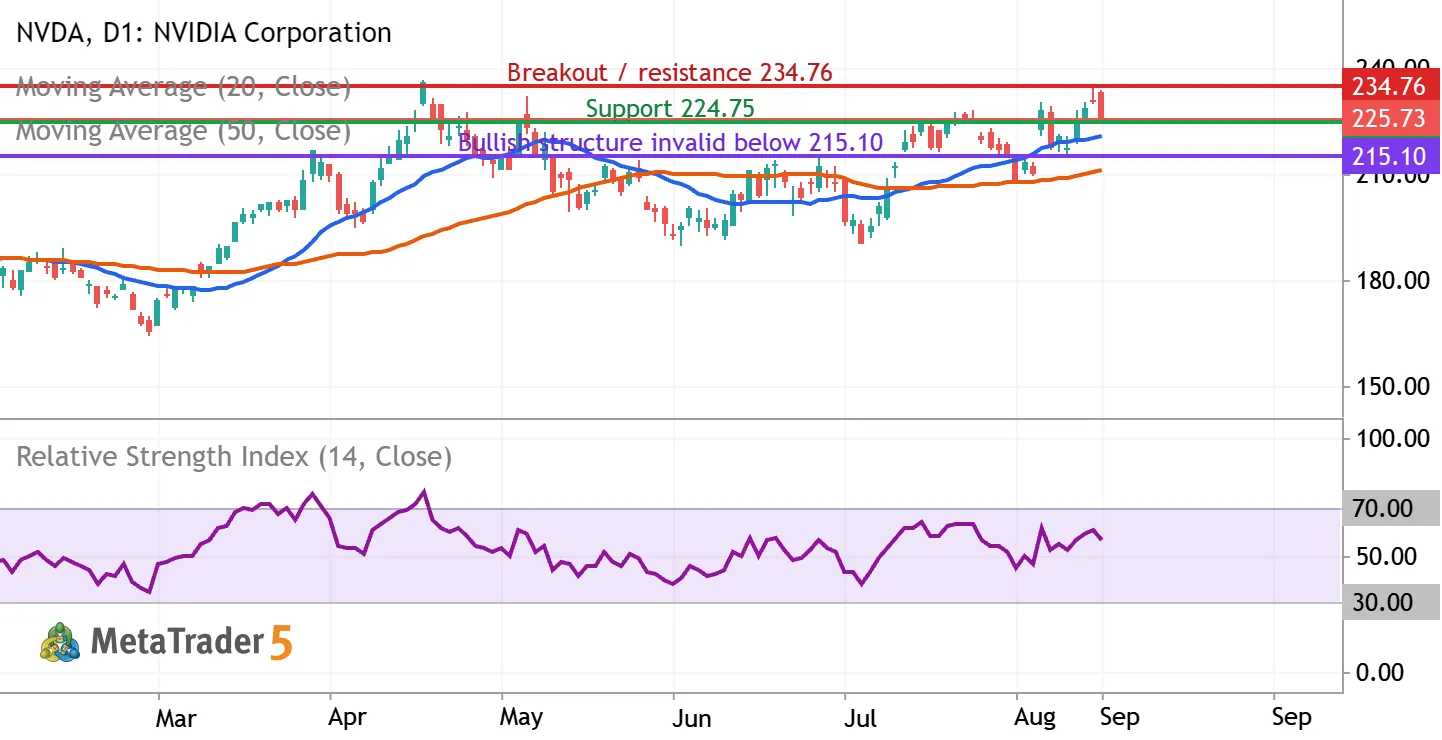
NVDA: testing $225 support as the uptrend meets $234.76 resistance
NVIDIA (NASDAQ: NVDA) | Daily chart | September 9, 2026 Bias: conditionally bullish over the next 2–6 weeks. Entry confirmation is still required. The latest completed regular session, September 8, closed at $225.73, down 2.01%, after reaching $233.71 intraday. The close near the session low signals selling pressure despite the broader recovery. What the indicators show The chart includes a blue 20-day simple moving average, an orange 50-day simple moving average, and purple RSI(14), all calculated from closing prices. At the latest completed candle, MetaTrader showed the averages near $220.48 and $211.22, with RSI near 56.19. Price remains above both rising averages, and the 20-day average is above the 50-day average. RSI above 50 supports positive momentum, but its reading below 70 is


The NVDA doesn’t have other trading ideas at this time
Browse ready-made trading ideas or select a symbol and create your own
Go to Charts and Trading Ideas