Gráficos e ideas

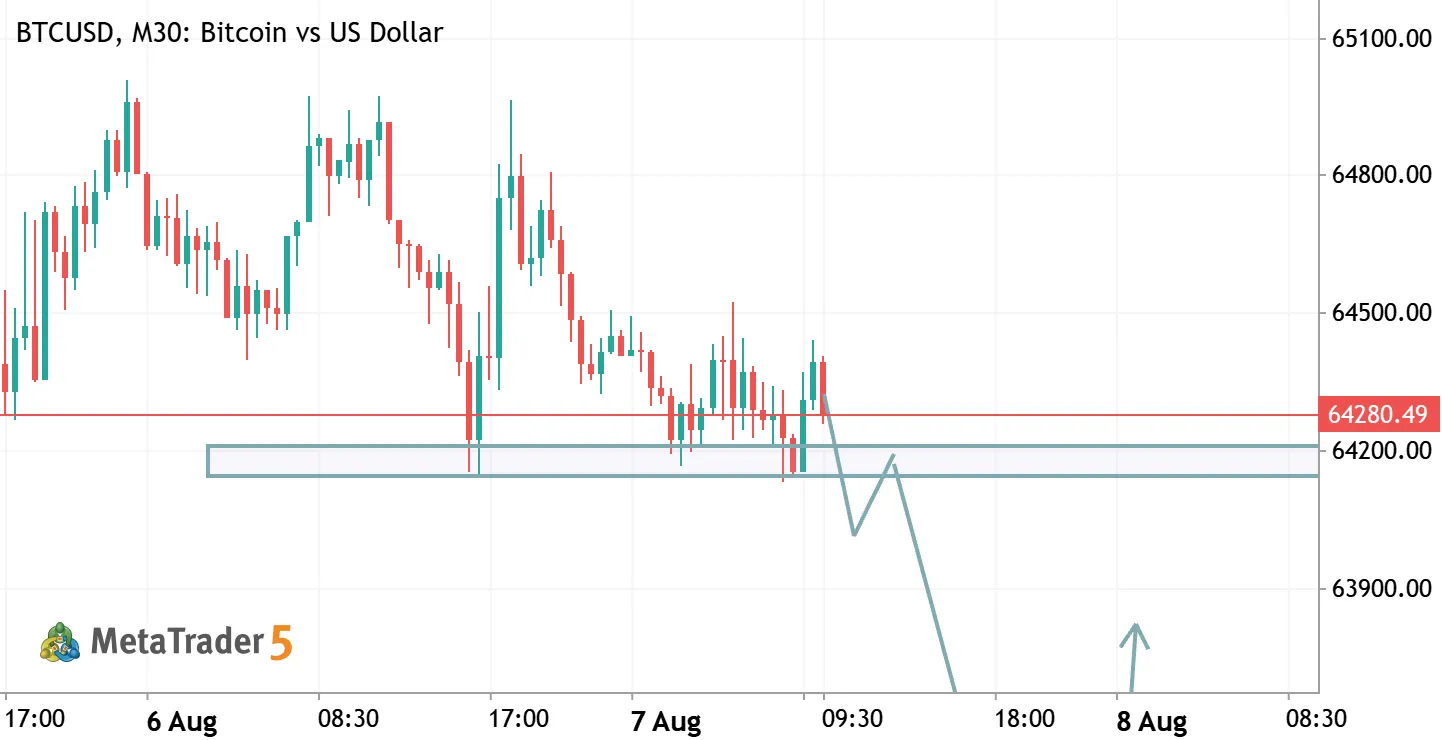
BITCOIN (BTC/USD) BREAKDOWN & DEMAND RE-ENTRY SETUP BTCUSD Bitcoin vs US Dollar

BITCOIN (BTC/USD) BREAKDOWN & DEMAND RE-ENTRY SETUP

Executive Summary & Technical Overview On the 30-minute timeframe (M30) for BTC/USD (Bitcoin vs US Dollar) , price action exhibits a distinct multi-phase technical structure. Bitcoin has been consolidating near immediate support at the $64,200 level. The primary trade hypothesis maps out a short-term breakdown below this structural support, followed by a bearish retest to capture downside momentum toward a key lower Demand Zone between $62,400 – $62,600 . Once price reaches this major higher-timeframe interest area, a strong bullish reaction is anticipated to initiate a trend reversal back toward higher price levels. Detailed Technical Analysis & Trade Rationale Support Breakdown & Retest Phase (Short / Bearish Leg): Structural Failure: Repeated tests of the horizontal support
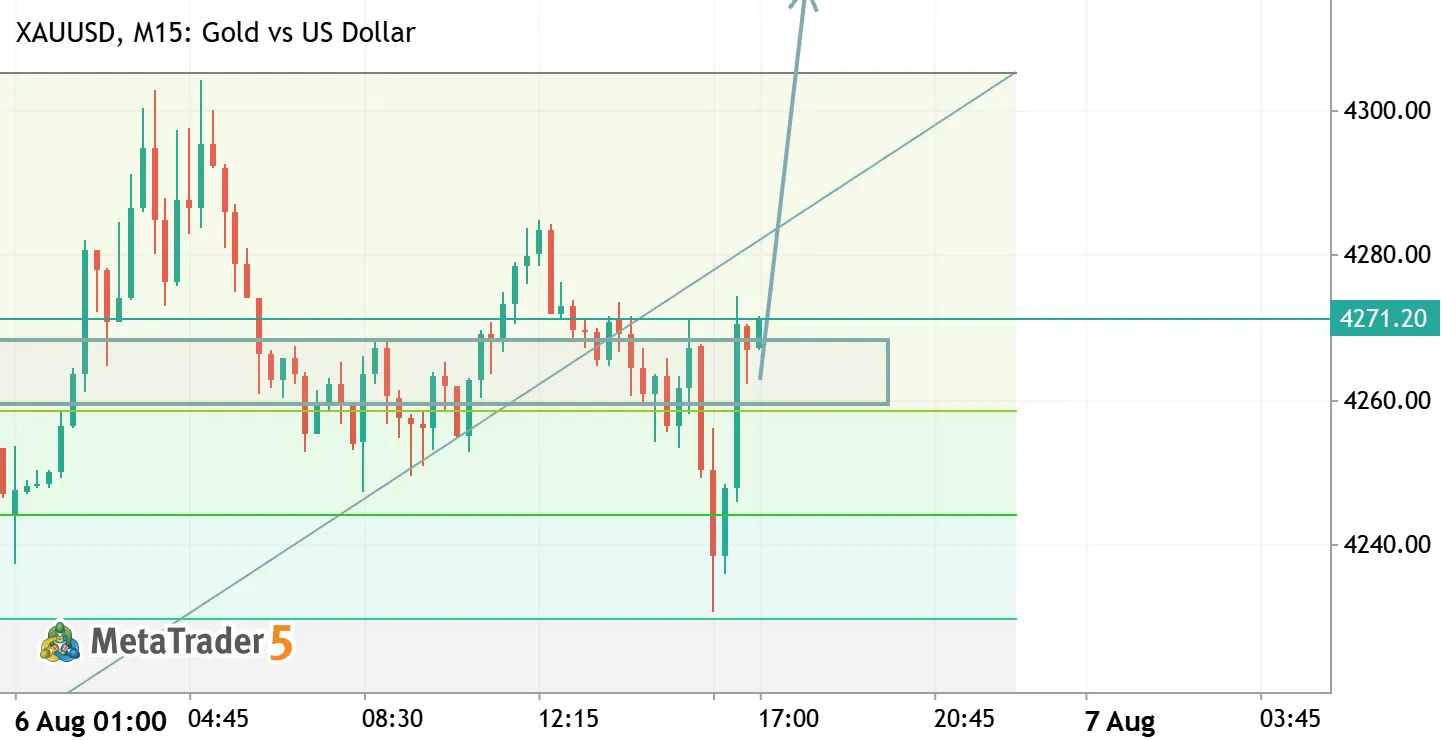
GOLD (XAU/USD) BULLISH BREAKOUT & RETEST SETUP XAUUSD Long Gold vs US Dollar

GOLD (XAU/USD) BULLISH BREAKOUT & RETEST SETUP

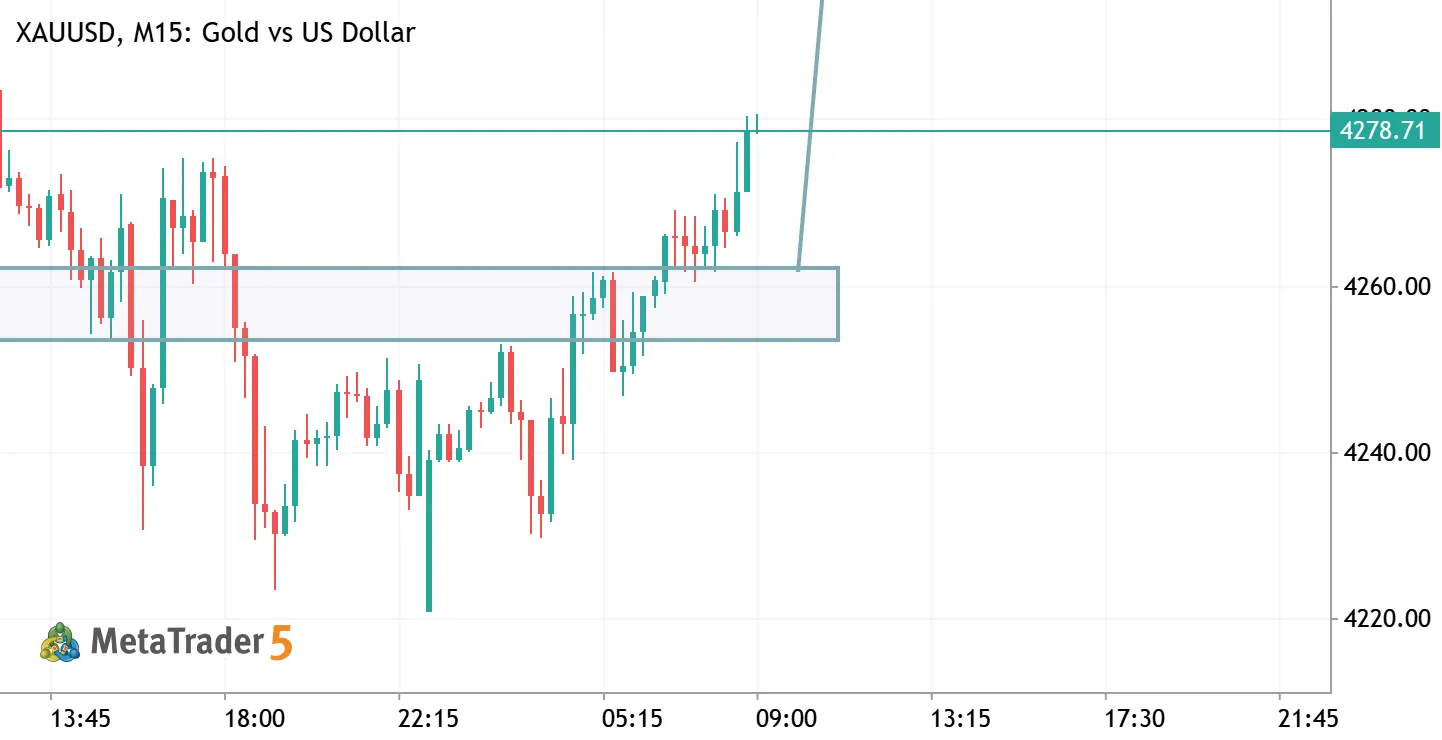
xecutive Summary & Technical Overview The 15-minute timeframe (M15) for XAU/USD (Gold vs US Dollar) demonstrates a classic structural shift favoring buyers. Following a period of consolidation within the $4,230.00 – $4,260.00 range, price action successfully surged past the significant resistance barrier located at $4,260.00. This horizontal zone—which previously acted as a ceiling capping upside momentum—has now flip-flopped into a robust Demand & Support Zone . The current price action indicates a healthy retest of this newly established support level around $4,260.00 , confirming buyer presence and validating the upward continuum toward higher targets. Key Technical Factors Resistance-to-Support Flip (Role Reversal): The $4,260.00 price handle previously saw multiple rejections
XAUUSD (GOLD) BUY SIGNAL & TECHNICAL ANALYSIS XAUUSD Long Gold vs US Dollar

XAUUSD (GOLD) BUY SIGNAL & TECHNICAL ANALYSIS

🚨 DISCLAIMER Not Financial Advice: This signal and trade setup are strictly for educational and informational purposes only. Trading gold, forex, and commodities involves substantial financial risk. Always do your own research and practice proper risk management before entering any market positions. 🟢 BUY SIGNAL / LONG TRADE SETUP Instrument: XAUUSD (Gold) Timeframe: M15 (Intraday) Market Bias: Bullish Reversal / Continuation 🎯 Execution Parameters Entry Zone: 4260.00 – 4267.00 (Current market price / Support confluence zone) Stop Loss (SL): 4224.00 (Placed safely below the 0.618 Golden Ratio and recent spike low at 4229.74) Take Profit 1 (TP1): 4290.00 (Recent local swing high) Take Profit 2 (TP2): 4305.00 (0.000 Fibonacci Extension / Major Resistance Level) Take Profit 3 (TP3)
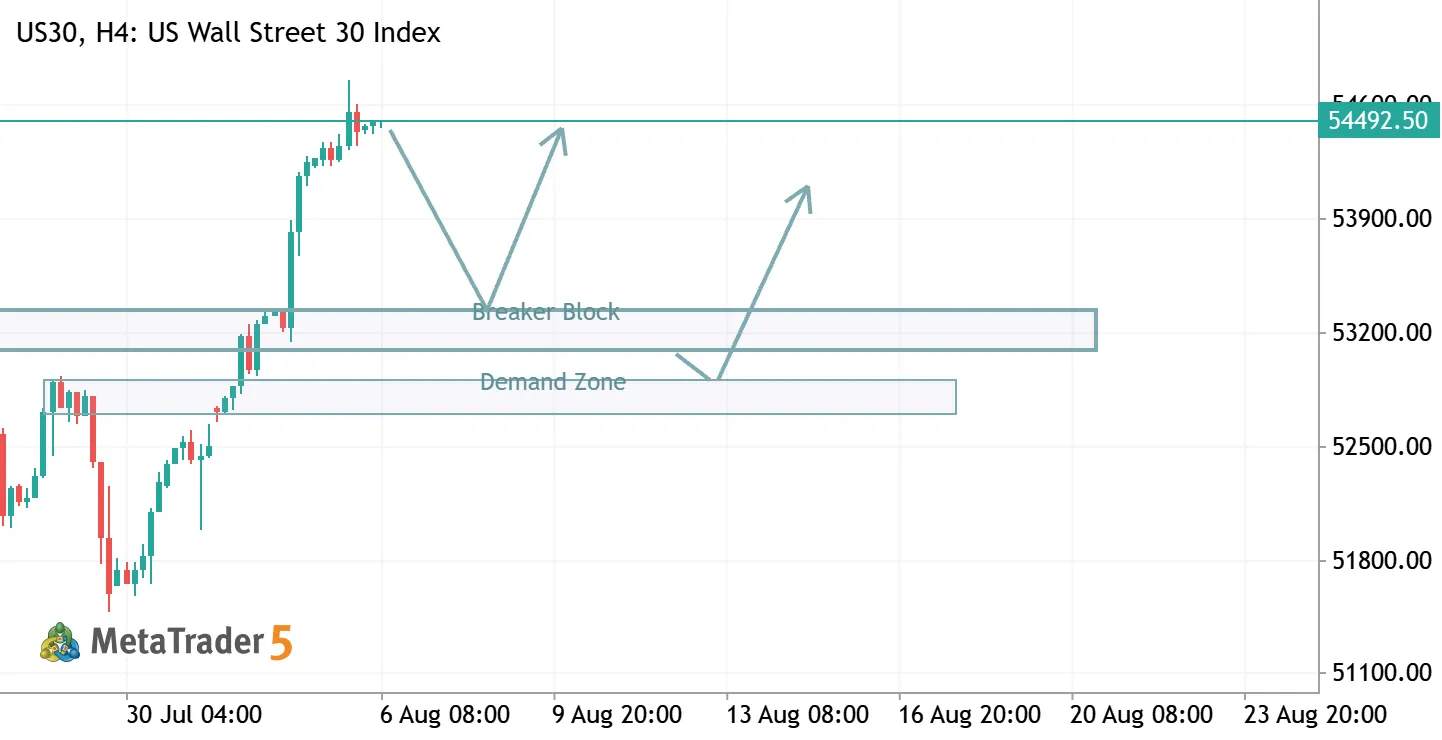
US30 Technical Analysis & Strategy Guide 30 US30 Long US Wall Street 30 Index

US30 Technical Analysis & Strategy Guide

🚨 DISCLAIMER Not Financial Advice: This analysis is strictly for educational and informational purposes only. Forex, indices, and financial market trading carry a high level of risk. Always conduct your own research and apply strict risk management before opening any positions. 📊 Market Structure & Context Trading Pair / Instrument: US30 / Dow Jones Industrial Average (Wall Street 30 Index) Timeframe: H4 (4-Hour) Dominant Trend: Strong Bullish Expansion / Upward Momentum Current Key Resistance Level: ~54,493.00 The US30 chart demonstrates an aggressive, vertical bullish expansion. However, entering long positions at the absolute top (54,493) presents an unfavorable Risk-to-Reward ratio. Smart Money Concepts (SMC) favor waiting for liquidity retracements back into institutional
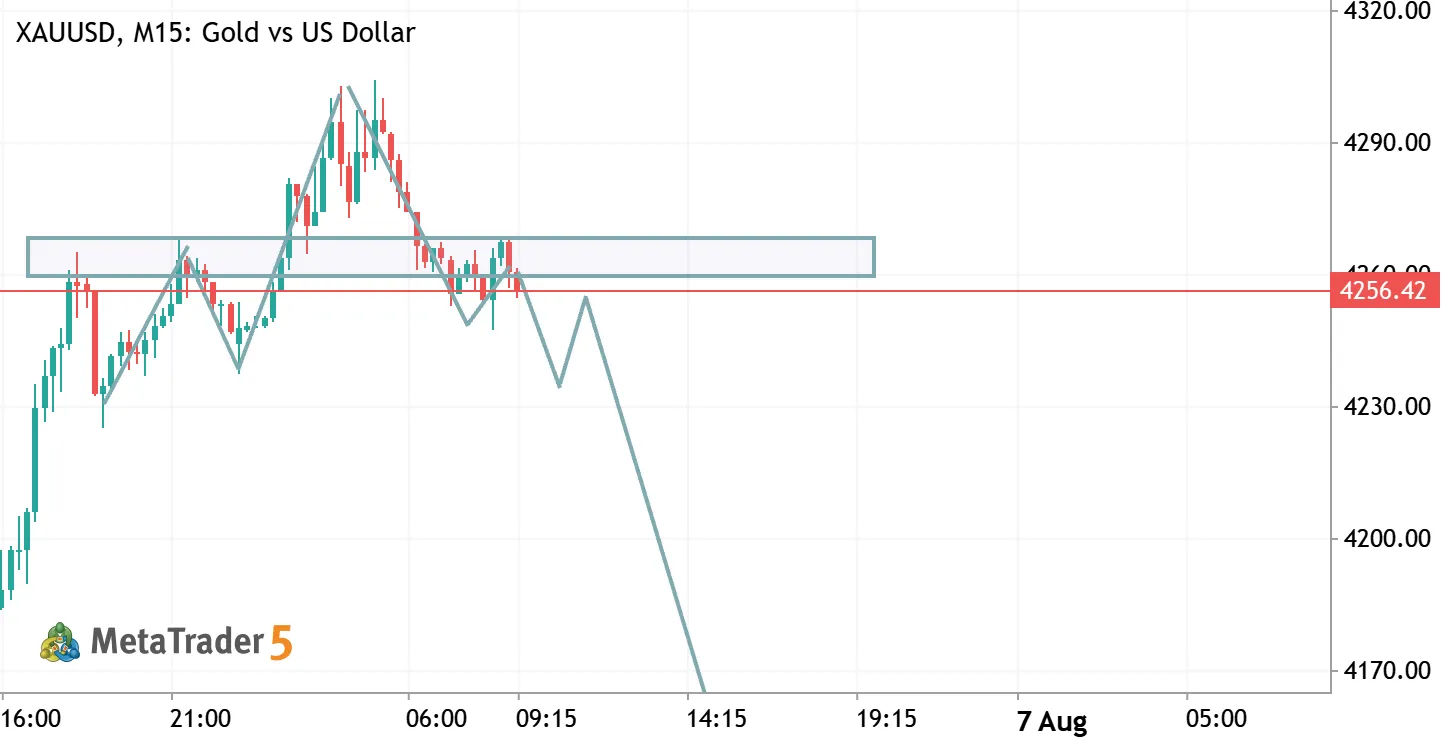
GOLD BREAKOUT: Massive Head & Shoulders Drop Incoming! XAUUSD Short Gold vs US Dollar

GOLD BREAKOUT: Massive Head & Shoulders Drop Incoming!

📉 SELL SIGNAL / SHORT TRADE SETUP 📉 Instrument: XAUUSD (Gold) Timeframe: M15 (Intraday) Pattern: Head & Shoulders (Bearish Reversal) 🎯 Trade Execution Parameters Entry Zone: 4250.00 – 4258.00 (Entry on Retest / Neckline Breakout) Stop Loss (SL): 4272.00 (Positioned above the Right Shoulder for protection) Take Profit 1 (TP1): 4200.00 (Intermediate psychological & liquidity level) Take Profit 2 (TP2): 4160.00 (Major Support Zone marked on chart) Risk/Reward Ratio (RRR): ~1:4.5 (High R/R Setup) 🔍 Technical Reasons & Setup Analysis Head & Shoulders Structural Formation: Left Shoulder: Rejection near the 4258.00 zone. Head: Peak push up to the 4295.00 level before sharp selling pressure. Right Shoulder: Lower high printed around 4258.00, confirming buyers are losing
BTC BULLISH BREAKOUT: Market Structure Shift + Bull Flag In Play! BTCUSD Long Bitcoin vs US Dollar

BTC BULLISH BREAKOUT: Market Structure Shift + Bull Flag In Play!

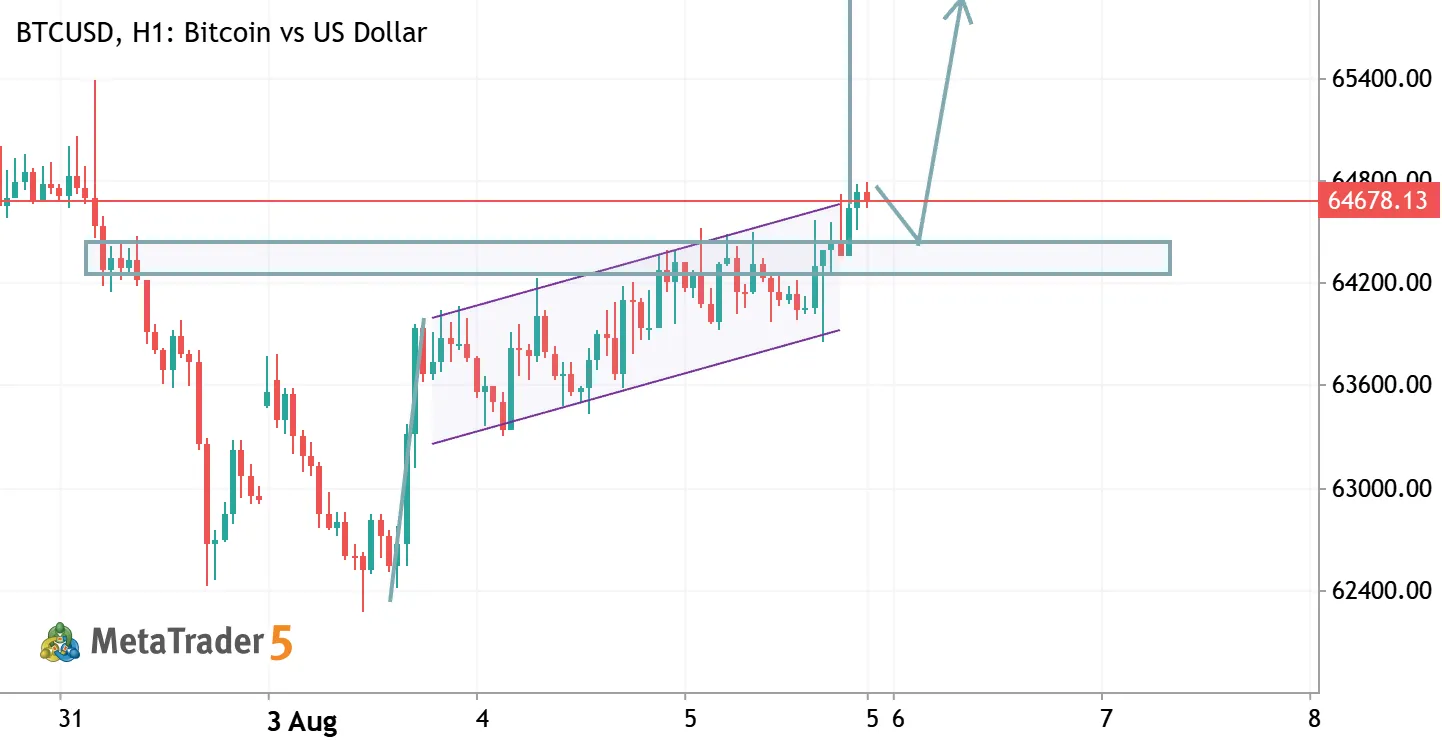
📊 Trade Setup: BTC/USD (H1 Timeframe) Entry Zone (Buy Limit / Retest): $64,300 – $64,500 (Waiting for a retest of the broken flag boundary / horizontal support zone) Stop Loss (SL): $63,800 (Placed safely below the ascending flag structure and local order block) Take Profit (TP): $66,000 – $66,200 ( targeting the major overhead liquidity pool and previous high supply zone) Risk/Reward Ratio: ~2.5:1 🔑 Key Analysis & Confluence Factors Market Structure Shift (MSS): Price swept liquidity around $62,000 and violently shifted to the upside, creating higher highs and breaking minor resistance levels. Bull Flag Pattern Breakout: The consolidation pattern (ascending channel/flag) between $63,300 and $64,400 has broken out upward, signaling bullish continuation. Key Retest Strategy: The arrow
TRADING SIGNAL: GBPUSD (Pound Sterling vs US Dollar) GBPUSD Long Pound Sterling vs US Dollar

TRADING SIGNAL: GBPUSD (Pound Sterling vs US Dollar)

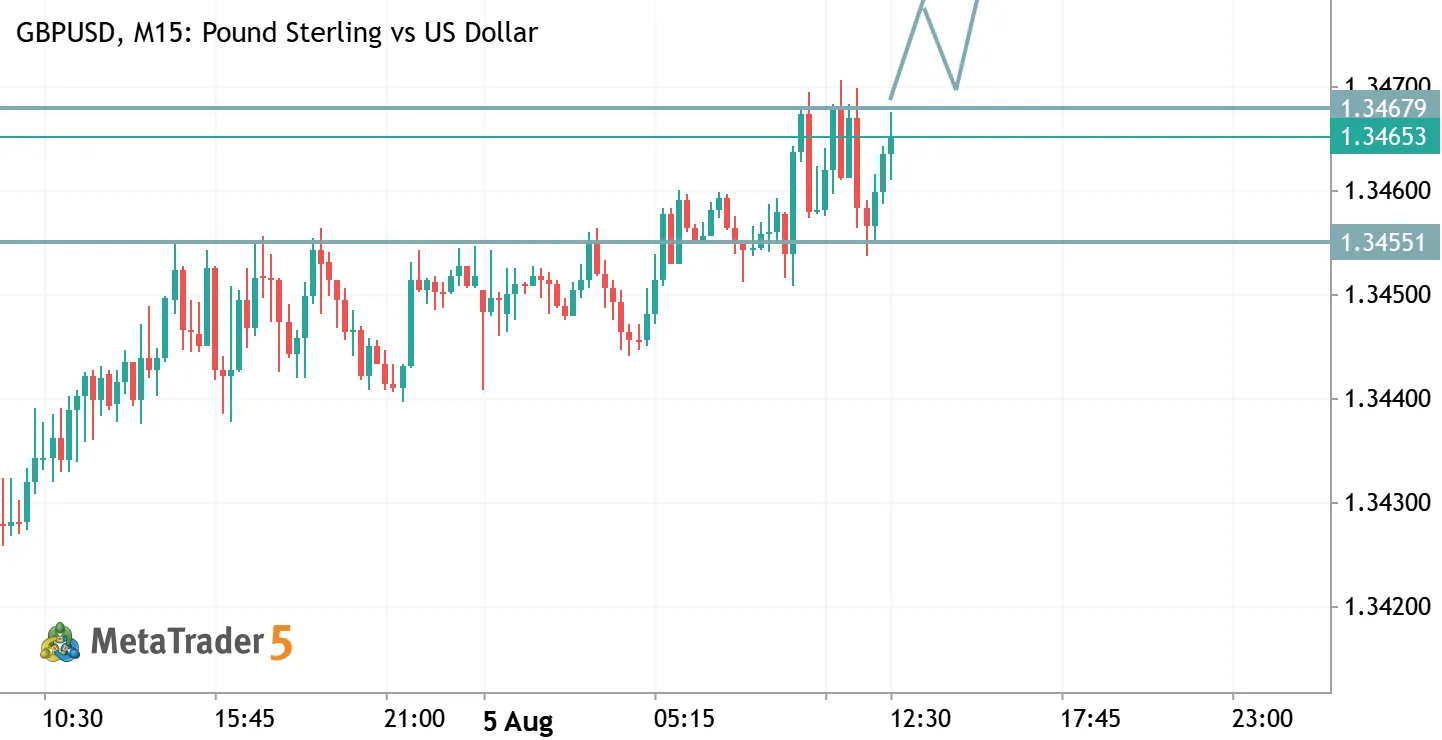
Direction: BUY / LONG (Pending Breakout & Retest) 📈 Trade Type: Breakout & Retest Confirmation Entry Zone: ~1.34684 (After clear bullish breakout & pullback) Take Profit 1 (TP1): 1.34800 Take Profit 2 (TP2): 1.35015 (Major Resistance Level) Rationale & Technical Analysis: Breakout Strategy: Price is currently consolidating near local resistance (~1.34684 - 1.34700). A clean breakout above this structure confirms bullish momentum continuation. Support/Demand Flip: Upon a successful breakout, the previous resistance level around 1.34684 flips into a strong demand zone, providing a high-probability retest entry. Market Structure: The chart reflects a bullish trend structure with higher lows forming leading into the current resistance test. Target Alignment: The primary
XAUUSD Short Setup: Liquidity Swept & Reversal In Play! XAUUSD Short Gold vs US Dollar

XAUUSD Short Setup: Liquidity Swept & Reversal In Play!

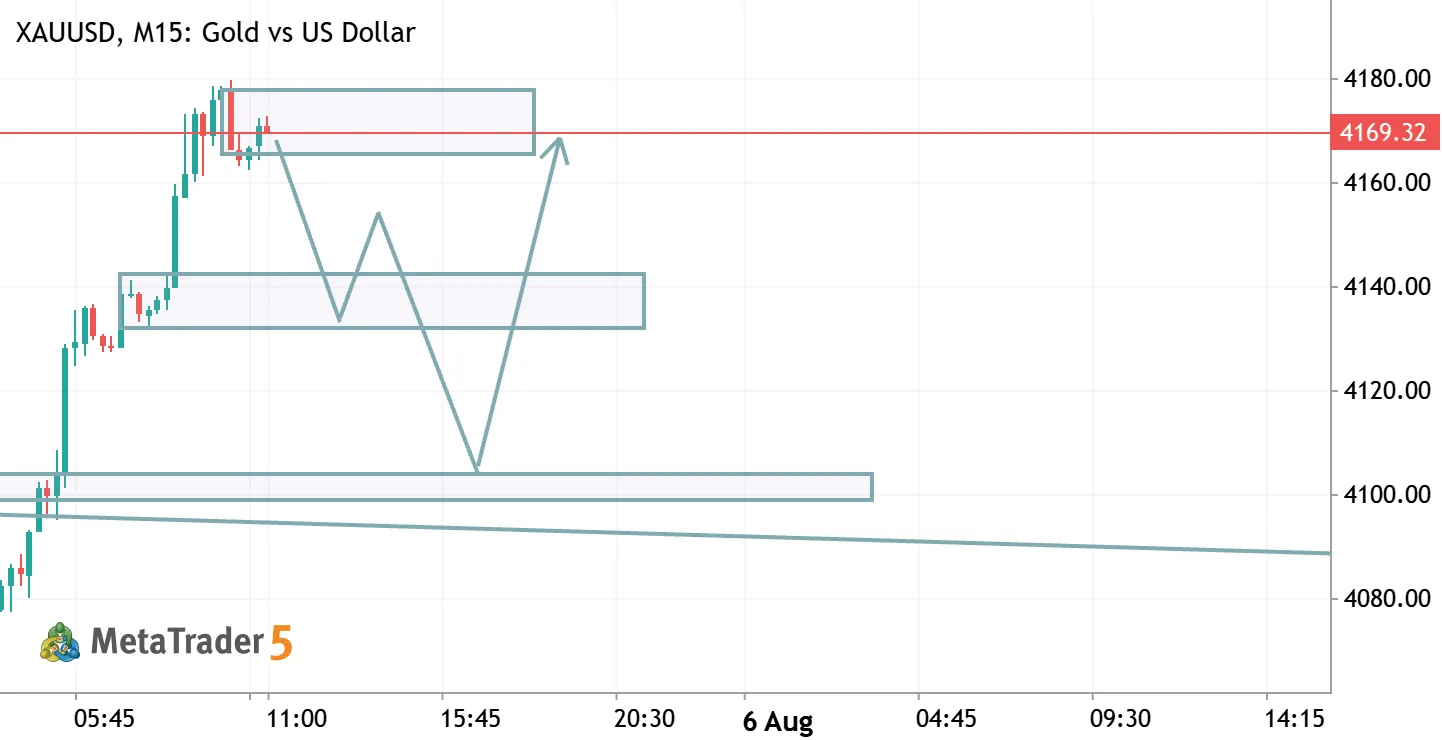
🚨 TRADING SIGNAL: XAUUSD (Gold) 🚨 Direction: SELL / SHORT 🔻 Current Price / Entry Zone: ~4170.00 (Current Level / Premium Zone) Take Profit 1 (TP1): 4140.00 Take Profit 2 (TP2): 4100.00 Rationale & Technical Analysis: Buy-Side Liquidity (BSL) Sweep: Price pushed higher to take out previous highs, sweeping resting buy stops above the range before rejecting sharply. Bearish Engulfing Pattern: A strong bearish engulfing candle formed at the highs, signaling an immediate shift in momentum from buyers to sellers. Key Target 1 (4140 Zone): This area represents the immediate support / demand zone formed prior to the last bullish impulse. Key Target 2 (4100 Zone): A major support zone and key psychological level where price broke out previously, acting as the secondary target. ⚠️
GOLD BULLISH CONTINUATION: Perfect Pullback into Demand Zone XAUUSD Long Gold vs US Dollar

GOLD BULLISH CONTINUATION: Perfect Pullback into Demand Zone

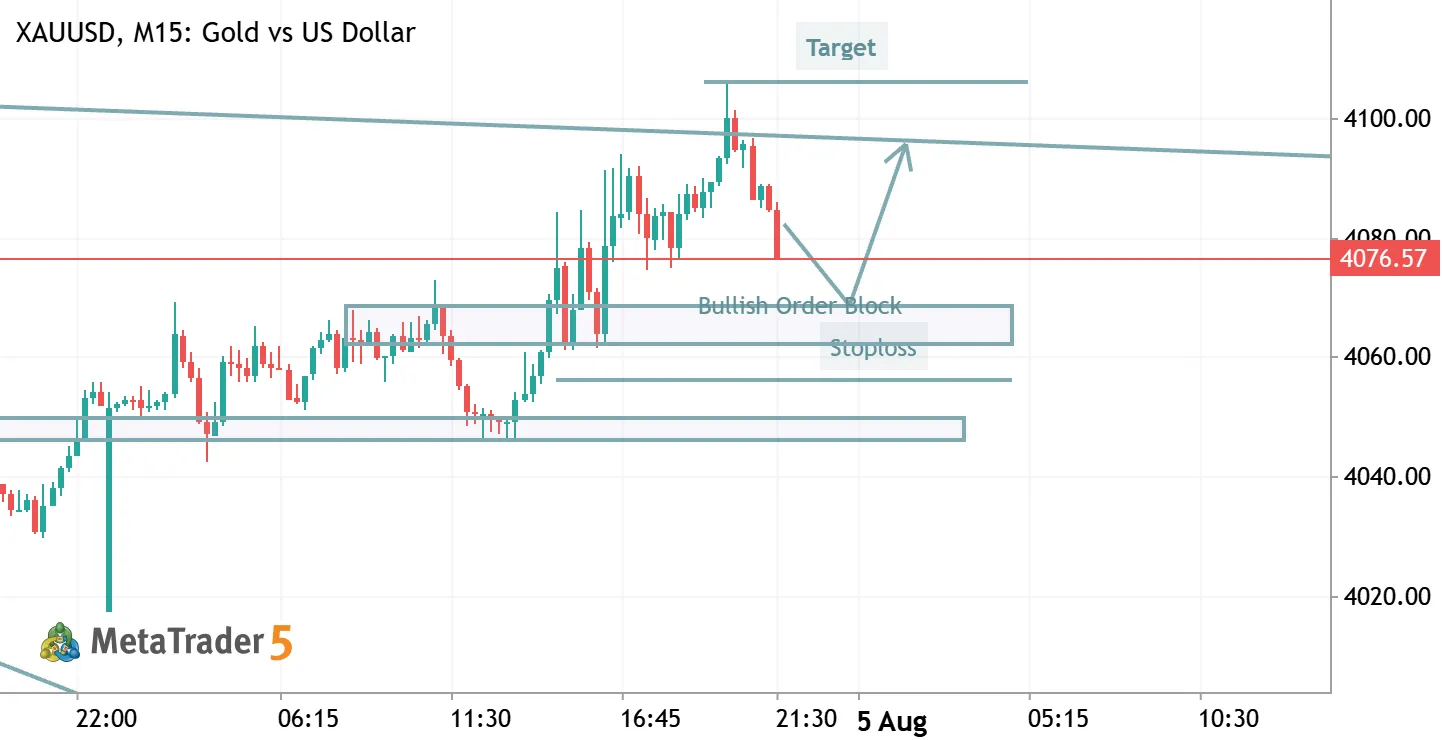
recent high & major trendline resistance) Trade Rationale & Confluences Market Structure Shift (MSS): Price recently printed a strong bullish impulse breaking higher highs, signaling a clear shift in short-term market structure to the upside. Bullish Order Block (OB): The pullback targets an unmitigated bullish order block ($4,063–$4,069), where institutional buyers initiated the aggressive expansion upward. Demand Zone Confluence: The order block directly aligns with a key demand zone, offering high-confluence support for a continuation move toward the upper targets. Risk Management Rules Risk Per Trade: Limit risk to maximum 1% - 2% of your total account balance. Risk-to-Reward Ratio (RRR): Approximately 1 : 3+ (Risking ~$6 to gain ~$33 to TP2). Trade Management: Move Stop Loss
GOLD (XAUUSD) BUY SETUP: Multi-Touch Support Holding Strong! XAUUSD Long Gold vs US Dollar

GOLD (XAUUSD) BUY SETUP: Multi-Touch Support Holding Strong!

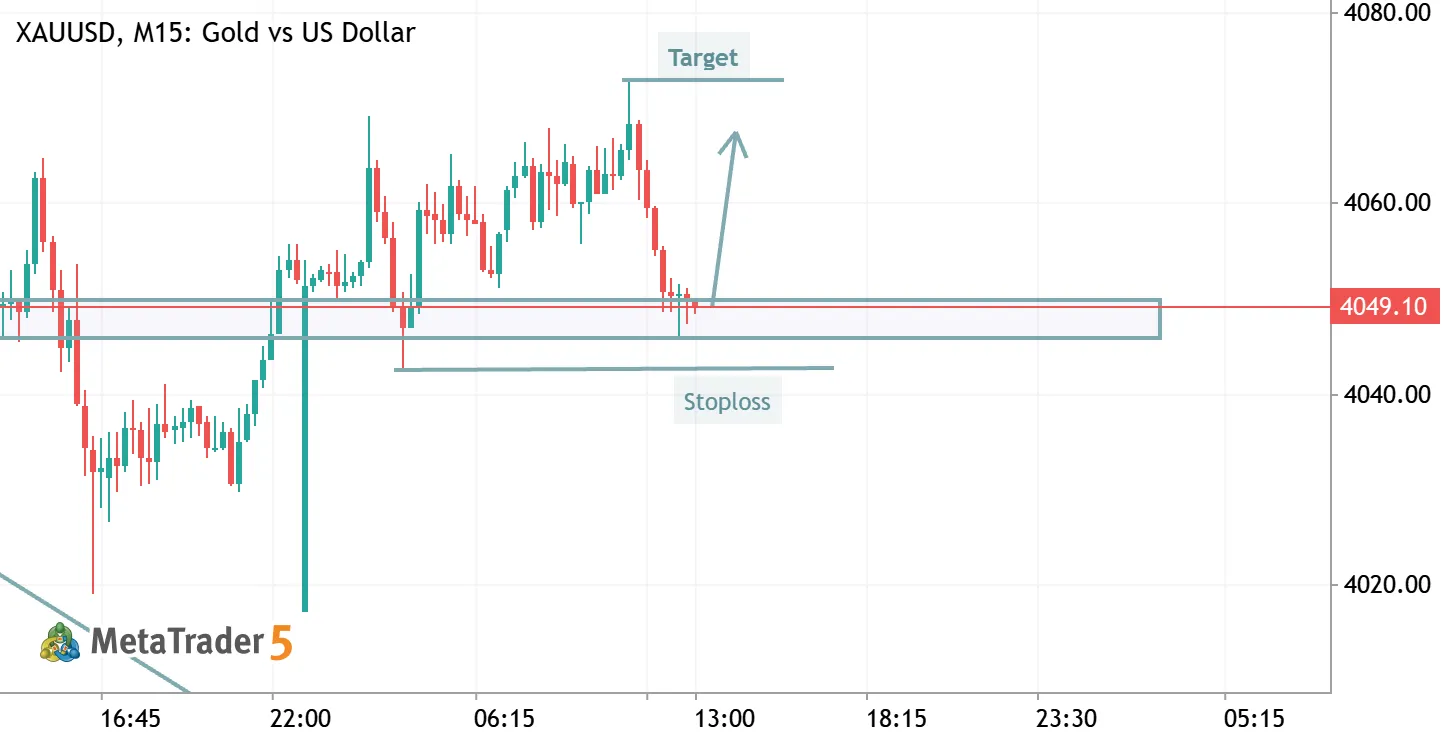
TRADING SIGNAL: XAUUSD (GOLD) 🚀📈 Direction: BUY / LONG Asset: XAUUSD (Gold) Timeframe Analysis: M15 / M5 Execution Levels Entry Range: $4,048.50 – $4,050.50 (Current zone near $4,049.13) Stop Loss (SL): $4,040.00 (Placed safely below the key liquidity sweep level and low of $4,041.00) Take Profit 1 (TP1): $4,068.00 (First major resistance structure) Take Profit 2 (TP2): $4,074.00 (Target zone shown on chart) Trade Rationale & Confluences Strong Support Zone: Price has revisited a well-established demand zone / support level around $4,048.00–$4,049.00 which has consistently held and shown multiple reactions. Liquidity Sweep / Fakeout Confirmation: A sharp liquidity grab occurred earlier (dipping below $4,020.00) followed by a aggressive recovery back into the original support
XAUUSD (Gold) Macro Breakdown Analysis: Potential Bearish Wave to 3650 Order Block XAUUSD Short Gold vs US Dollar

XAUUSD (Gold) Macro Breakdown Analysis: Potential Bearish Wave to 3650 Order Block

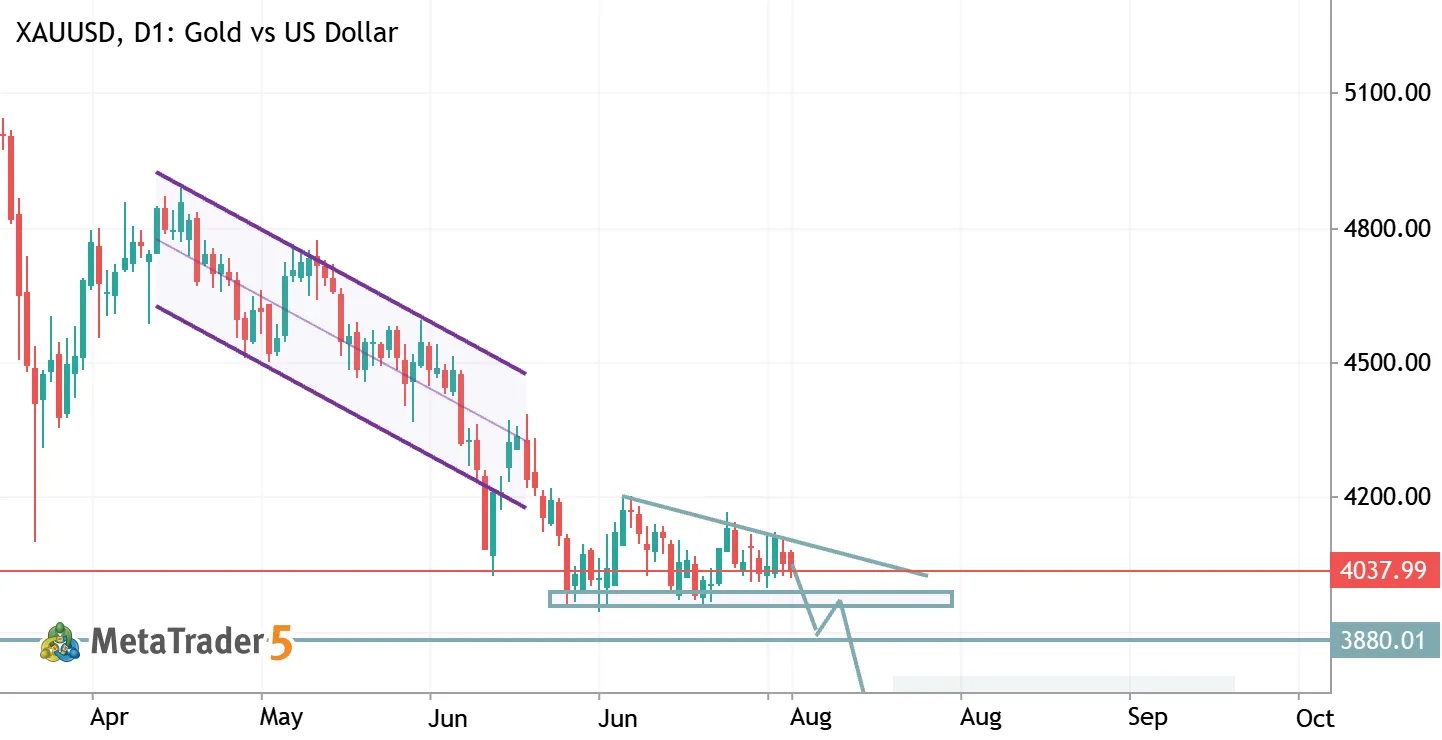
Trade Breakdown / Signal: SELL STOP (Breakout Play) Asset: XAUUSD (Gold - D1 Daily Chart) Trigger / Entry Zone: Breakdown below 3950.00 – 3965.00 Stop Loss (SL): 4050.00 (Above the recent daily lower-high resistance trendline) Take Profit 1 (TP1): 3883.00 (Minor daily support & sell-side liquidity pool) Take Profit 2 (TP2 / Main Target): 3650.00 (Major bullish order block / structural demand zone) Key Technical Reasons Crucial Daily Support Test: Price is pressing against a critical horizontal support zone near 3950–3965. A clean daily closure below this level confirms a macro structure continuation to the downside. TP1 Liquidity Sweep: The first target near 3883.00 sits right at a minor support level where rest stop losses and sell-side liquidity reside, making it a high-probability
XAGUSD (Silver) Bearish Rejection Setup: Trendline & Resistance Confluence XAGUSD Short Silver vs US Dollar

XAGUSD (Silver) Bearish Rejection Setup: Trendline & Resistance Confluence

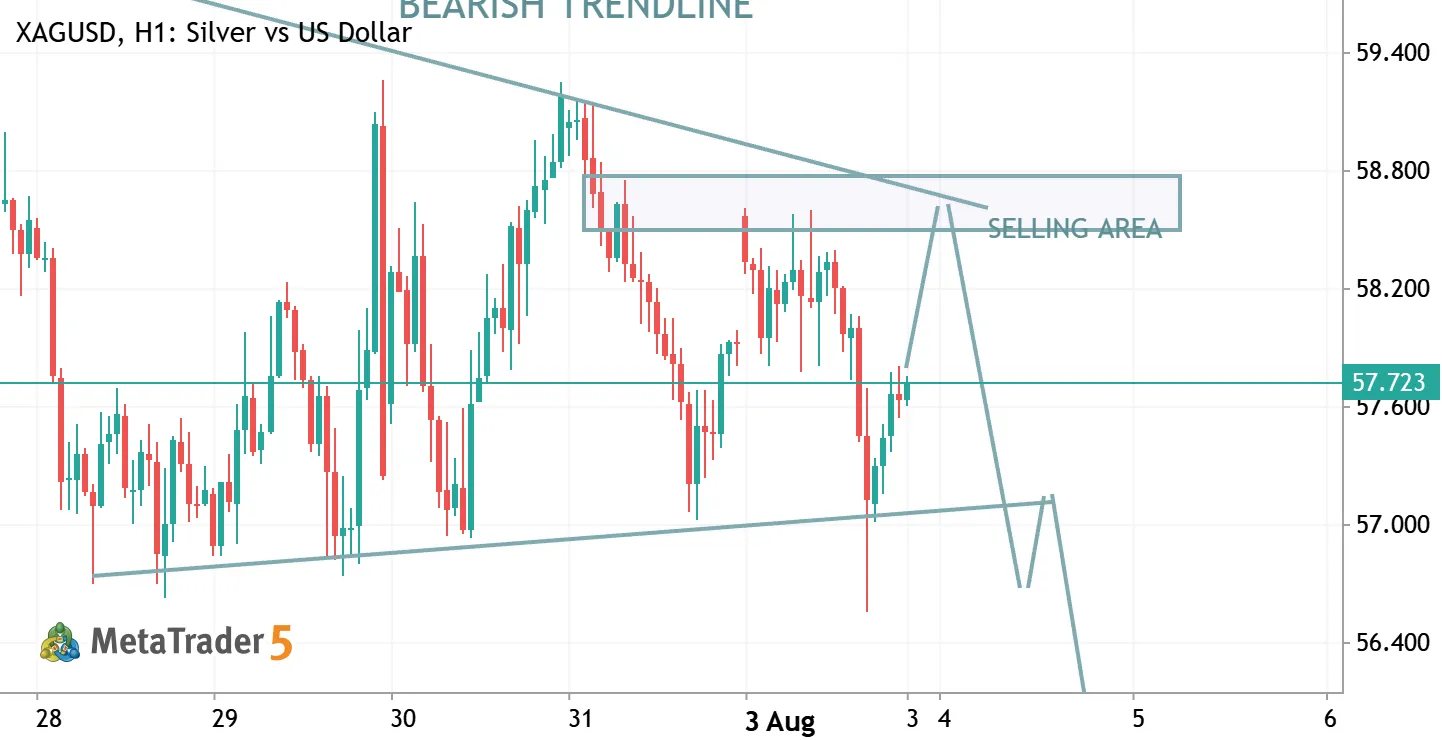
Trade Signal: SHORT (SELL) Asset: XAGUSD (Silver - H1) Entry Zone: 58.600 – 58.700 Stop Loss (SL): 59.100 (Above the descending trendline & recent high) Take Profit 1 (TP1): 56.800 (Lower trendline / local support area) Take Profit 2 (TP2): 55.300 (Major Support Zone) Key Technical Reasons Bearish Trendline Resistance: Price is forming lower highs, respecting a prominent descending trendline that continues to limit upside momentum. Horizontal Supply Zone: The 58.600–58.700 area has consistently acted as strong horizontal resistance, triggering repeated price drops whenever retested. High-Probability Confluence: The overlapping descending trendline and horizontal supply level create a strong rejection zone for high-reward short opportunities. Targeting Liquidity: The setup targets the