
Gráficos e ideas
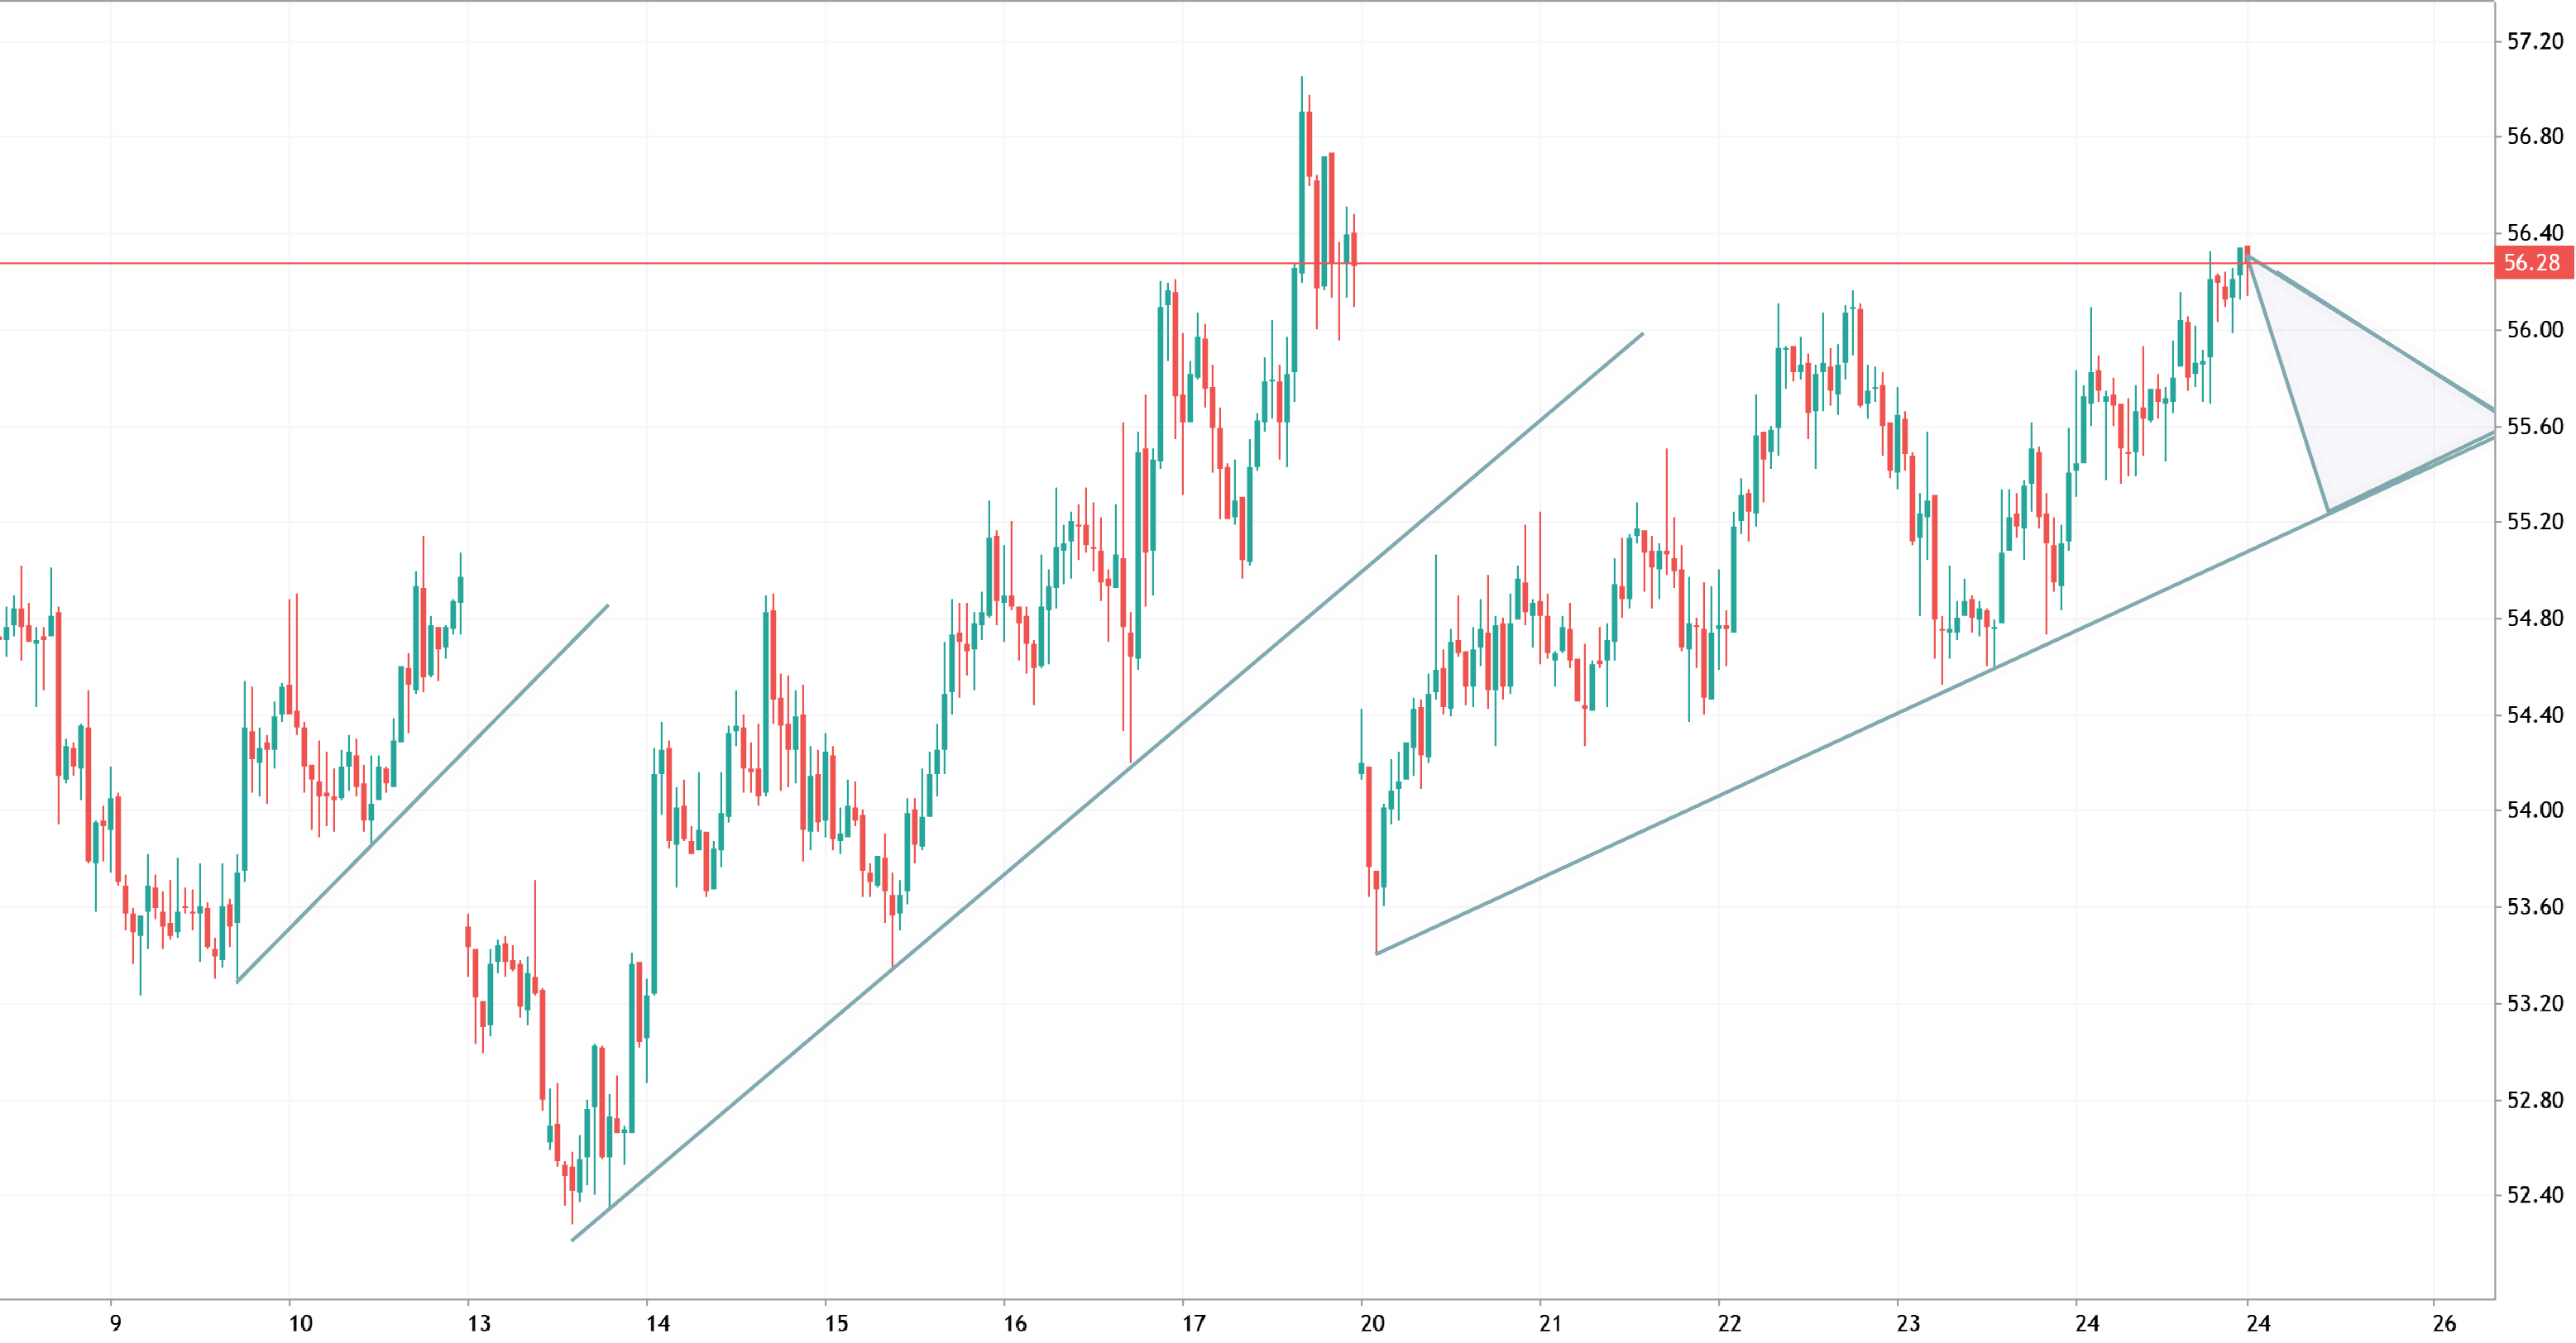
Pattern quality and probabilistic scoring
Short verdict — The chart shows an ascending triangle nested in an upward channel; the highest‑probability outcome is an upside continuation but with meaningful failure modes. Treat this as a probabilistic trade rather than a certainty: require confirmation (breakout close, volume, momentum) and manage position sizing to the edge you expect to earn. Pattern quality and probabilistic scoring Attribute Assessment Score 1–10 Structure symmetry Clean horizontal resistance; rising support with 3+ higher lows 8 Trend context Inside a multi‑bar ascending channel — continuation bias 8 Volume signal Not shown; missing critical confirmation 2 Momentum alignment Price near mid‑channel; check RSI/MA slope for confirmation 6 Time compression Triangle age moderate — measured move meaningful 7 Measured
2026.04.26 10:29 0 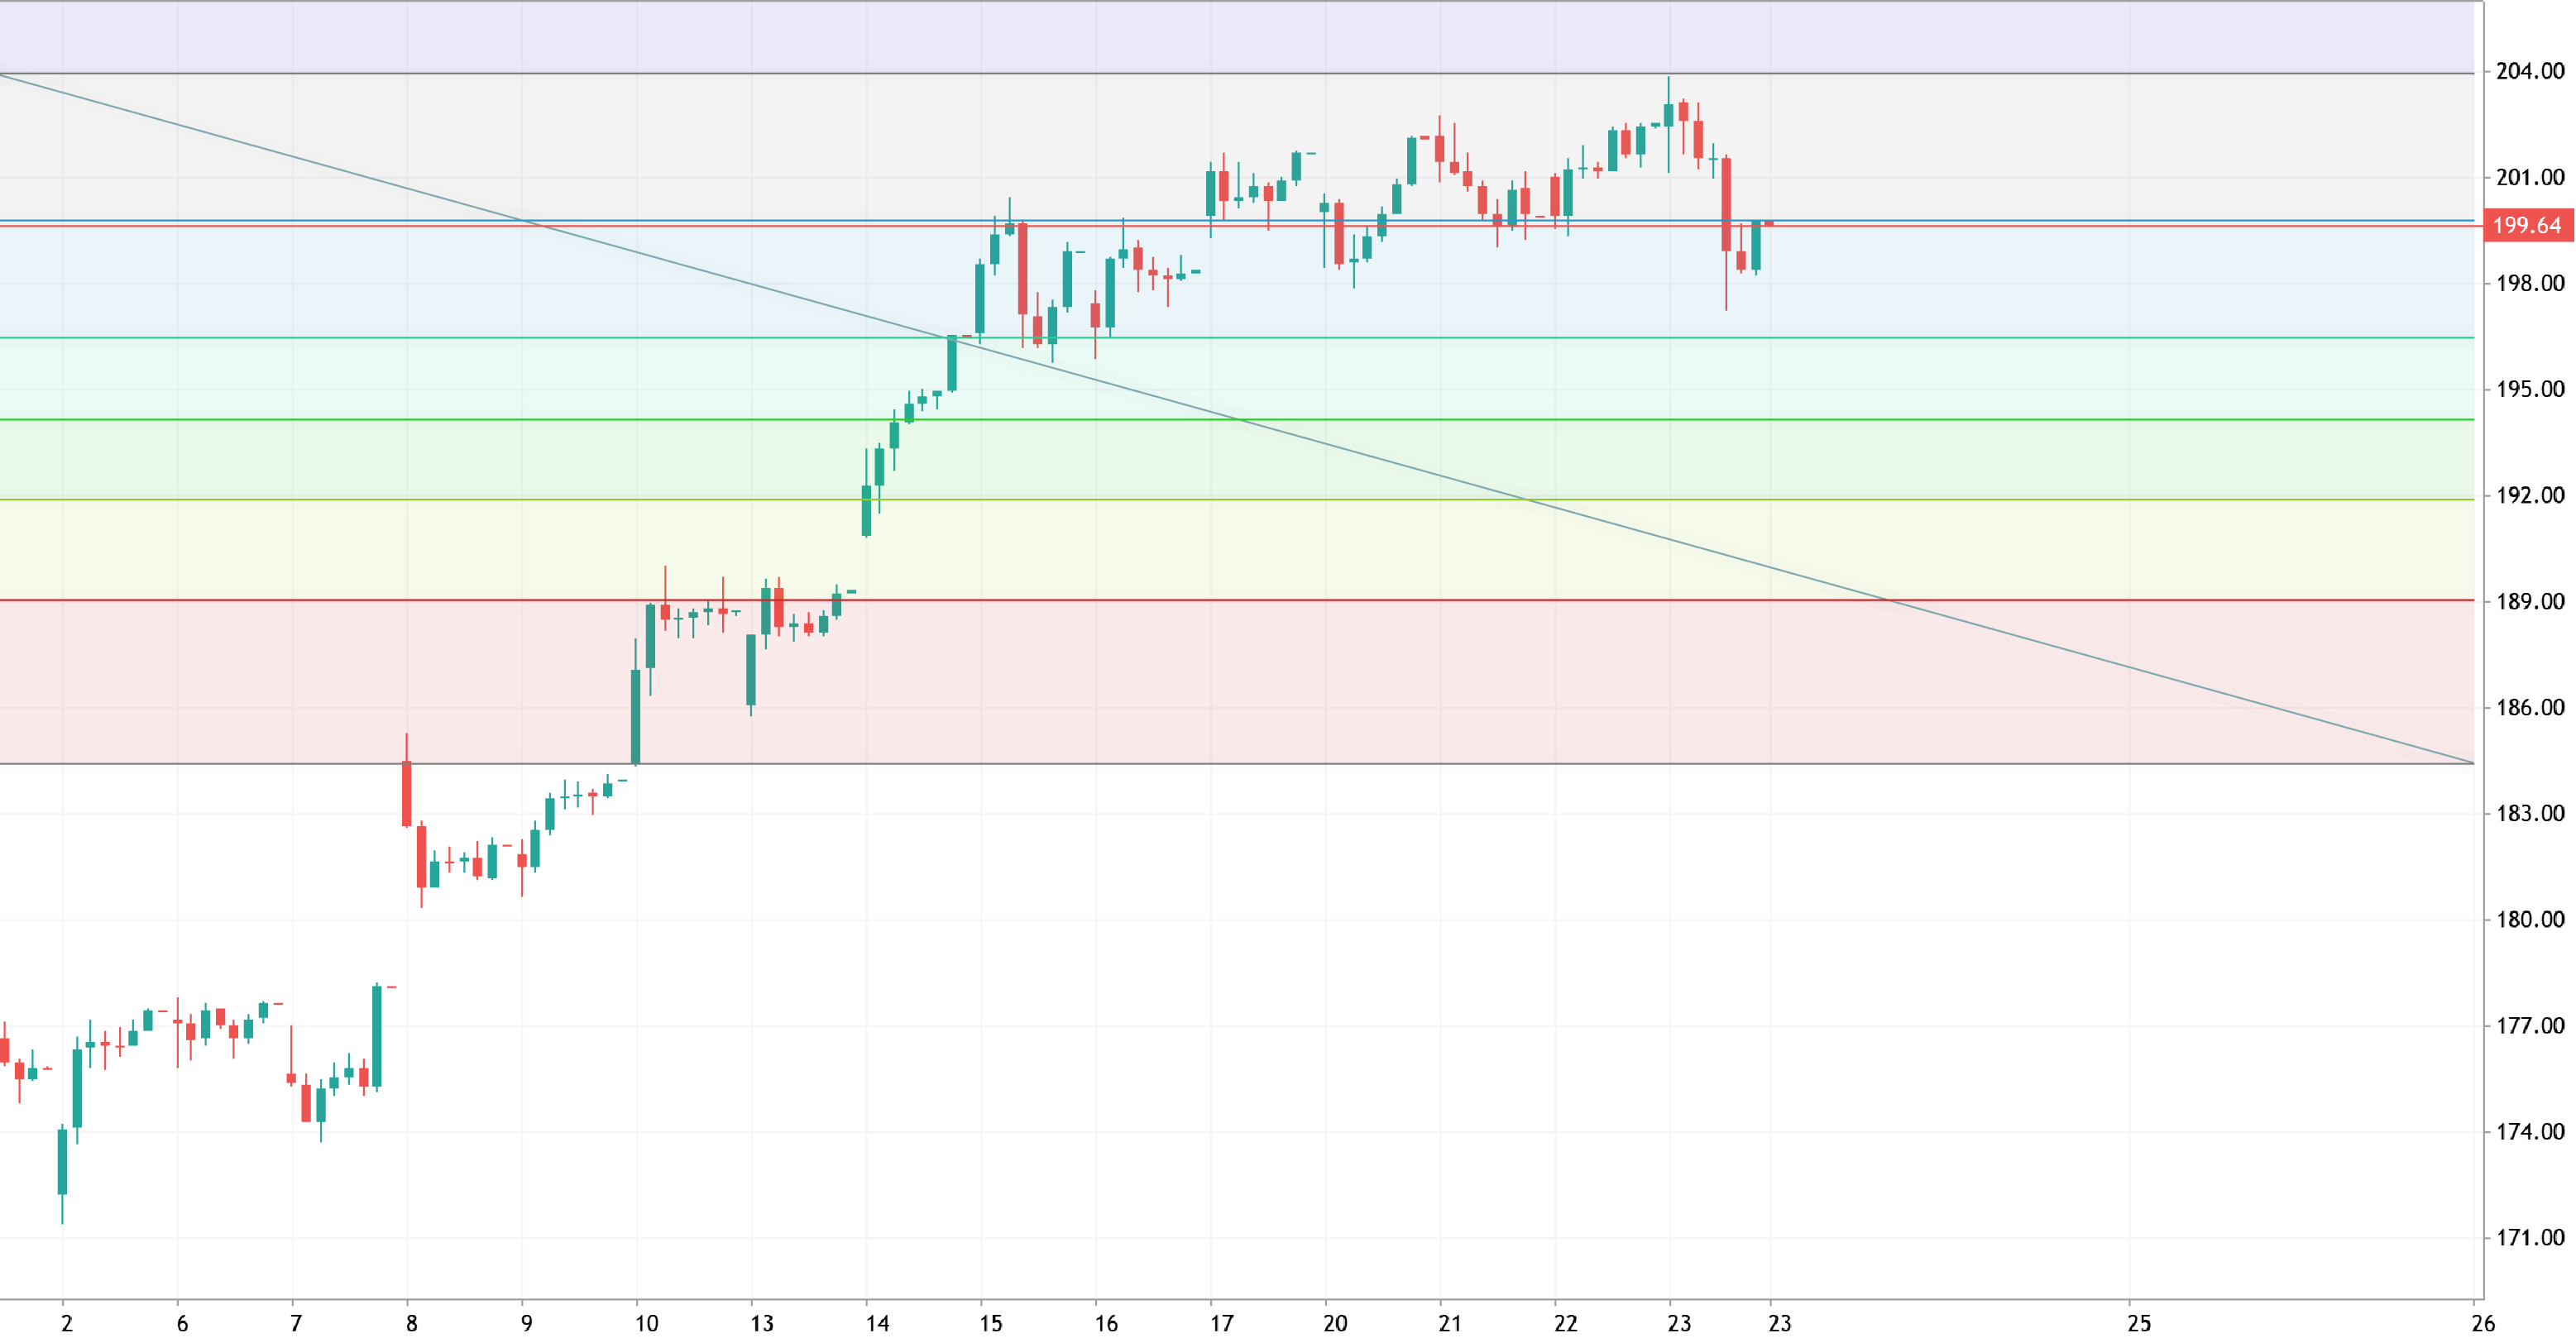

NVDA
Trendline Rejection vs Breakout Primary Bias: Bearish Rejection The confluence of the downtrend line and the 200 psychological level suggests sellers may defend this zone. If price fails to close above 200, expect a pullback toward the green support zone (~192–194). Execution Plan: Entry: Short near 199.50–200.00 with bearish candlestick confirmation (shooting star, bearish engulfing). Stop‑loss: Above 202.50 (beyond the trendline and resistance zone). Targets: TP1: 194.00 (green zone). TP2: 190.00 (blue zone). Risk/Reward: Aim for at least 1:2. Alternative Bias: Bullish Breakout A decisive close above 202 would invalidate the trendline resistance. Breakout traders could then target the purple zone (~206–208). Execution Plan: Entry: Buy on breakout retest above 202.00. Stop‑loss: Below
2026.04.24 08:22 2