Gráficos e ideas
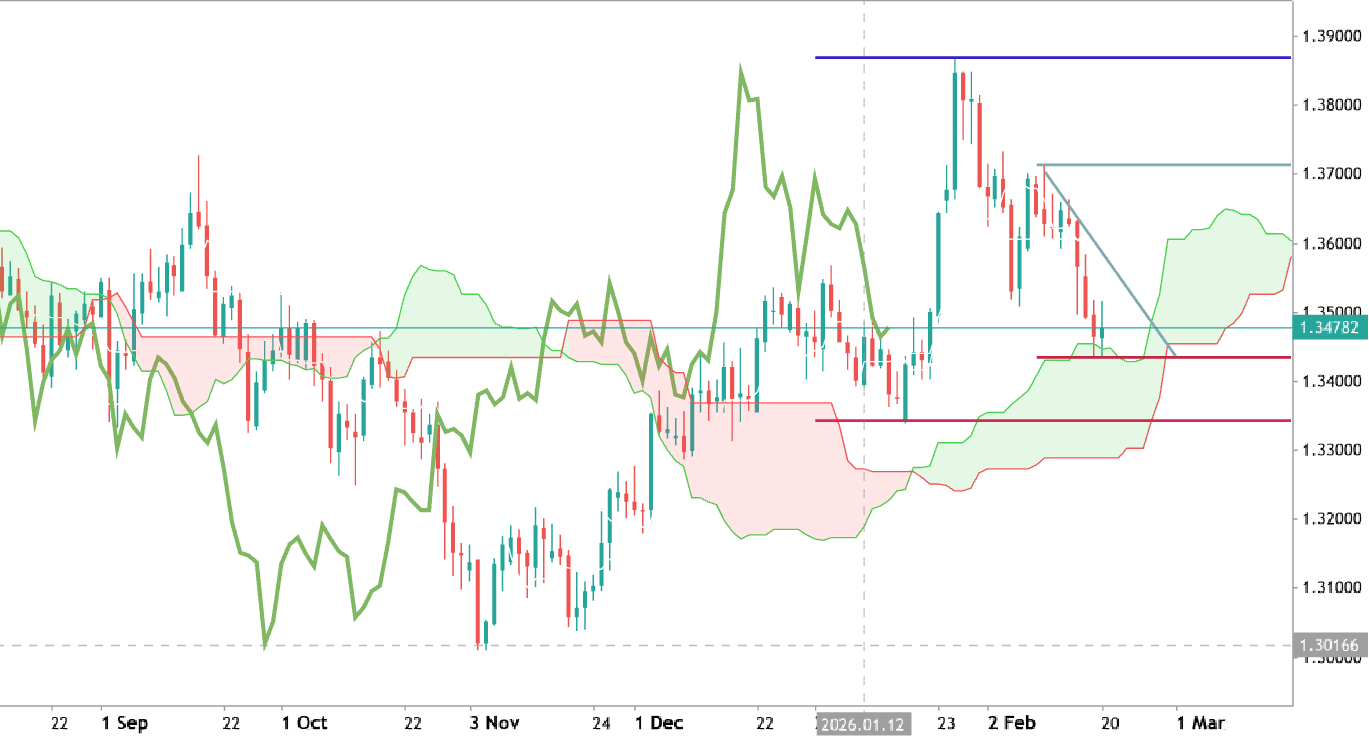
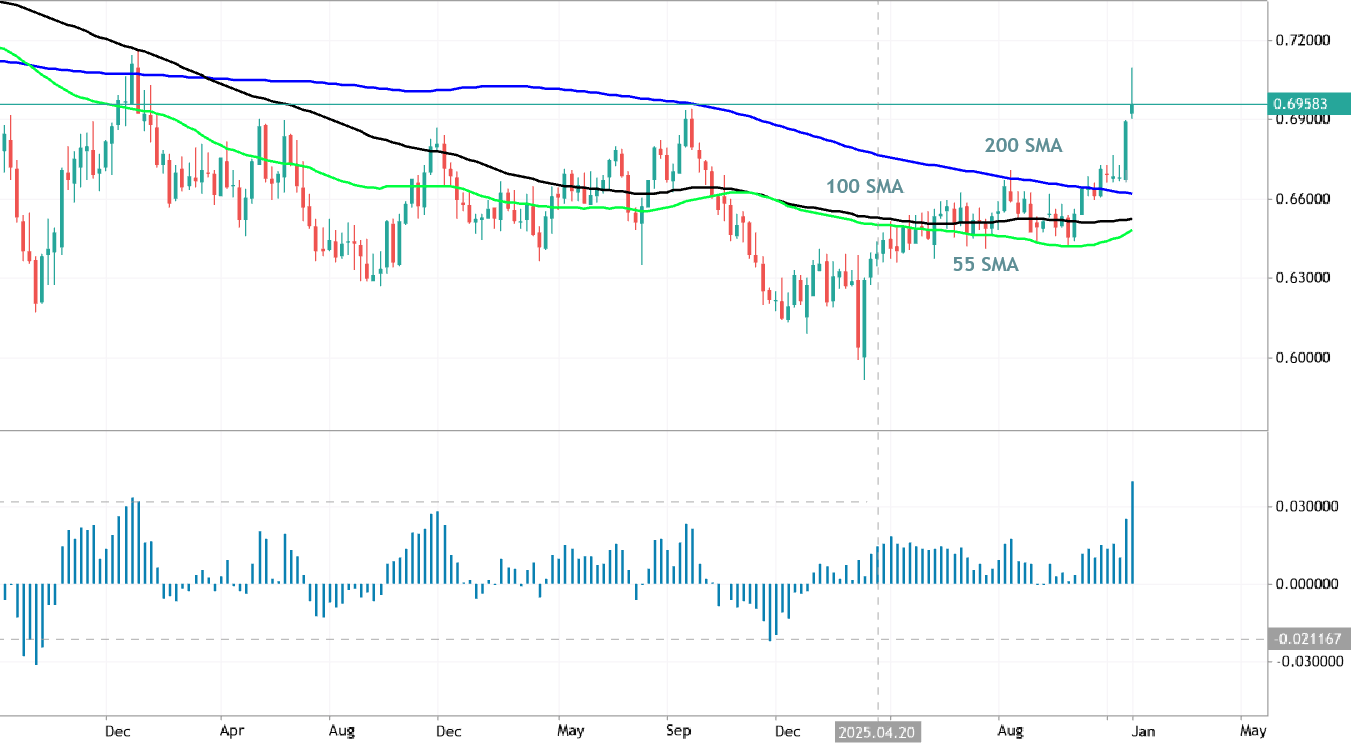
USDCHF - Long-Term Forecast
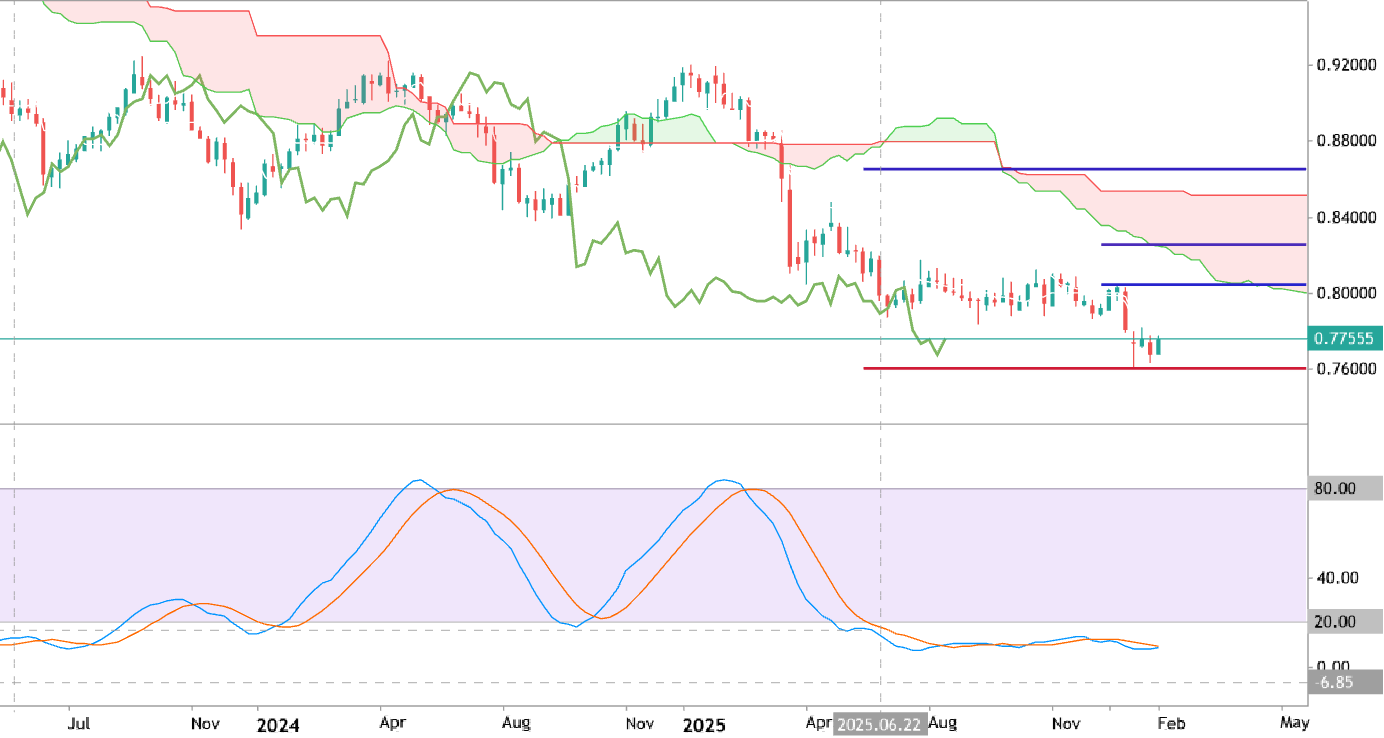
GBPUSD: Correction to the Bearish Reversal
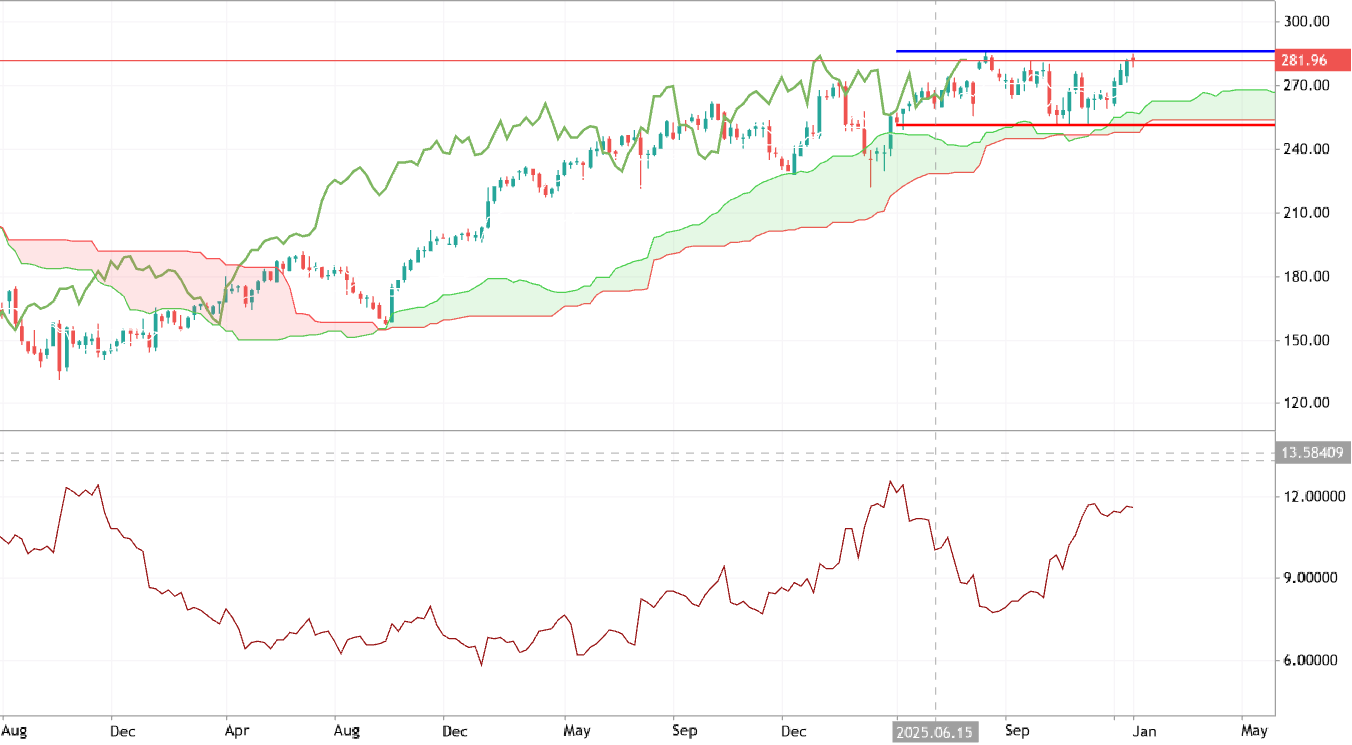
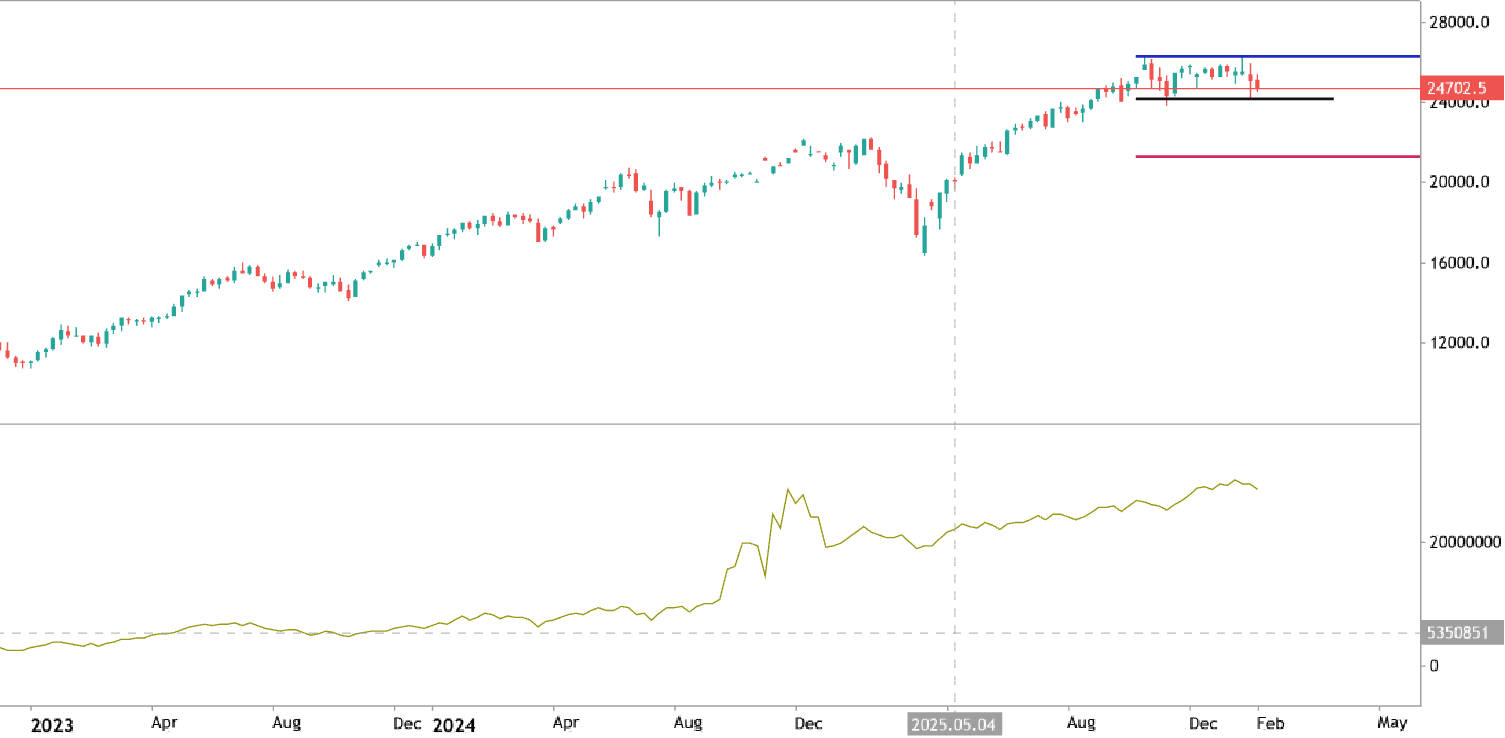
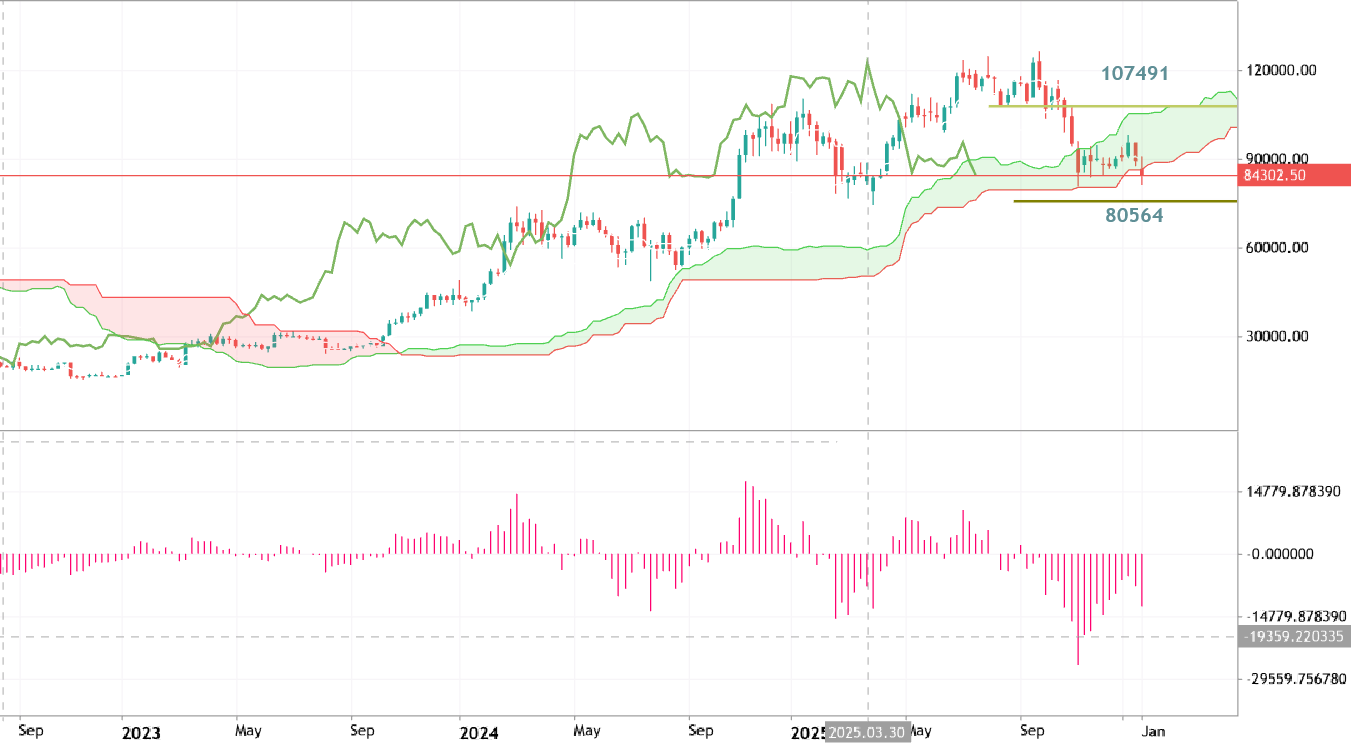
Trading Ideas for 2026: USTECH100mini - Technical Forecast and Levels
Accumulation/Distribution - traditional general approach
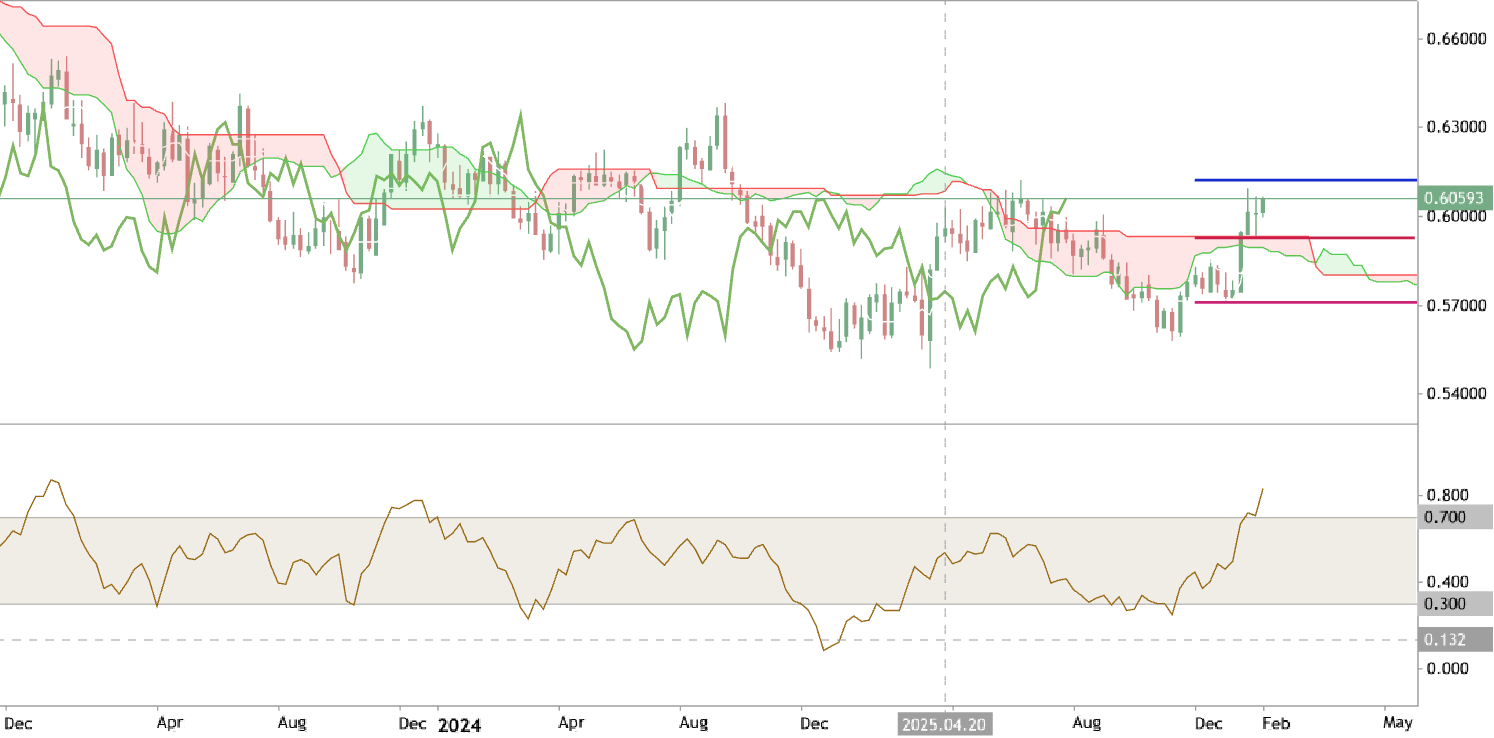
Bullish Breakout for NZDUSD
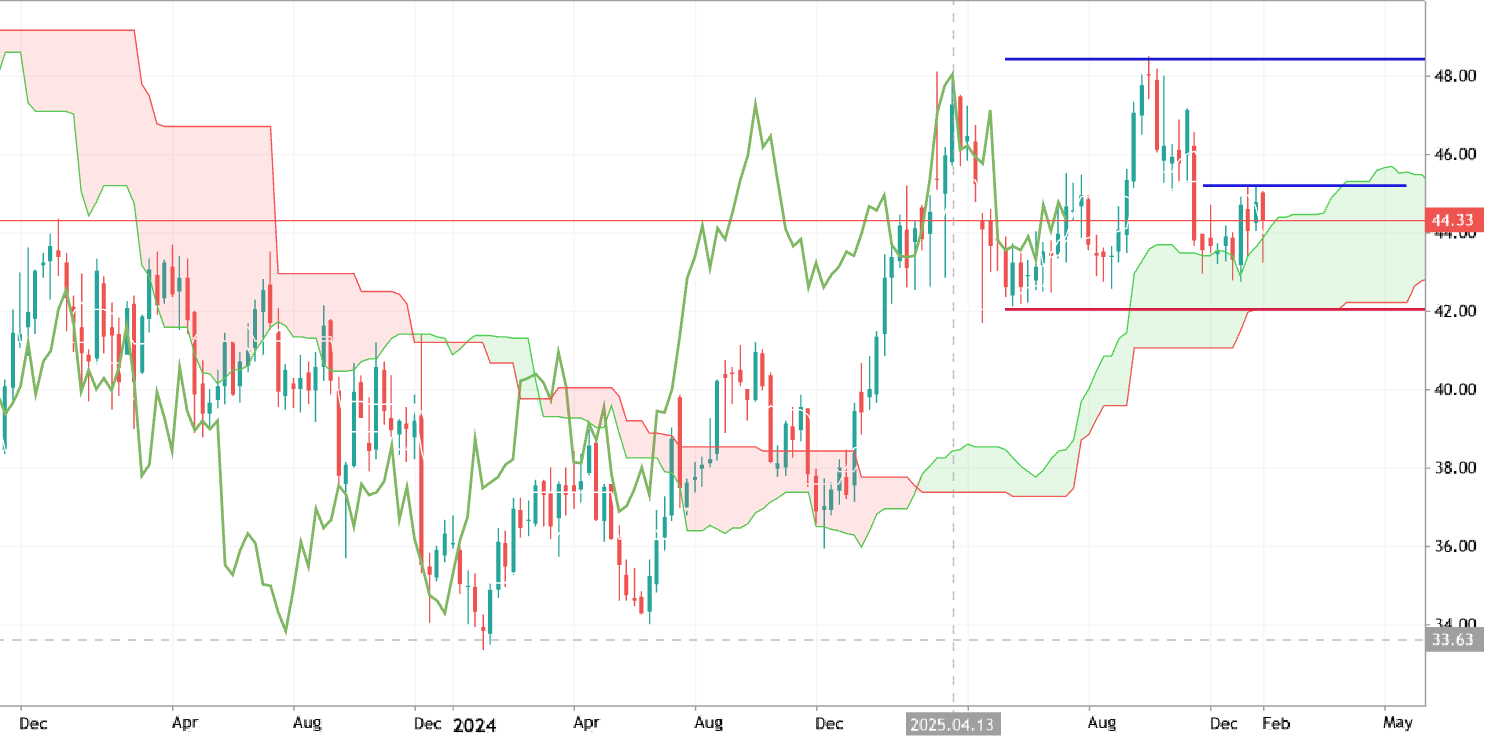

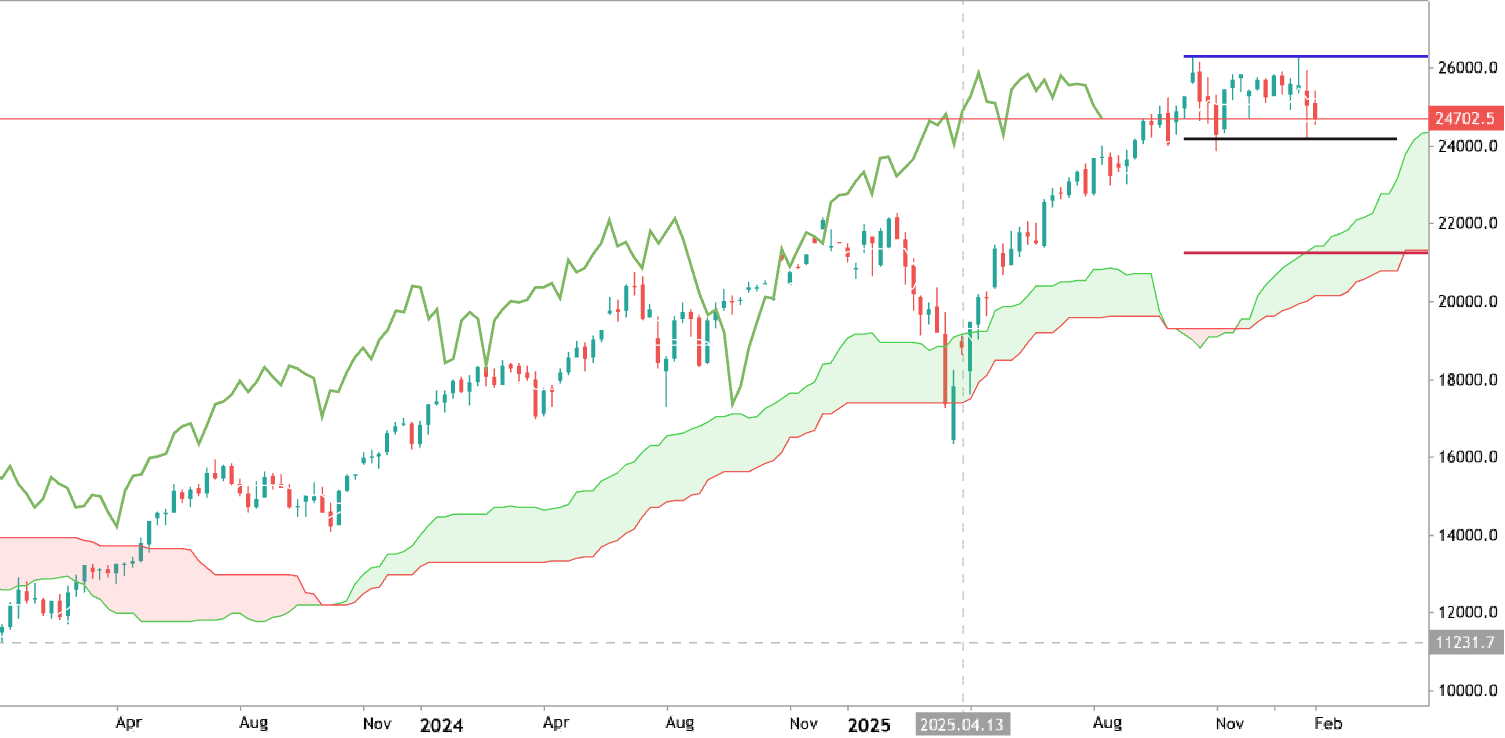
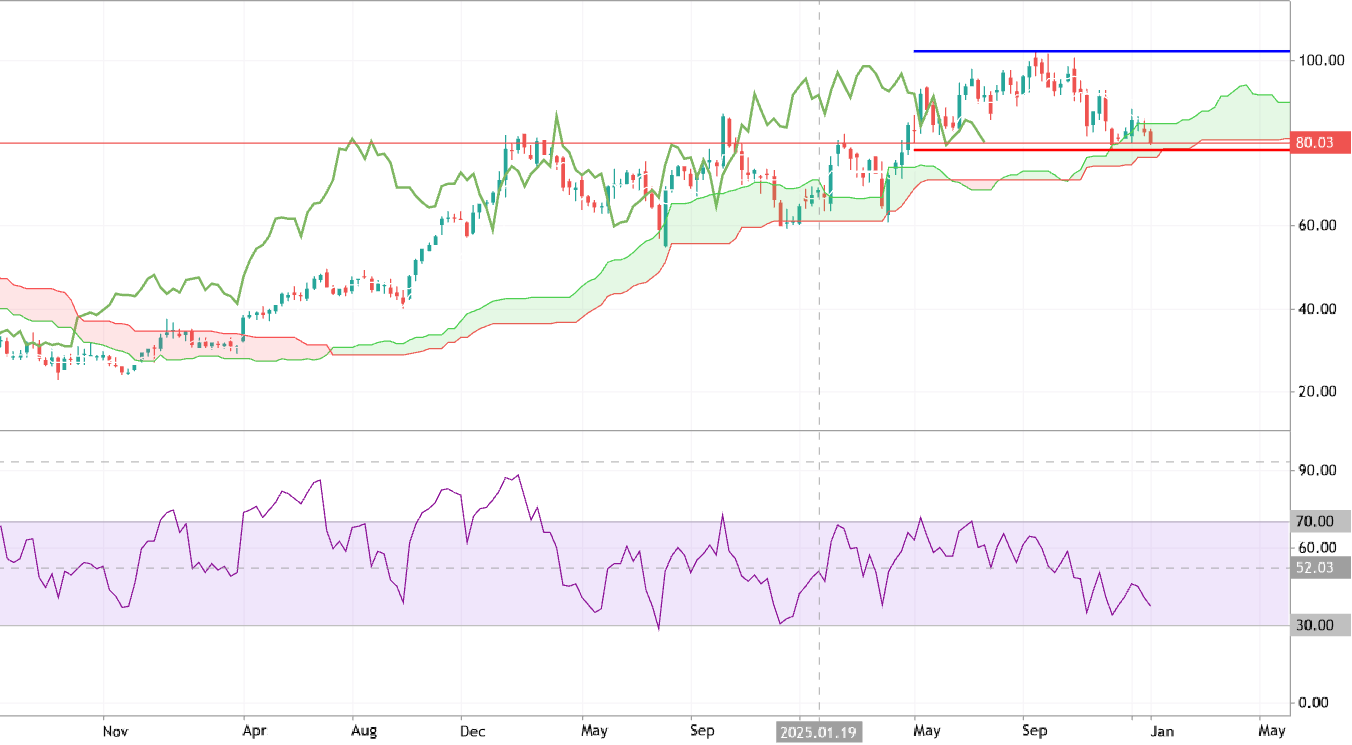
Trading Ideas for 2026: EXC - Technical Forecast and Levels
The weekly price is located near and inside Ichimoku cloud for the ranging waiting for direction. If the price breaks resistance level at 45.19 to above with 48.44 as the next possible target so the primary bullish trend will be continuing. If the price crosses 42.05 support to below so the weekly bearish reversal will be started. Trading Summary: waiting for direction
Bulls Power - traditional general approach
Bulls Power is used to estimate power of the Bulls (Buyers). Bulls Power estimates the balance of power between the bulls and bears. This indicator aims at identifying if a bullish trend will continue or if the price has reached a point where it might reverse. A buy signal is generated when the Bulls Power oscillator moves above Zero. In an up trend, the HIGH is higher than EMA, so the Bulls Power is above zero and Histogram/Oscillator is located above zero line. Exit Signal: if the HIGH falls under EMA then it means that price are starting to fall, the Bulls Power histogram fall below the zero line.
Bears Power - traditional general approach

Accelerator oscillator - traditional general approach
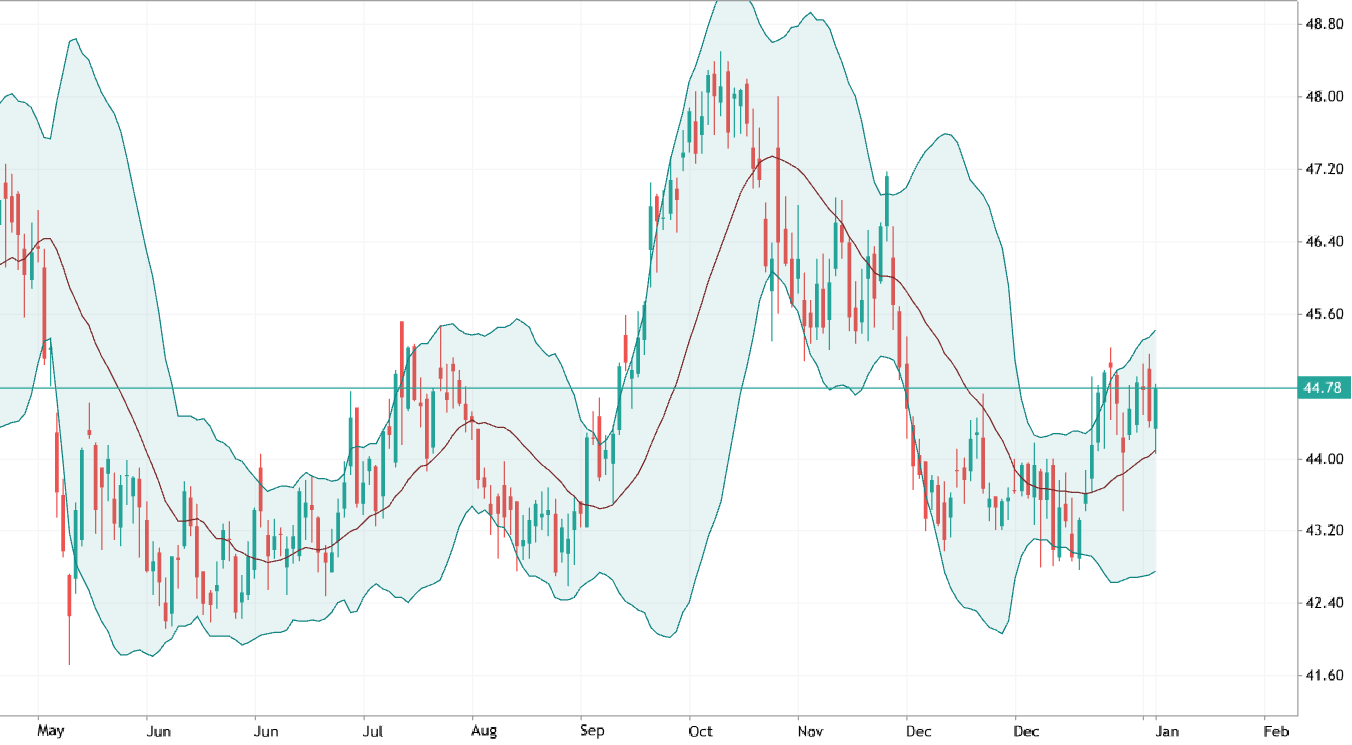
Bollinger Bands - traditional general approach

Trading Ideas for 2026: UBER - Technical Forecast and Levels