Screener

#Últimos 7 días
1
AAPL
Apple Inc. - Common Stock
342.37 USD-0.52%-0.09%+3.19%+27.30%4.98 T USD
2
NVDA
NVIDIA Corporation - Common Stock
186.64 USD+2.78%-10.09%-20.20%-4.34%4.50 T USD
3
MSFT
Microsoft Corporation - Common Stock
530.61 USD-0.99%+1.24%+0.45%+6.15%3.94 T USD
4
GOOGL
Alphabet Inc. - Class A Common Stock
284.78 USD+0.78%+0.82%-18.97%+0.13%3.50 T USD
5
AMZN
Amazon.com, Inc. - Common Stock
259.30 USD-0.35%+6.67%+1.17%+4.43%2.80 T USD
6
TSM
Taiwan Semiconductor Manufacturing Company Ltd
375.22 USD+6.59%-9.09%-19.21%+27.47%1.95 T USD
7
SPCX
SpaceX Space Exploration Technologies Corp
134.27 USD+8.62%-2.02%-18.79%-10.49%1.82 T USD
8
META
Meta Platforms, Inc. - Class A Common Stock
610.15 USD+0.84%-0.70%-16.01%-3.36%1.56 T USD
9
TSLA
Tesla, Inc. - Common Stock
358.22 USD+4.23%-11.49%-6.32%-18.52%1.42 T USD
10
AVGO
Broadcom Inc. - Common Stock
293.69 USD+0.74%-10.58%-19.67%-18.03%1.40 T USD

Mapa de calor

Gráficos e ideas

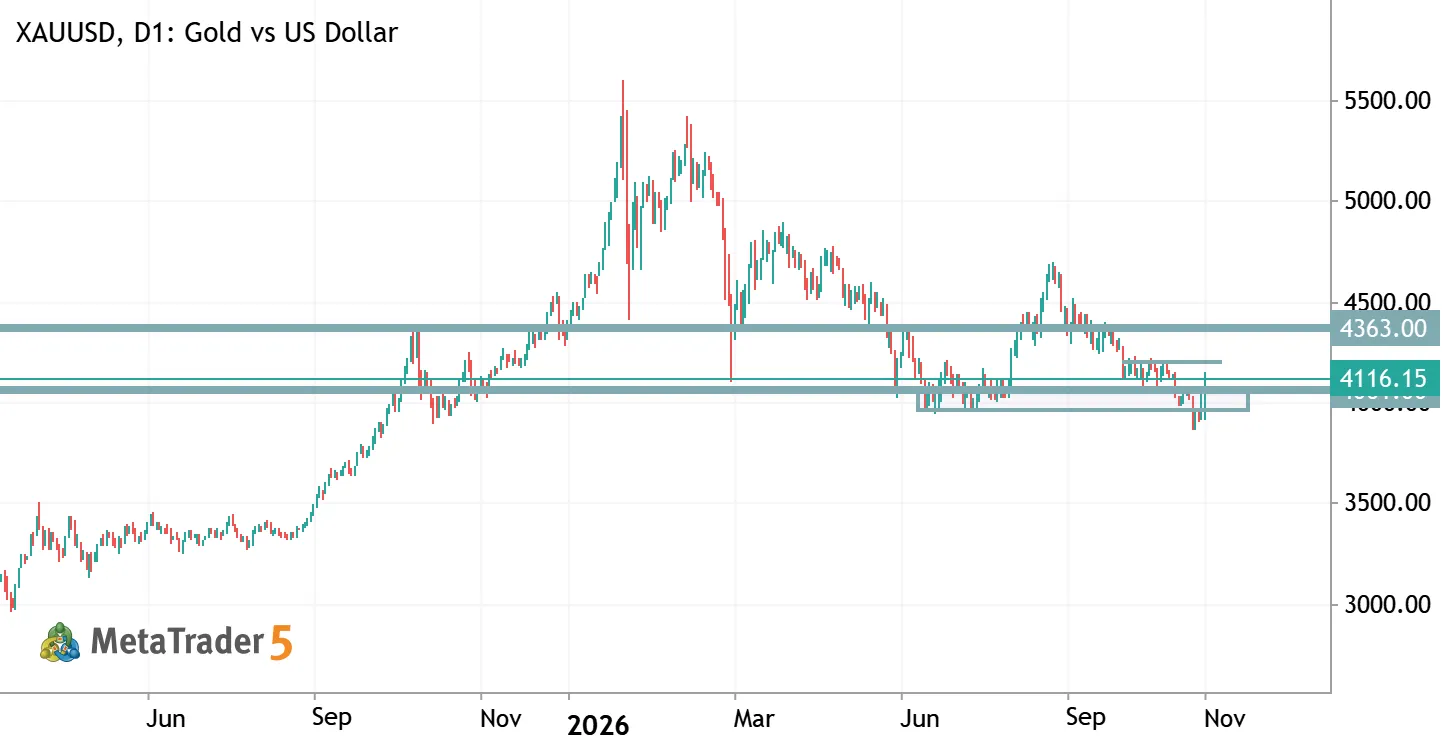
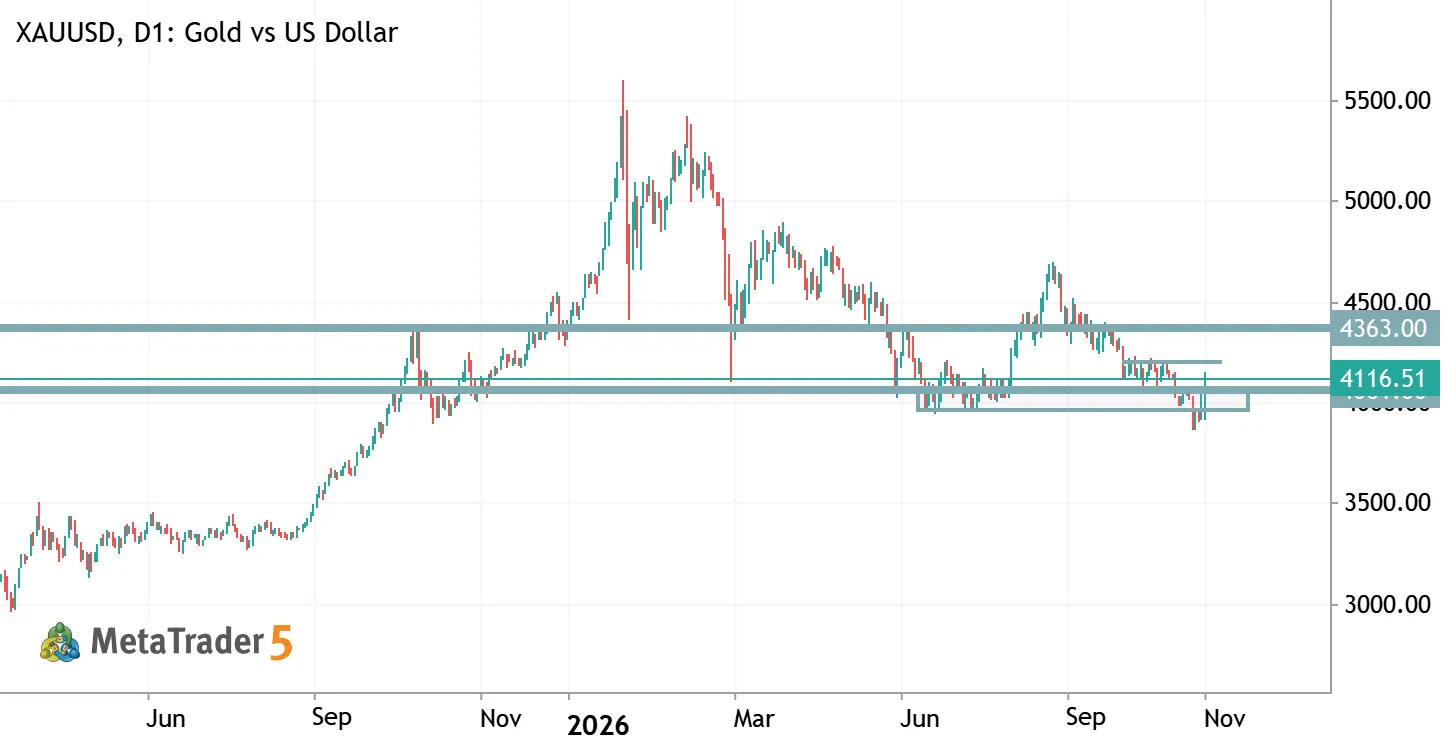
#XAUUSD: ¿Una trampa bajista en los $4.000? XAUUSD Gold vs US Dollar

#XAUUSD: ¿Una trampa bajista en los $4.000?

El oro ha protagonizado un fuerte giro alcista después de caer por debajo del nivel psicológicamente importante de $4.000 . El apoyo fundamental llegó tras los resultados de las elecciones de mitad de mandato en Estados Unidos, donde los demócratas reforzaron su posición política. Un dólar estadounidense más débil, la caída de los rendimientos de los bonos del Tesoro y la disminución de las preocupaciones inflacionarias en medio del descenso de los precios del petróleo crearon condiciones favorables para la recuperación de XAUUSD. Desde el punto de vista técnico, la situación recuerda a una clásica trampa bajista (bear trap). Tras romper el soporte, los vendedores no lograron prolongar el movimiento descendente. El precio regresó rápidamente por encima de los $4.000, lo que pudo provocar

#XAUUSD: A Bear Trap at $4,000? XAUUSD Gold vs US Dollar

#XAUUSD: A Bear Trap at $4,000?

Gold has staged a sharp reversal after falling below the psychologically important $4,000 level . Fundamental support came from the U.S. midterm election results, where Democrats strengthened their political position. A weaker U.S. dollar, declining Treasury yields, and easing inflation concerns amid falling oil prices created favorable conditions for a recovery in XAUUSD. Technically, the situation resembles a classic bear trap. Following the breakdown below support, sellers failed to extend the decline. The price quickly recovered above $4,000, potentially triggering short covering and adding momentum to the rally. Key Levels: $4,150–4,180 — the highest-volume trading area over the past year and immediate resistance. $4,000–4,040 — an important support zone. $3,900 — the area of recent
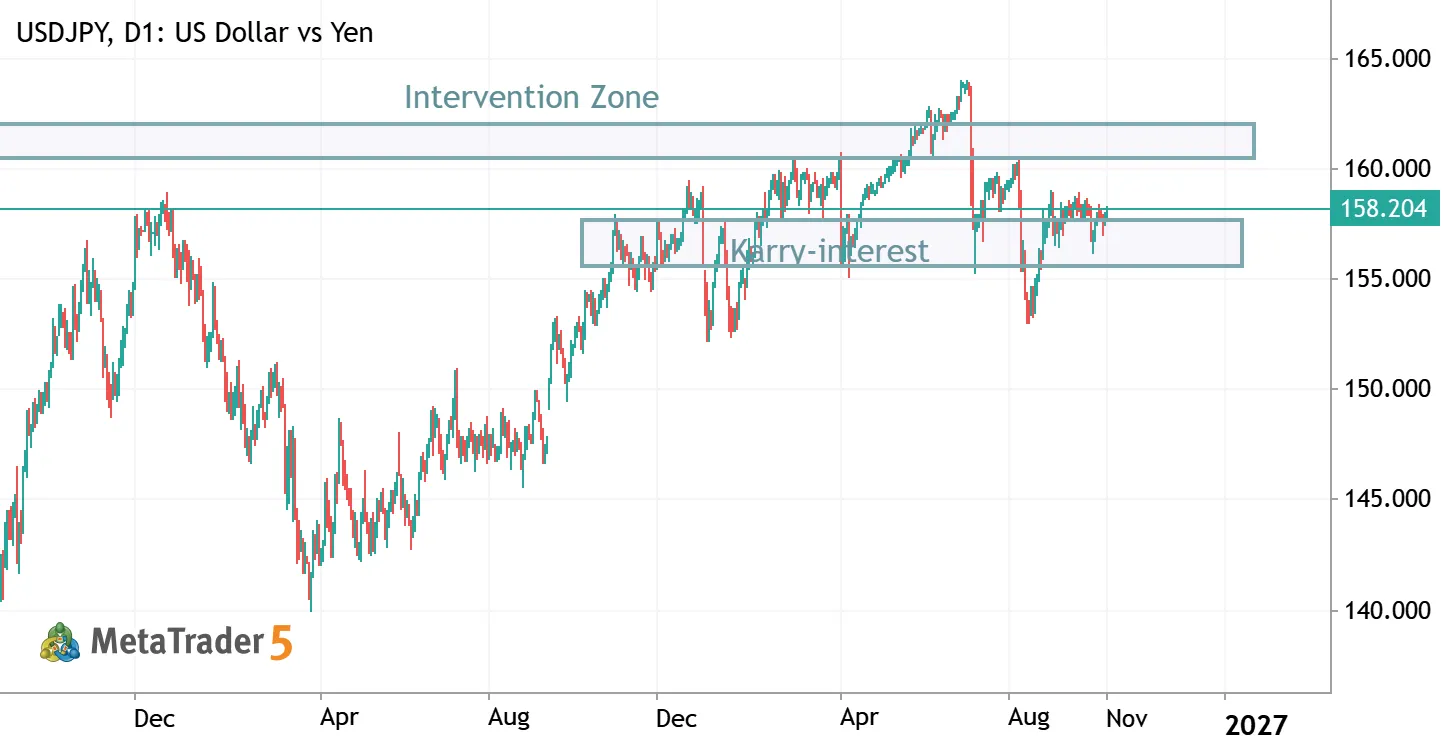
USDJPY Approaches 160: Carry Trade Strength vs Japan Intervention Risk USDJPY US Dollar vs Yen

USDJPY Approaches 160: Carry Trade Strength vs Japan Intervention Risk

USDJPY is once again approaching the psychologically important 160 level , where market attention traditionally shifts toward possible action by Japanese financial authorities. However, reaching 160 does not automatically mean that a currency intervention will follow. For Japan’s Ministry of Finance and the Bank of Japan, other factors also matter, including the speed of yen depreciation, the nature of the USDJPY move, and the level of speculative activity . A gradual rise and a sharp speculative spike are very different situations from the perspective of potential policy action. Why Does USDJPY Remain Strong? The main fundamental driver remains the interest rate differential between the United States and Japan. After the latest Federal Reserve meeting, the U.S. policy rate remained in the
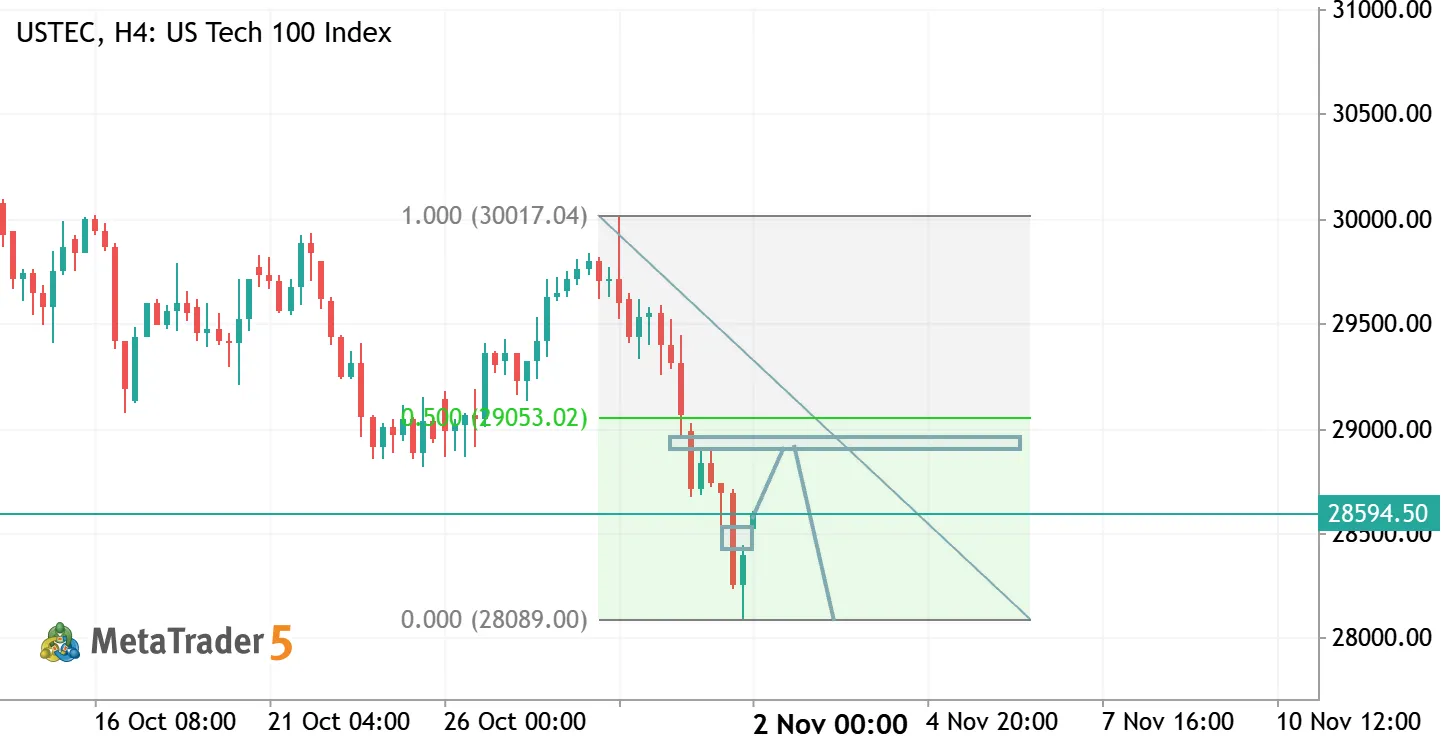
USTEC (NQ) 24H Outlook: Liquidity Sweep & SIBI Rebalance Toward 28,089 TEC USTEC Short US Tech 100 Index

USTEC (NQ) 24H Outlook: Liquidity Sweep & SIBI Rebalance Toward 28,089

Market Structure & ICT Context (H4) USTEC (US Tech 100) remains firmly in a Bearish Market Structure on the H4 timeframe following the aggressive displacement leg down from the 30,021.80 swing high to the 28,089.00 swing low. While the breakdown purged major Sell-Side Liquidity (SSL) below the previous structural floor, the vertical drop left behind significant price inefficiency (Fair Value Gaps / SIBI). Rather than chasing shorts in deep discount around 28,594 , institutional order flow typically seeks to rebalance inefficiency toward Equilibrium before initiating the next expansion leg down. Key Dealing Range & PD Arrays Current Dealing Range: 30,021.80 (High) to 28,089.00 (Low) 50% Equilibrium (Consequent Encroachment): 29,055.00 Immediate Intraday Test: 28,595.00 – 28,680.00
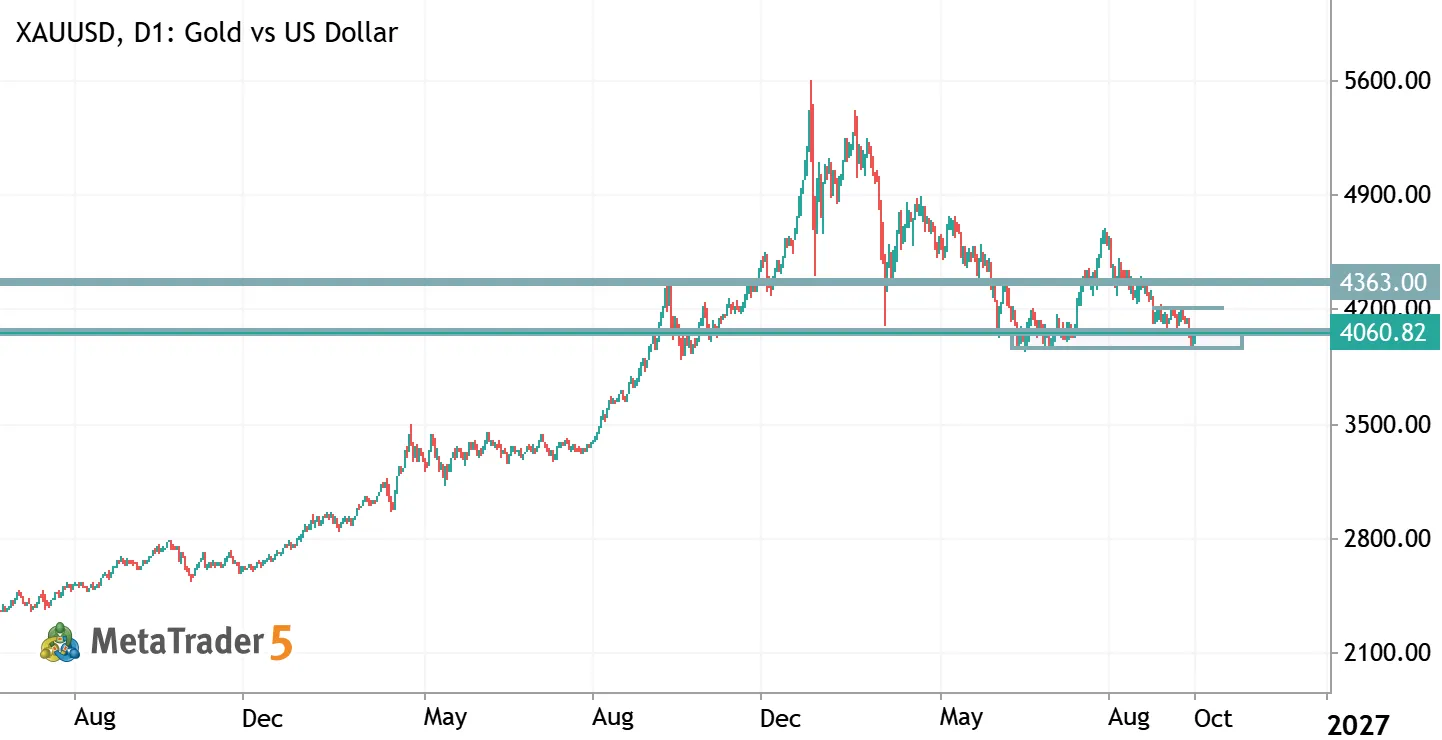
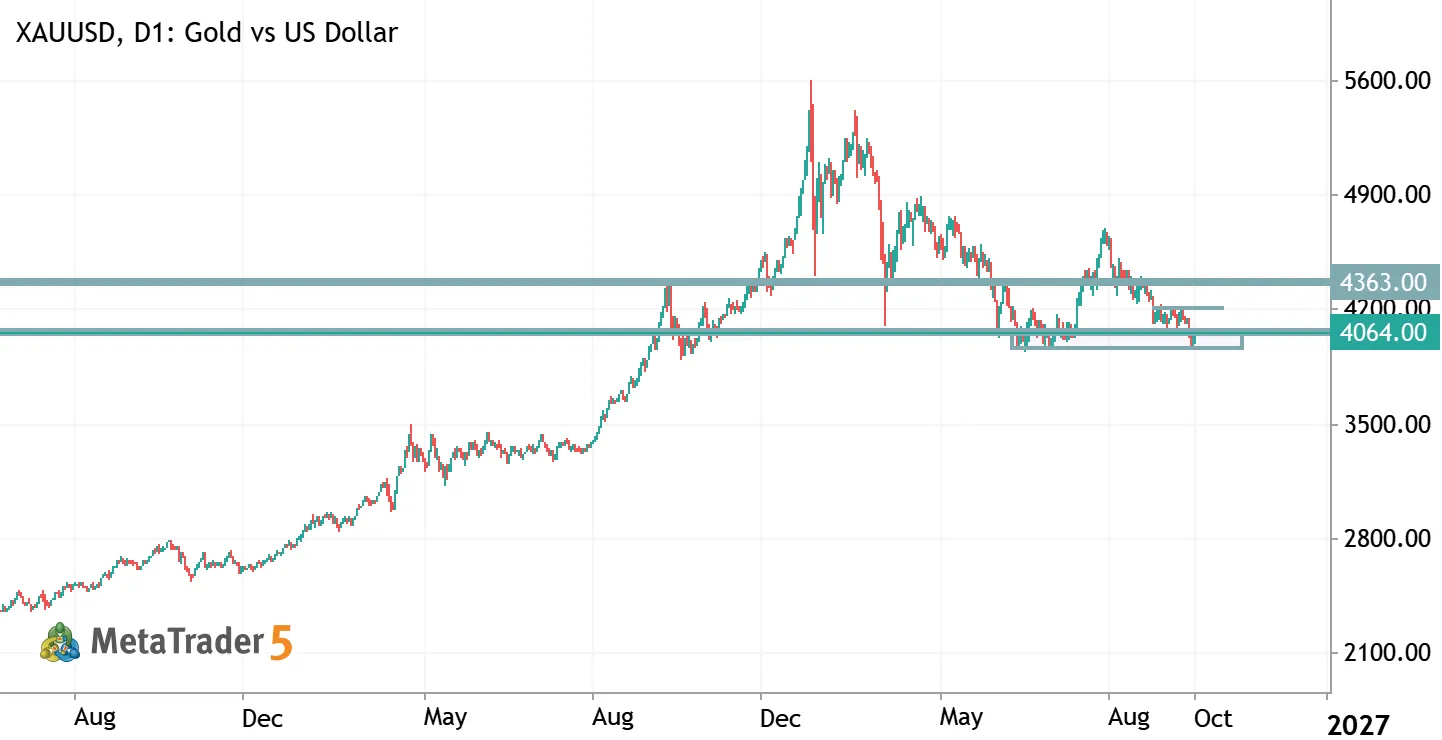
Pronóstico del oro XAUUSD para 2026: ¿Se mantendrá por encima de los $4.000 o caerá hasta los $3.500? XAUUSD Gold vs US Dollar

Pronóstico del oro XAUUSD para 2026: ¿Se mantendrá por encima de los $4.000 o caerá hasta los $3.500?

El oro vuelve a encontrarse en un nivel técnico decisivo. Tras una importante corrección, el precio del XAUUSD está poniendo a prueba la zona psicológica de los $4.000, que coincide con el área de mayor volumen negociado durante el último año. ¿Podrá el oro recuperar su tendencia alcista? ¿Cómo afectan las altas tasas de interés de la Reserva Federal, la inflación y el encarecimiento del petróleo al precio del metal precioso? Analicemos el panorama técnico y tres escenarios probabilísticos para los próximos 3–6 meses. Análisis técnico del XAUUSD: ¿Por qué son tan importantes los $4.000? El gráfico diario del oro muestra una secuencia de máximos descendentes, lo que refleja un debilitamiento de la presión compradora. Los compradores todavía no han conseguido recuperar el impulso alcista
Gold Price Forecast 2026: Will XAUUSD Hold Above $4,000 or Fall to $3,500? XAUUSD Gold vs US Dollar

Gold Price Forecast 2026: Will XAUUSD Hold Above $4,000 or Fall to $3,500?

Gold is once again approaching a critical technical level. Following a substantial correction, XAUUSD is testing the psychological $4,000 mark, which coincides with the highest-volume price area of the past year. Can gold resume its bullish trend? How do high Federal Reserve interest rates, inflation, and rising oil prices affect the precious metal? Let's examine the technical outlook and three probability-based scenarios for the next 3–6 months. XAUUSD Technical Analysis: Why Is $4,000 So Important? The daily gold chart shows a sequence of lower highs, indicating weakening buying pressure. Bulls have yet to restore the previous upward momentum. The key battle is now taking place around $4,000 — both a major psychological level and the highest-volume area over the past year. Holding this
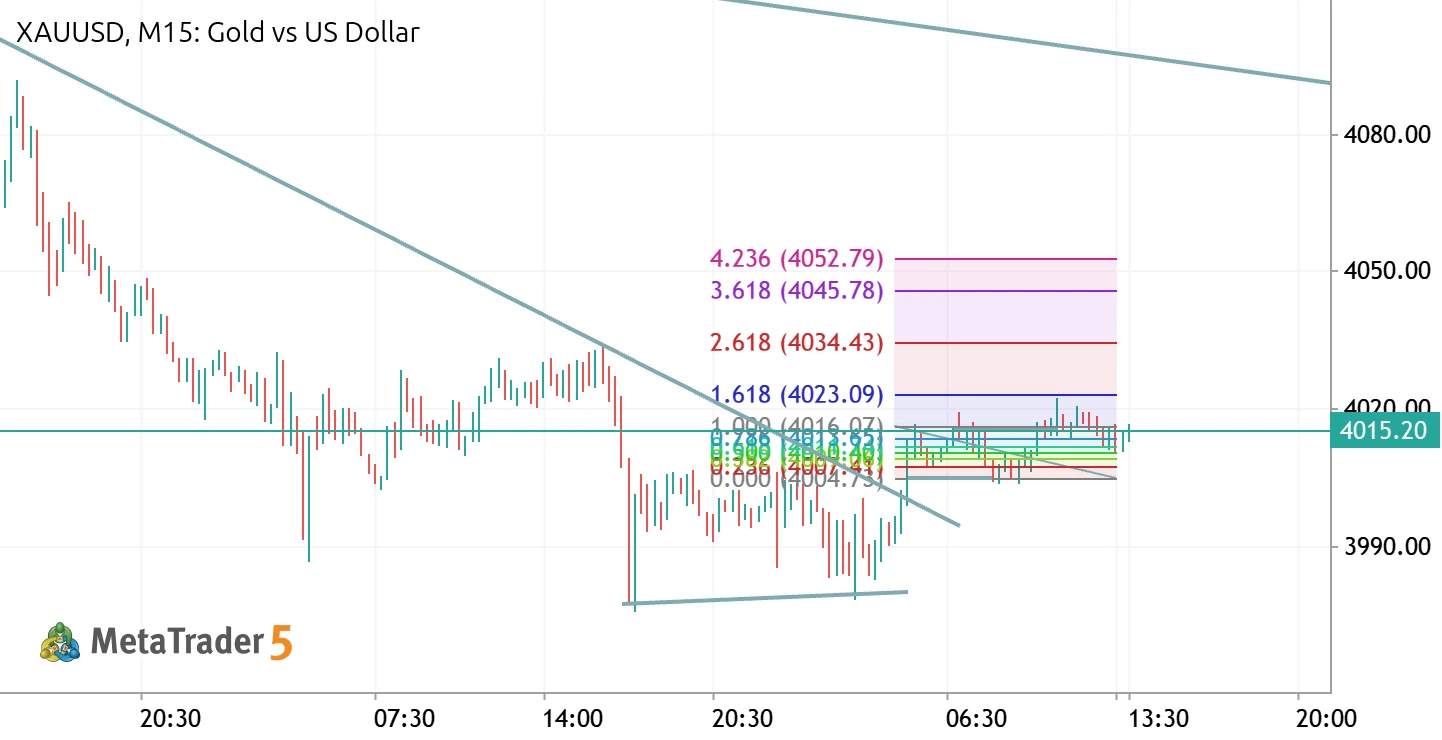
XAUUSD (Gold vs US Dollar), M15 (15-Minute) XAUUSD Long Gold vs US Dollar

XAUUSD (Gold vs US Dollar), M15 (15-Minute)

Price Structure & Trend Analysis: Major Trend: Overall, the price movement is still within a downtrend, indicated by the primary descending trendline (the upper diagonal line) acting as dynamic resistance. Short-Term Momentum: At the lower area, the price formed a consolidation pattern and has just broken out of the minor descending trendline. This breakout provides an early signal of a potential upward correction or short-term reversal. Key Levels & Fibonacci Areas: Critical Resistance Area: Currently, the price (at 4015.13) is testing a highly crucial resistance area. This zone is a confluence between the horizontal support/resistance line and the 1.000 Fibonacci level at 4015.67. Upside Projection Targets: Based on the Fibonacci drawing on the chart, if the price successfully