AAPL – Consolidating Below ATH, Watching for Breakout Continuation AAPL Long Apple Inc. - Common Stock
AAPL – Consolidating Below ATH, Watching for Breakout Continuation
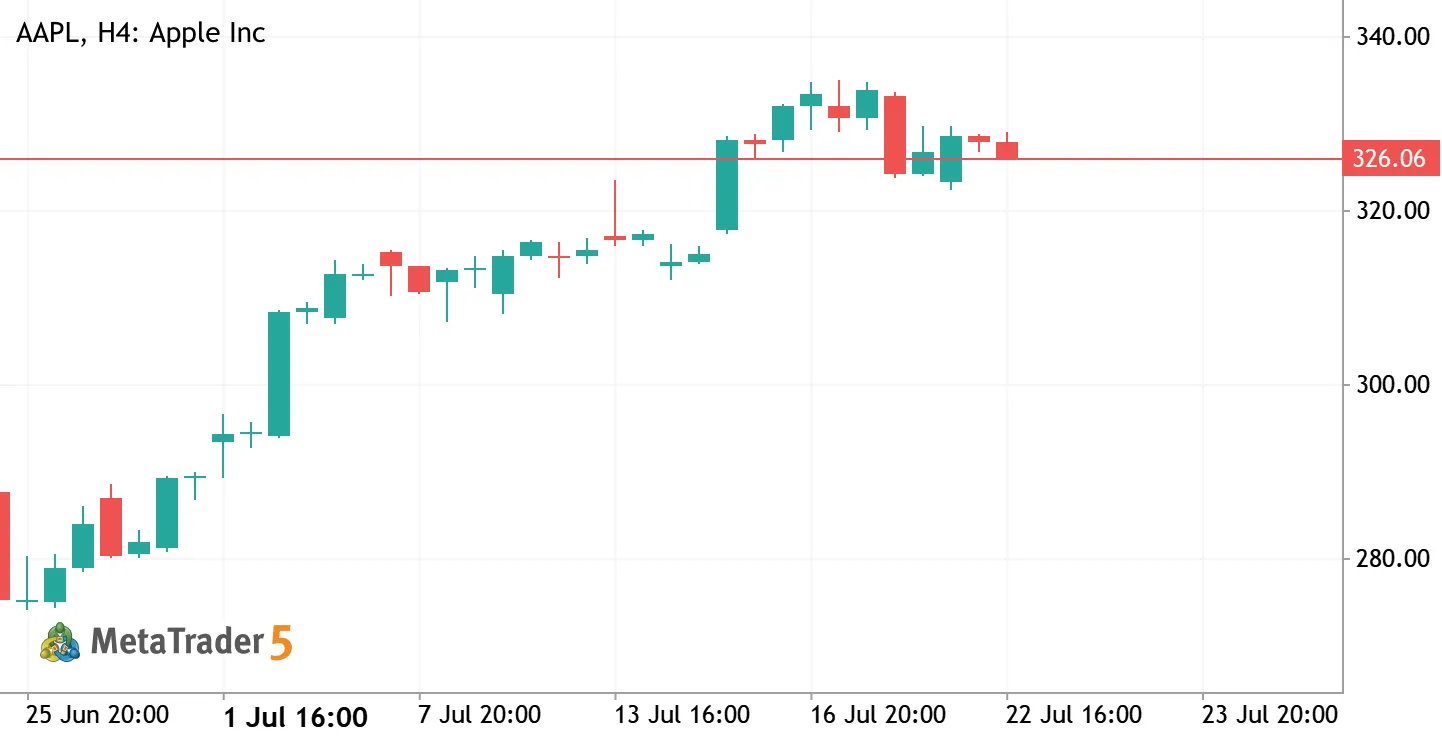
Apple hit a fresh all-time high of $334.99 on Jul 17 and has since pulled back slightly, closing at $327.74. Price is consolidating just under the $327.50–$335 resistance shelf, with momentum still constructive (RSI neutral-to-bullish). Bias: Bullish above $315, neutral-bearish below. Key levels: Resistance: $327.50 / $335 (ATH zone) Support: $315 / $283–$285 Setup: Long trigger: daily close/break above $335 → targets $345 / $355 Alternative: buy dip toward $315 support with bullish reversal candle, target back to $327–335 Invalidation: Daily close below $283 support zone negates the bullish structure. Not financial advice — DYOR.
0
m Maxim Kruglov 2026.07.22 13:57
AMZN - Daily Trading Forecast AMZN Amazon.com, Inc. - Common Stock
AMZN - Daily Trading Forecast
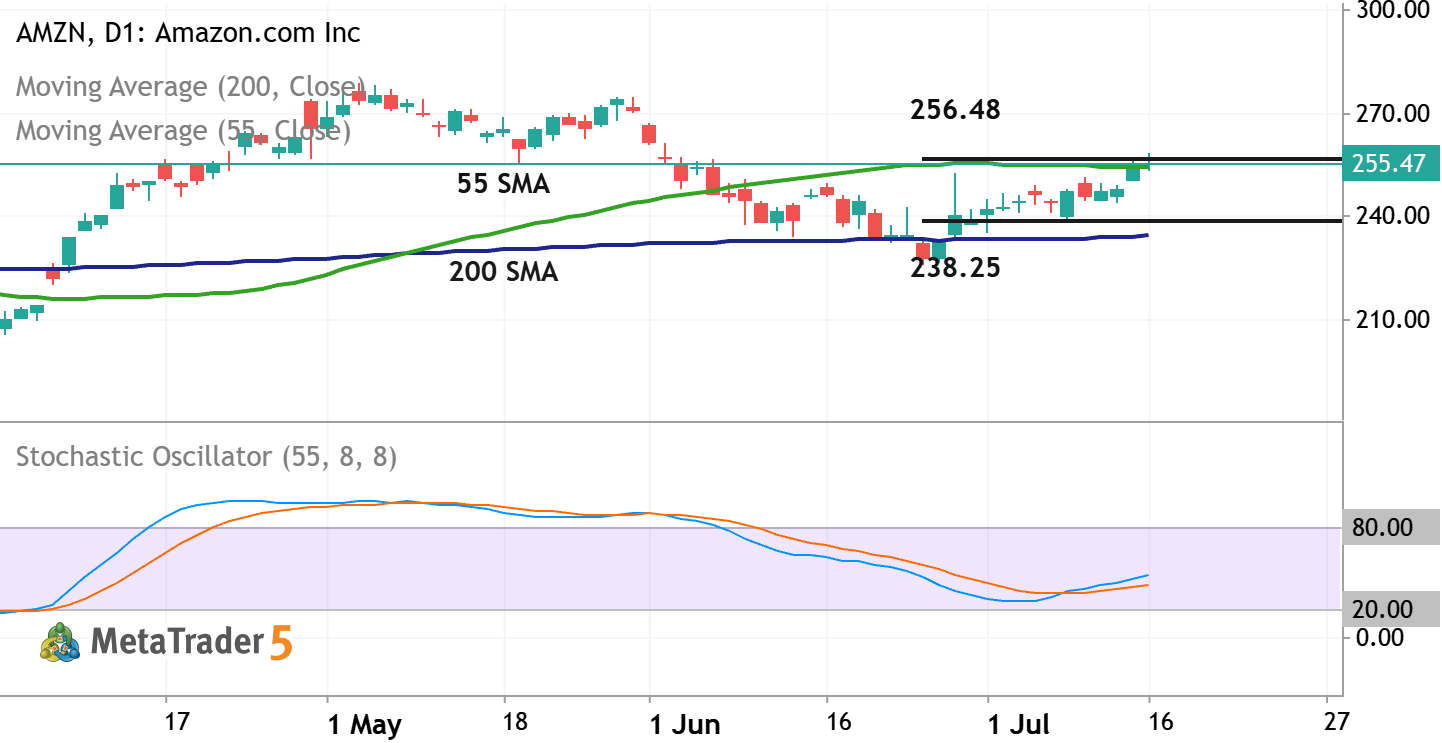
Daily price is located above 200 SMA in the bullish area of the chart. The Stochastic oscillator is showing the uptrend to be started by crossing the 50 level to above, and the price is trying to break the resistance level at 256.48 together with 55 SMA to above for the strong bullish trend to be continuing. If the price breaks resistance at 256.48 together with 55 SMA to above so the primary bullish market condition will be continuing for daily price. If the price crosses support level at 238.25 together with 200 SMA to below so the primary bearish reversal will be started. Alternatively, the price will be on secondary ranging above 200 SMA to be inside s/r levels waiting for direction of the strong trend tioo be started. Trading Summary : bullish ranging for direction.
0
newdigital Sergey Golubev 2026.07.16 15:30
AEM - Long-Term Technical Forecast AEM Short Agnico Eagle Mines Limited Common Stock
AEM - Long-Term Technical Forecast
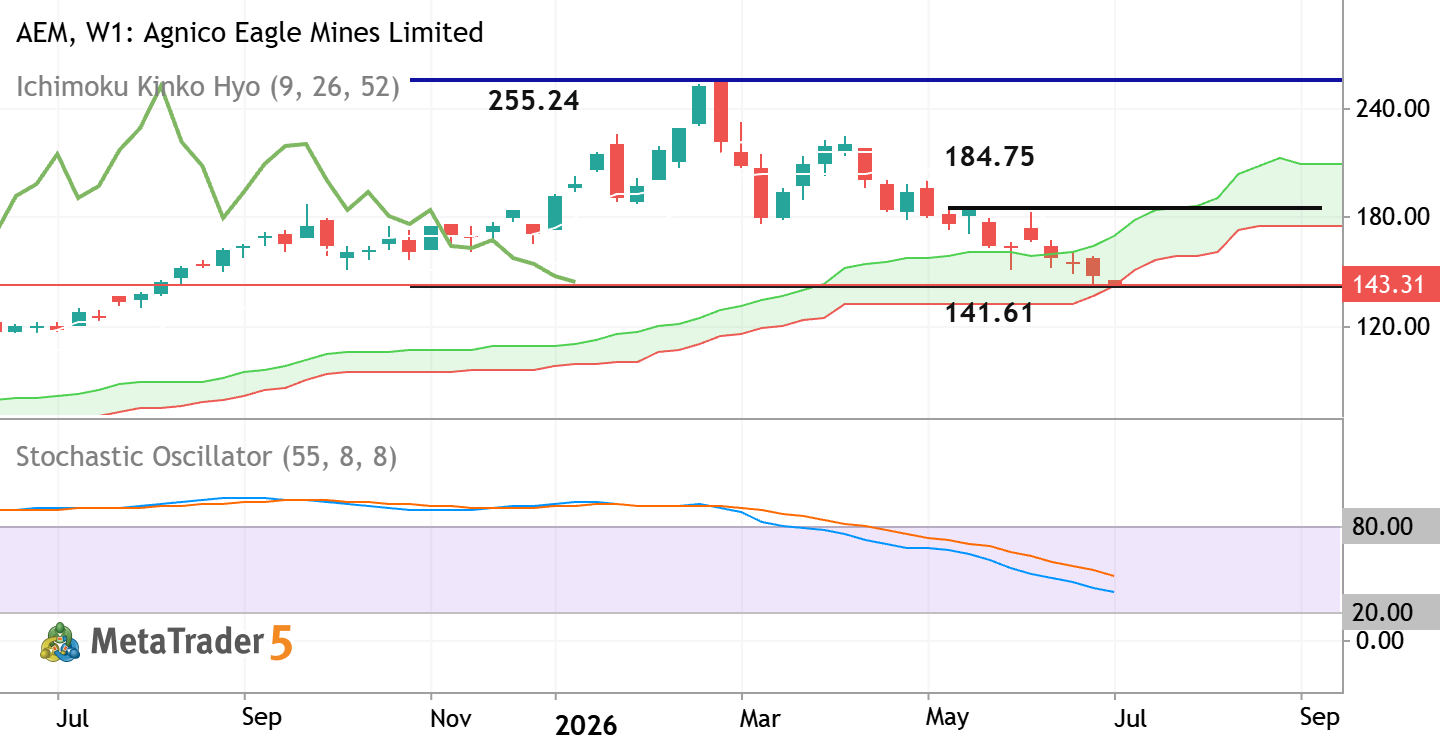
Weekly price is breaking the Ichimoku cloud to below for the possible weekly bearish reversal. Chinkou Spam line of Ichimoku indicator crossed the historical price for the strong breakdown to be started, and Stochastic oscillator is showing the downtrend in the near future as well for example. If the price breaks support level at 141.61 to below so the primary weekly bearish reversal will be started. If the price crosses resistance at 184.75 to above together with 255.24 as a good terget to re-enter so the weekly bullish trend will be resumed. Alternatively, the price will be on secondary ranging within s/r channel to be near and inside Ichimoku cloud waiting for the direction of the strong trend to be started. Trading Summary : possible breakdown with the primary weekly bearish reversal
2
newdigital Sergey Golubev 2026.07.13 16:35
INVH - Long-Term Forecast INVH Invitation Homes Inc. Common Stock
INVH - Long-Term Forecast
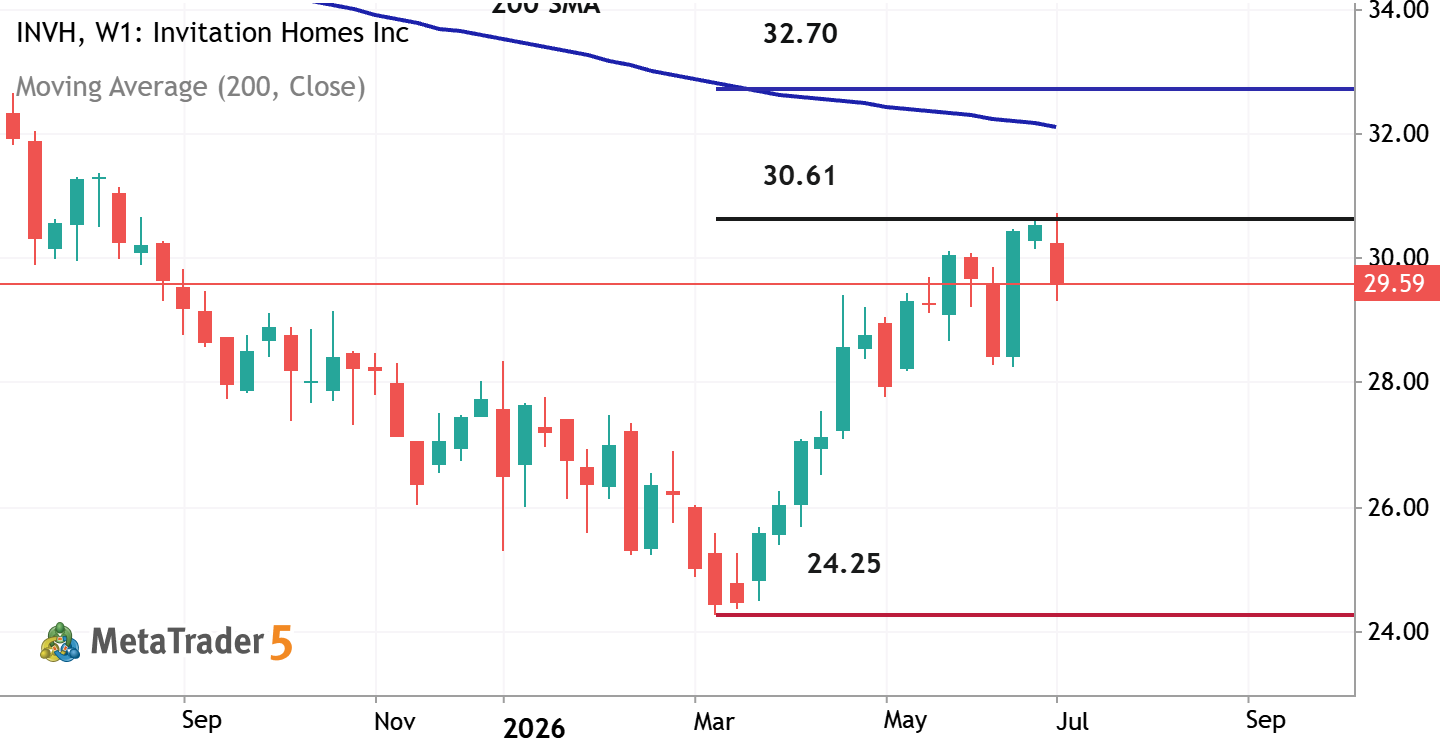
Weekly price is located below 200 SMA in the bearish area of the chart. The price was on bear market rally but it was bounced from resistance level at 30.61 to below for the bearish trend to be resumed. If the price breaks 30.61 resistance together with 200 SMA to above so the weekly bullish reversal will be started with 32.70 level as the possible target to re-enter. If the price crosses support level at 24.25 to below so the strong bearish trend will be continuing. Alternatively, the price will be on secondary ranging within the primary bearish trend to be within 24.25/30.61 s/r channel waiting for direction. Trading Summary : ranging to be near and below 200 waiting for direction
0
newdigital Sergey Golubev 2026.07.10 18:56
MRNA - Long-Term Technical Forecast MRNA Moderna, Inc. - Common Stock
MRNA - Long-Term Technical Forecast
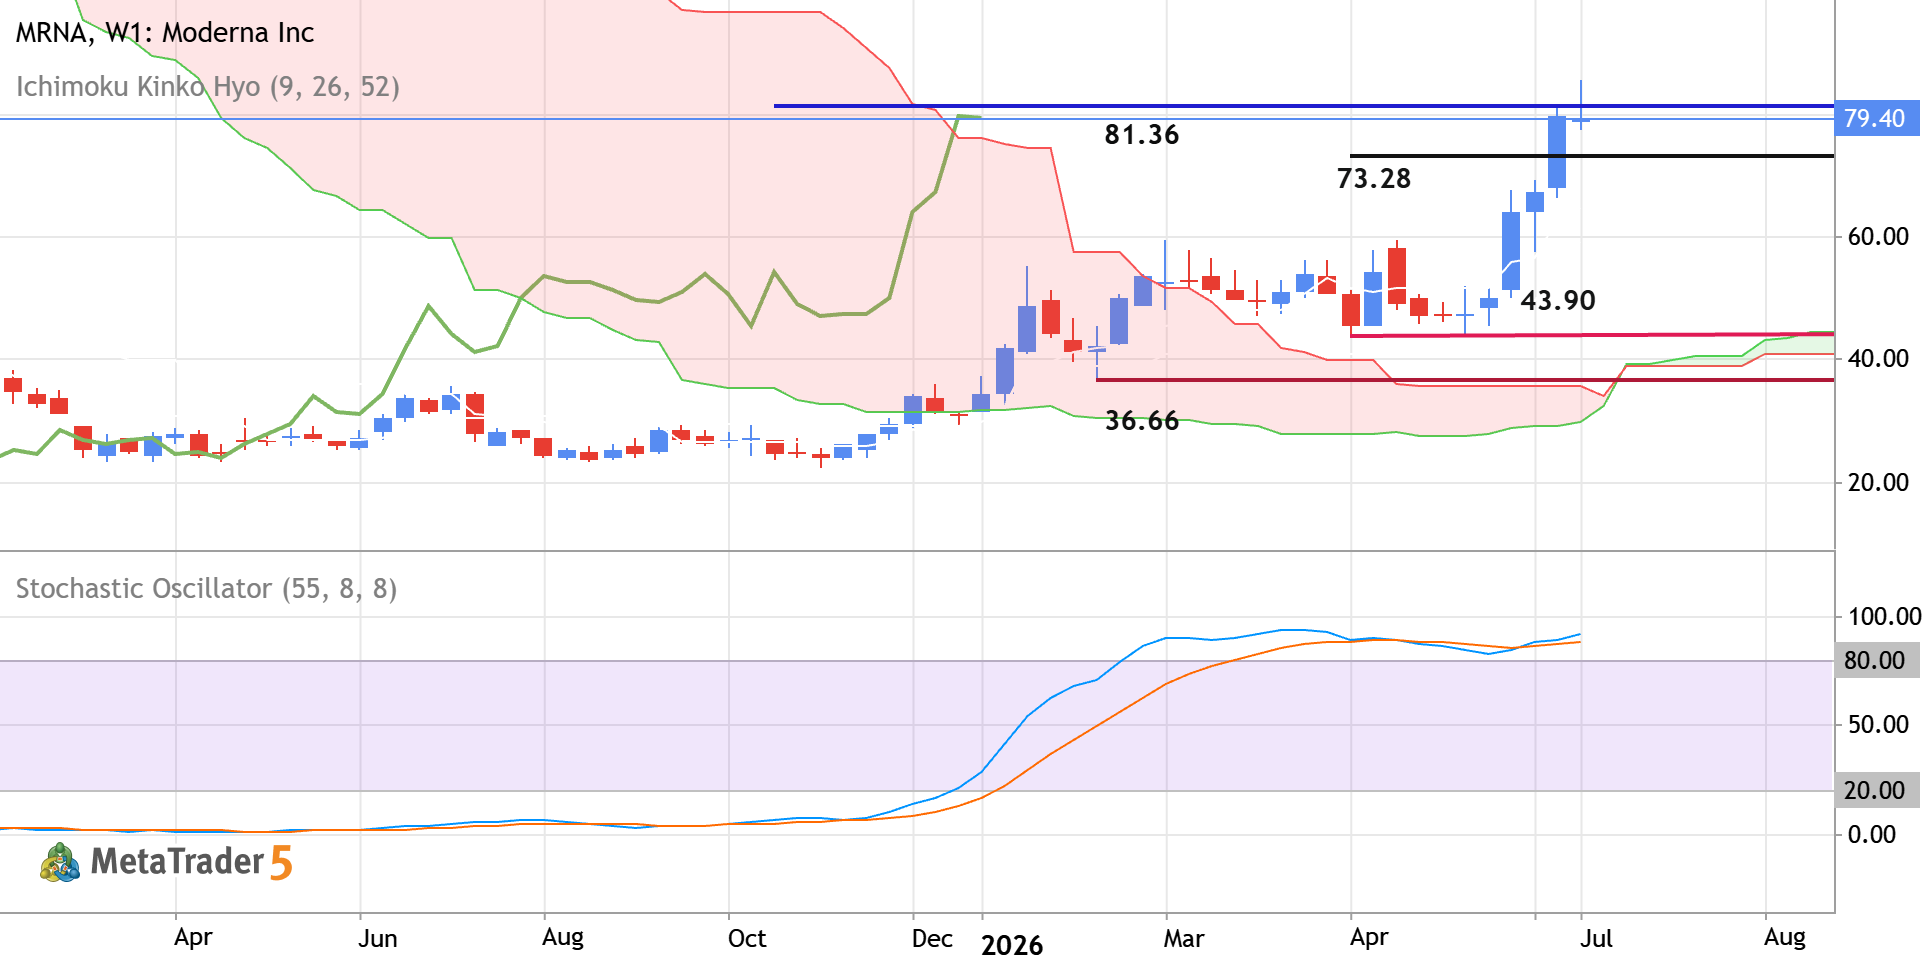
Weekly price is located above Ichimoku cloud in the bullish area of the chart for trying to cross the level at 81.36 to above for the strong bullish trend to be continuing. The price is on strong bullish breakout which is confirmed by Stochastic oscillator and Chinkou Span line. If the price breaks the 81.36 level to above on weekly close bar so the strong bullish trend will be continuing. If the price crosses the level at 73.28 to below so the secondary correction will be started. If the price breaks the support level at 43.90 to 36.66 to be crossed on weekly close bar so we may see the primary bearish reversal to be started on this W1 timeframe for example. Alternatively, the price will be on ranging to be near and above Ichimoku cloud waiting for direction. Trading Summary : bullish
0
newdigital Sergey Golubev 2026.07.07 17:40
SHIP - Long-Term Technical Forecast SHIP Seanergy Maritime Holdings Corp. - Common Stock
SHIP - Long-Term Technical Forecast
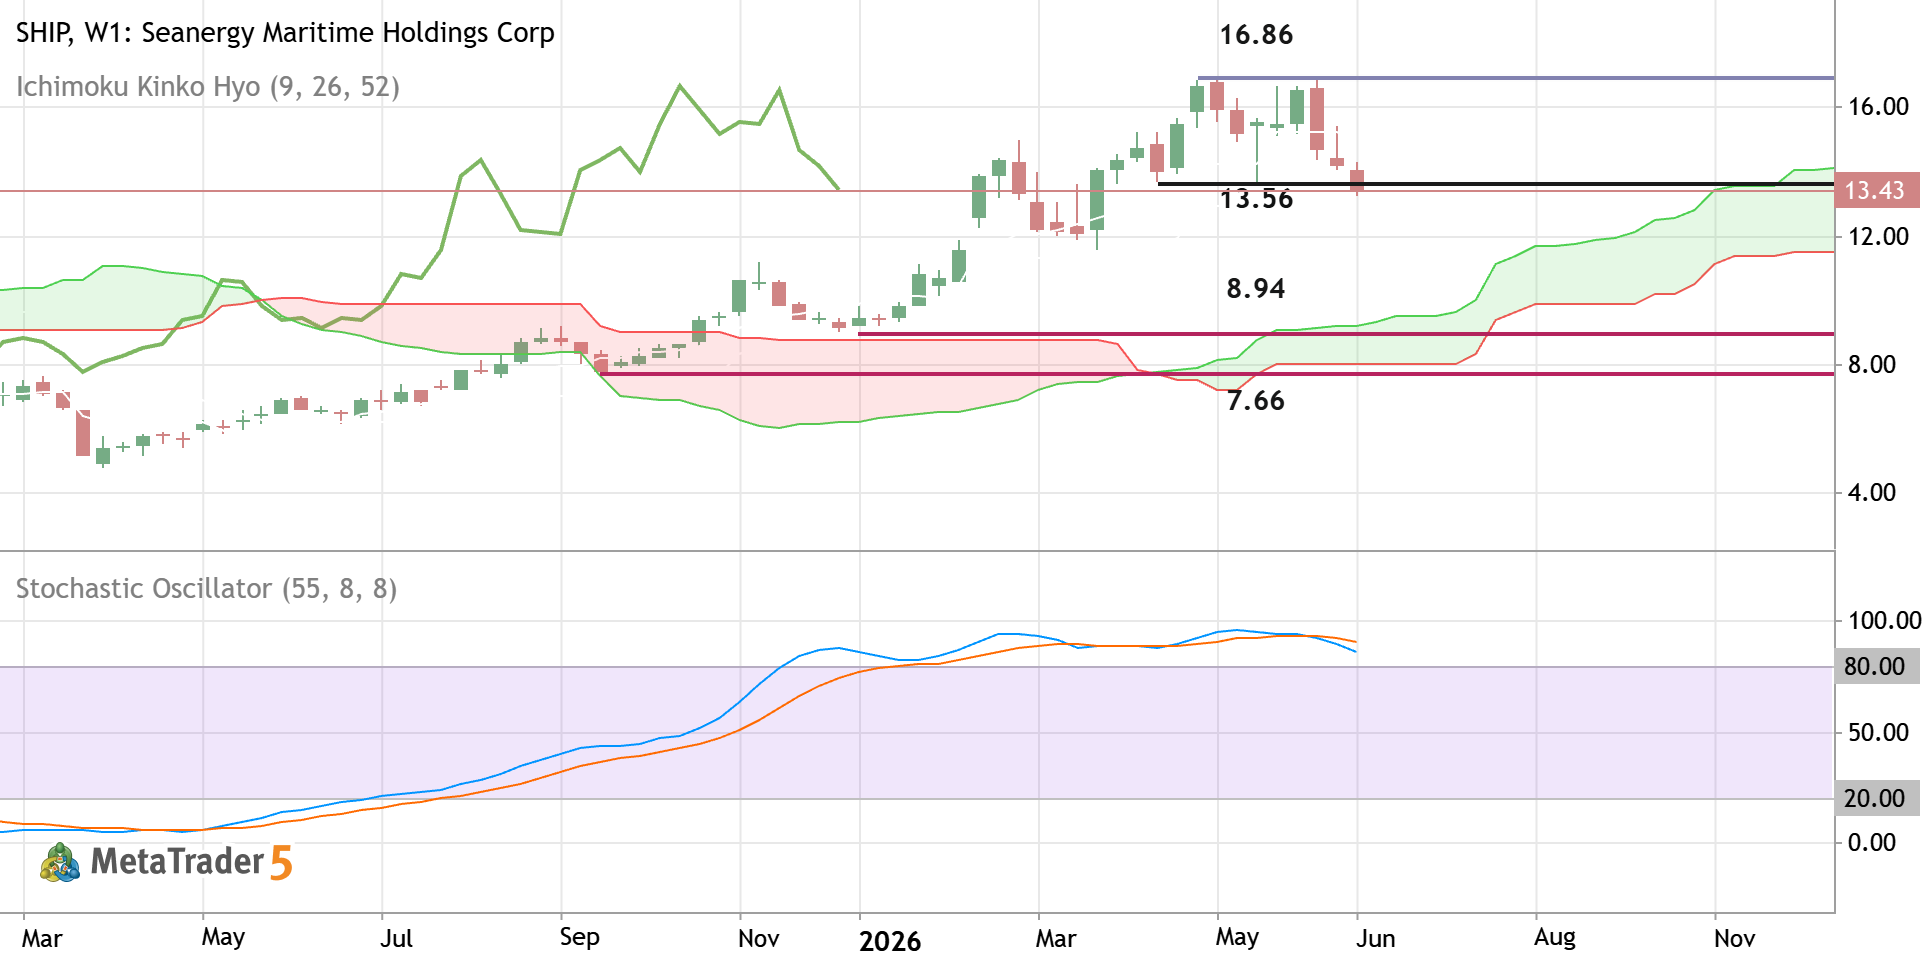
The weekly price is located above Ichimoku cloud in the bullish area of the chart. The price was bounced from support level at 16.86 to below for trying to break the next support level at 13.56 for the secondary correction to be started. If the price breaks the level at 13.56 to below on weekly close bar so we may see the secondary correction within the primary bullish market condition. If the price crosses 8.94 support to below together with the next support level at 7.66 so the primary bearish reversal will be started. Alternatively, the price will be on ranging to be near and above Ichimoku cloud waiting for the direction of the strong trend to be started. Trading Summary : ranging to the secondary correction
0
newdigital Sergey Golubev 2026.07.04 08:27
BGC - Daily Trading Forecast BGC BGC Group, Inc. - Class A Common Stock
BGC - Daily Trading Forecast
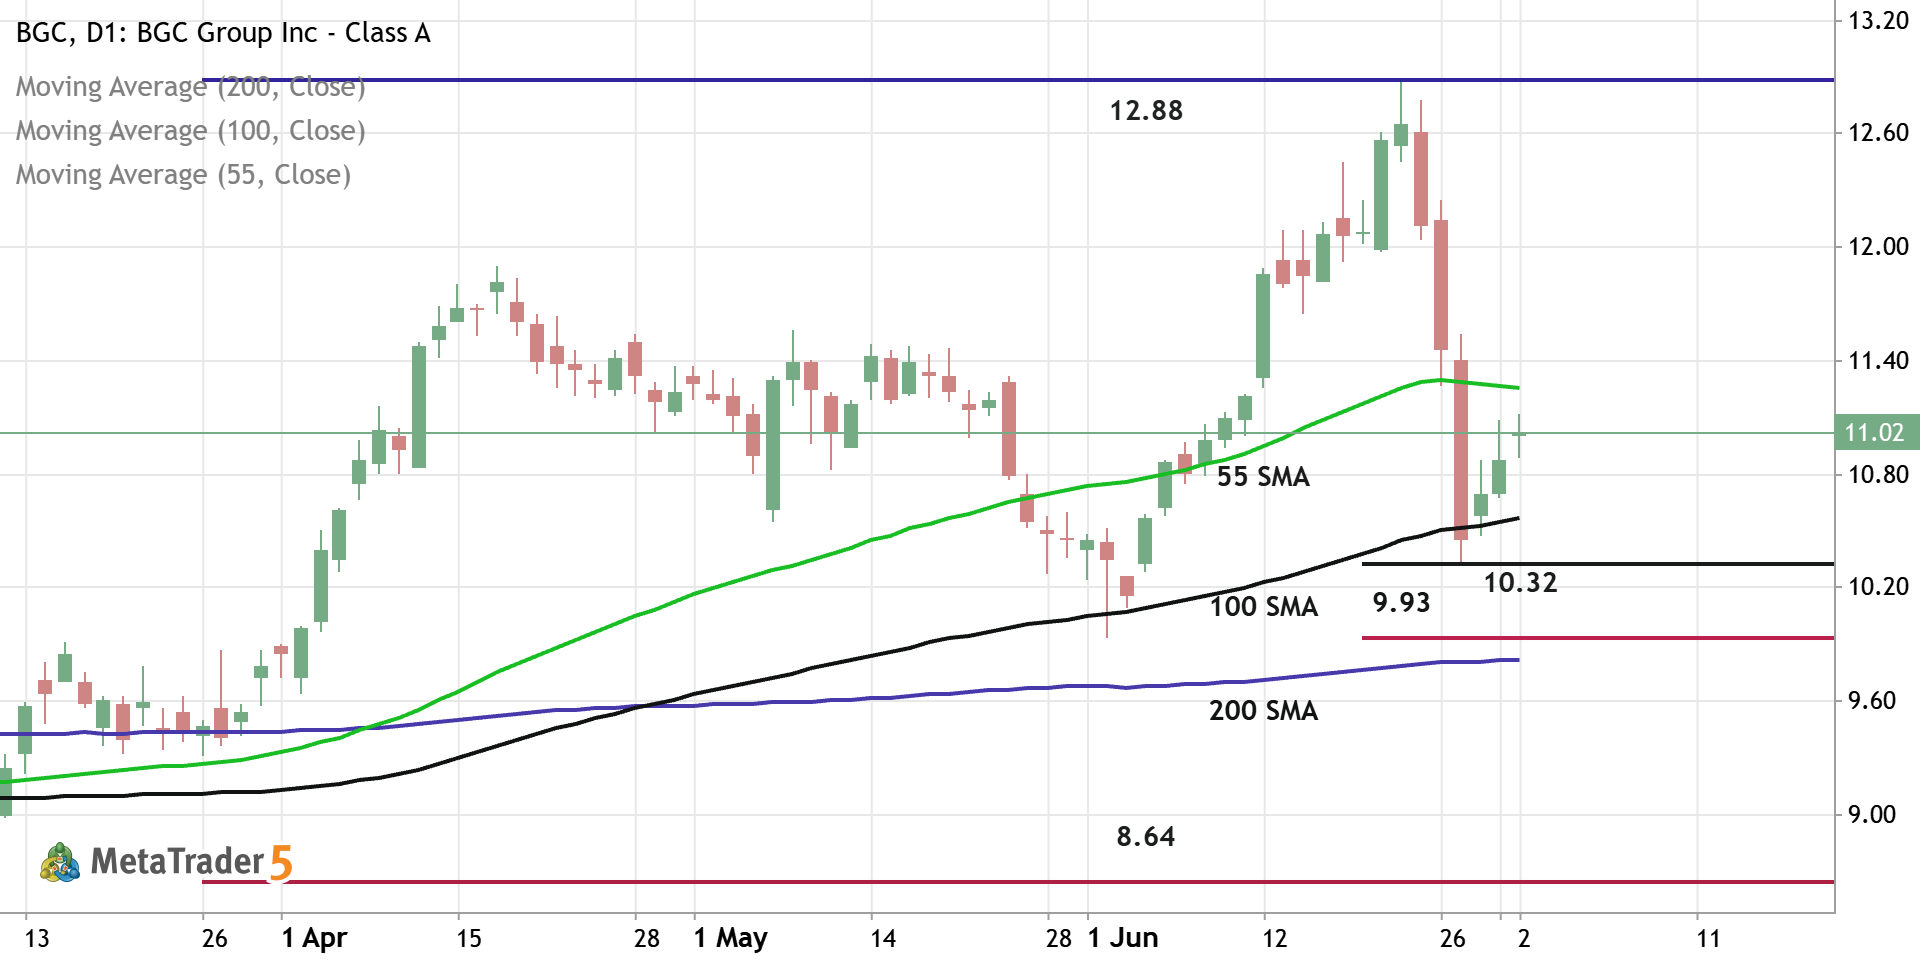
Daily price is located above 200-SMA in the bullish area of the chart. The price was bounced from support level at 10.32 and from 100-SMA to above for the pimary bullish trend to be continuing. If the price breaks 55-SMA to above so the strong bullish trend will be resumed with 12.88 resistance as the global possible target. If the price crosses support level at 9.93 together with 200-SMA to below so the primary bearish reversal will be started with 8.64 support level as the global possible target. Aternatively, the price will be on secondary ranging to be near and above 200 SMA waiting for direction. Trading Summary : waiting for direction
0
newdigital Sergey Golubev 2026.07.04 07:38
PYPL - Daily Rally to the Possible Bullish Reversal PYPL PayPal Holdings, Inc. - Common Stock
PYPL - Daily Rally to the Possible Bullish Reversal
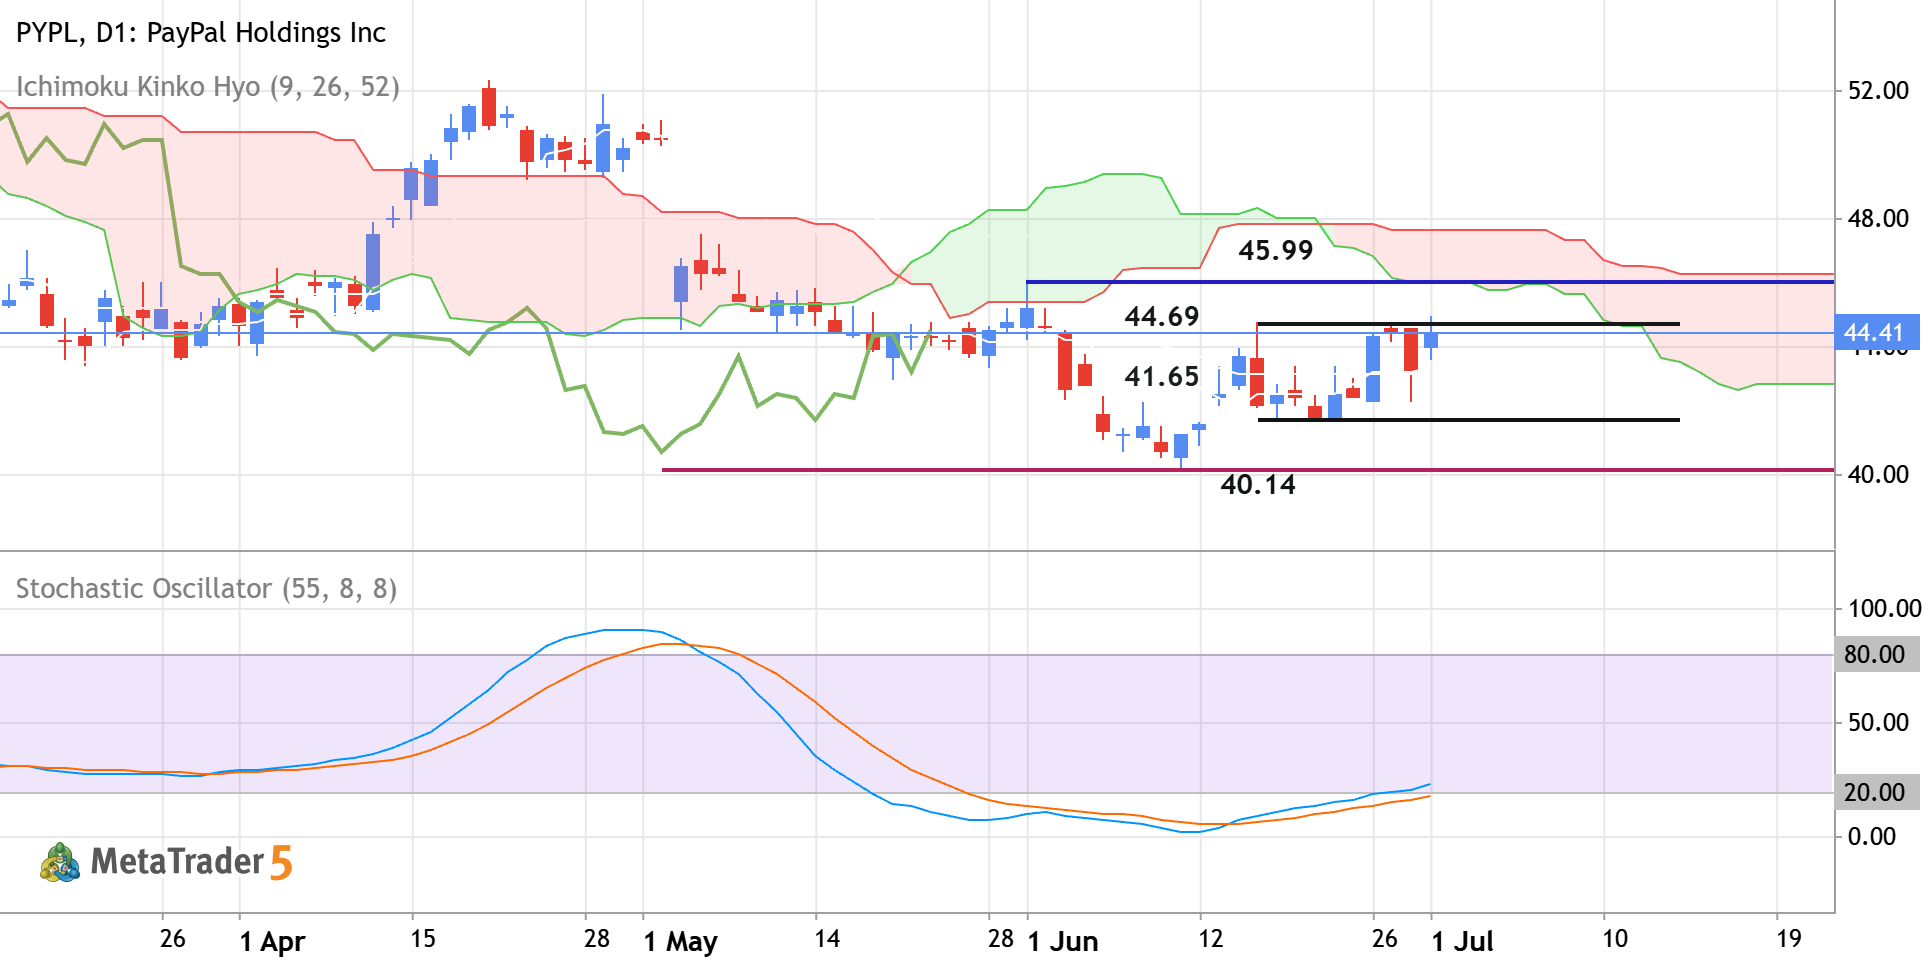
Daily price is located near and below Ichimoku cloud in the bearish area of the chart. The price was blinced from resistance levels at 40.14 and 41.65 to above for the bear market rally to be started. The Stochastic oscillator is showing the possible uptrend in the near future, and Chinkou Span line is crossing historical price but on open daily bar for now. If the price breaks the resistance level at 44.69 to the 45.99 to above so the primary bullish reversal will be started. If the price crosses support at 41.65 together with support level at 40.14 to below so the primary bearish trend will be resumed. Alternatively, the price will be on secondary ranging within the primary bearish trend to be near and below Ichimoku cloud waiting for direction of the strong trend to be started. Trading
0
newdigital Sergey Golubev 2026.07.01 18:06
AMZN - Breakdown with the Possible Bearish Reversal AMZN Short Amazon.com, Inc. - Common Stock
AMZN - Breakdown with the Possible Bearish Reversal
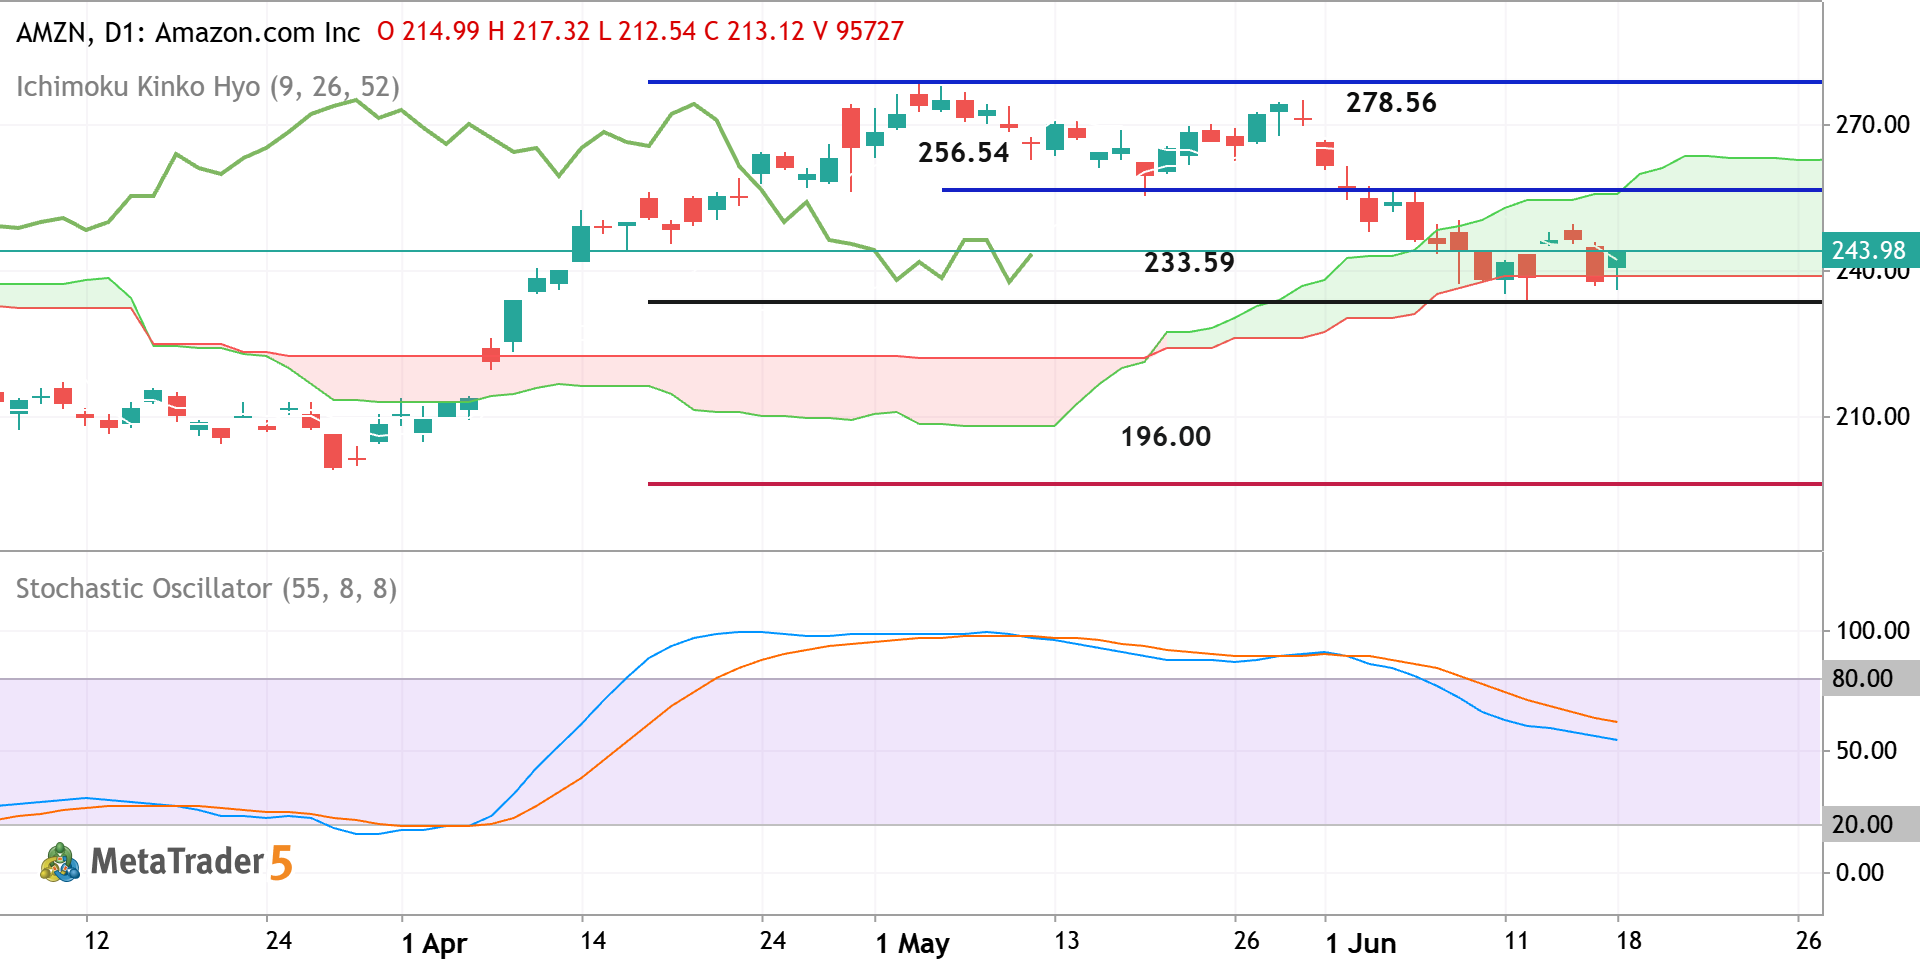
Daily price is located near and inside Ichimoku cloud for trying to break the support level at 233.59 to below for the primary bearish reversal to be started. Chinkou Span line of Ichimoku indicator broke the historical price to below for the strong breakdown to be started for the possible bearish reversal of the daily price movement. If the price crosses the 233.59 support ot below so we may see the primary bearish reversal with 196.00 as a possible target. If the price breaks the resistance at 256.54 to above so the primary bullish trend will be resumed with 278.56 target to re-enter, Alternatively, the price will be on secondary ranging to be inside and near the Ichimoku cloud waiting for direction. Trading Summary : breakdown with the possible bearish reversal
1
newdigital Sergey Golubev 2026.06.18 16:10
TTE - Daily Trading Forecast TTE Long TotalEnergies SE Ordinary Shares
TTE - Daily Trading Forecast
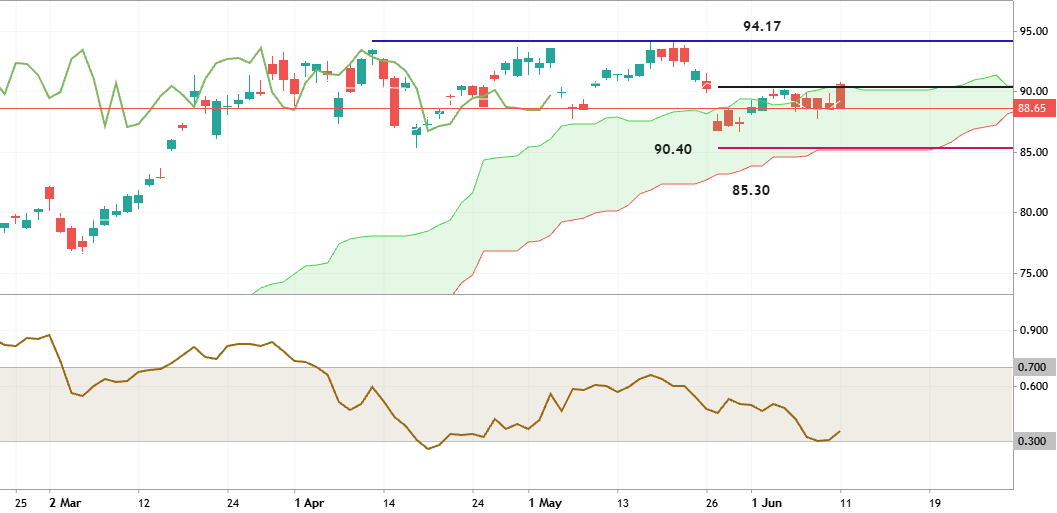
Daily price is located inside Ichimoku cloud for trying to cross the resistance level at 90.40 to above for the bullish trend to be resumed. If the price breaks resistance at 90.40 on the daily close bar so the bullish trend will be resumed with 94.17 resistance as the possible target. If the price crosses the support level at 85.30 so the daily bearish reversal will be started. Alternatively, the price will be on ranging waiting for direction. Trading Summary : ranging waiting for the bullish trend to be resumed.
4
newdigital Sergey Golubev 2026.06.11 17:43
HOOD - Long-Term Technical Forecast HOOD Robinhood Markets, Inc. - Class A Common Stock
HOOD - Long-Term Technical Forecast
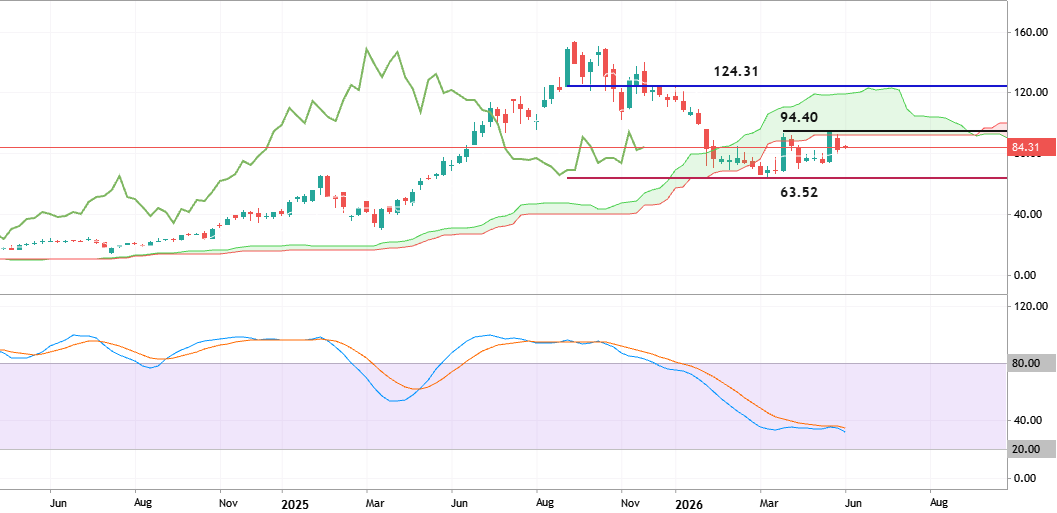
Weekly price is located near and below Ichimoku cloud in the bearish area of the chart. The symmentic pattern was formed with support level at 63.52 and resistance at 94.40. If the price breaks the support level at below on weekly close bar so the bearish trend will be resumed. If the price crosses the resistance level to above so the primary bullish reversal will be started with 124.31 resistance level as a final reversal target to re-enter. Alternatively, the price will be on secondary ranging to be inside s/r channel for direction. Trading Summary : ranging for direction - bearish trend to be resumed or the bullish reversal to be started.
1
newdigital Sergey Golubev 2026.06.08 17:31